English


The U.S. energy markets began the fourth quarter with a brief drop in WTI prices before experiencing an uptick that lasted through December. Similar to the third quarter, WTI crude oil prices ranged from the low $50s per barrel to low $60s per barrel, but remained relatively stable throughout the period, with limited daily volatility, and closed the quarter at $61 per barrel. Production output continued to increase despite a U.S. drilling rig count that continued to decline (down by a total of 278 rigs, 81 rigs in the Permian Basin alone, since the recent peak in late 2018), thereby further contributing to the oversupplied market. In fact, the EIA estimates that crude oil production will average 13.3 million barrels per day in 2020 (outpacing 12.2 million barrels per day in 2019) with most of the production growth occurring in the Permian Basin. Production growth, in the midst of the rig count decline, a decrease in active frac fleets, and limited increases in per frac stage productivity, is largely being driven by increases in the number of frac stages per fleet. The late 2019 emergence of the coronavirus has added uncertainty and concern to the demand outlook in the market, as the total impact of the pandemic remained uncertain at the end of the year. Natural gas prices fluctuated over the quarter, but continue to lag, ranging from a high of $2.86 per MMbtu to a low of $2.16 per MMbtu and ending the year 26% lower as operators struggled to find takeaway solutions for excess gas. The overall U.S. economy experienced a strong 2019 with the S&P 500 increasing 28.9%; however, energy markets lagged far behind with the Philadelphia Oil Service Sector Index (OSX) decreasing 2.9%.
Key Q4 Takeaways:
- WTI prices increased over the fourth quarter, closing up 12.9% (up 34.5% for the year);
- Henry Hub prices declined further over the quarter, ending 6.1% lower (down 25.5% for the year);
- Permian Basin continues to be the primary source of North American (“NAM”) E&P activity;
- Third quarter financial performance of the sector remained relatively muted with limited revenue growth, however most of the industry experienced stabilizing margins;
- Public market valuations for the broader U.S. market have seen strong and consistent gains through 2019; however, energy valuations lagged far behind amid concerns of oversupply; and
- Production & Well Services, Geophysical & Reservoir Services, and Manufacturing were the most active sub-segments over 2019 by transactions count
Crude Oil and Natural Gas
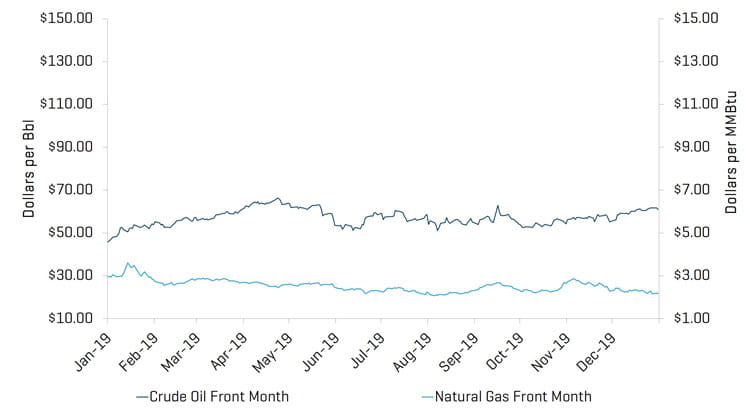
WTI crude oil prices closed the fourth quarter higher than the third quarter, increasing from $54.07 per barrel to $61.06. WTI crude prices ranged from a low of $52.81 on October 4 to a high of $61.72 on December 27.
Natural gas experienced a moderate amount of daily volatility during the fourth quarter; there were nineteen days during the quarter in which natural gas prices moved more than 3%. Overall, natural gas prices ended the quarter below the third-quarter close as record production highs continue to keep prices low leading into 2020.
Crude Oil (WTI) Prices and Natural Gas (Henry Hub) Prices
U.S. land rig count decreased by 55 rigs, from 860 to 805 rigs during the quarter. With the exception of the Eagle Ford Basin, all other regions saw declines in their rig counts, most notably the Woodford and Marcellus, decreasing by 17 rigs and nine rigs, respectively. Notwithstanding this rig count decline, crude oil production increased in 2019.
Historical U.S. Land Rig Count
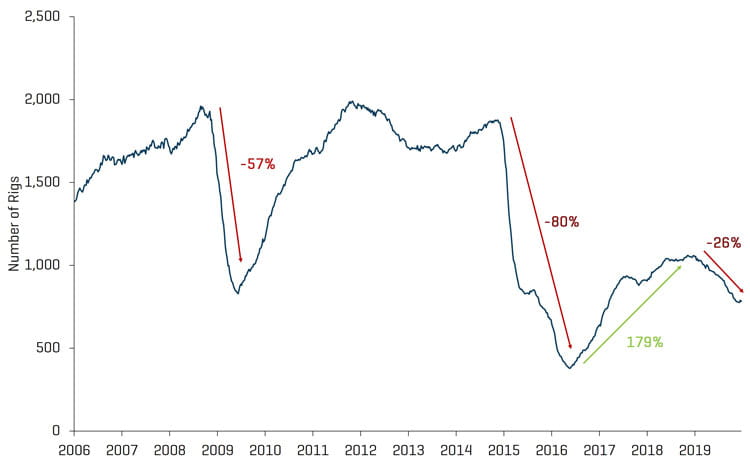
Source: Baker Hughes
Decrease in U.S. Land Rig Count Since Peak in 2018
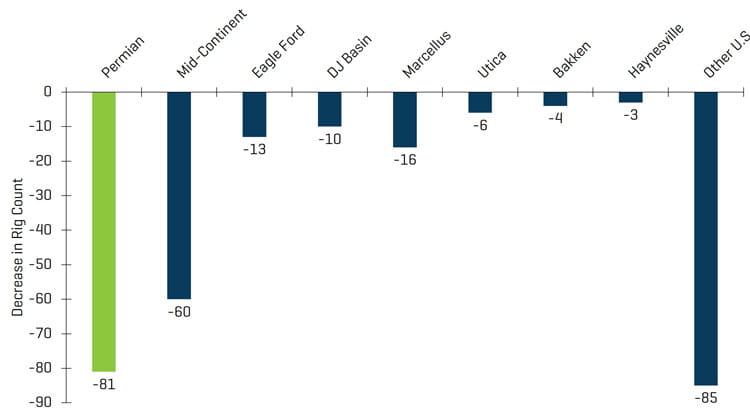
Source: Baker Hughes
Active frac fleets, even in the prolific Permian Basin, decreased in 2019, however the number of stages per fleet has continued to increase, driving record production. These factors illustrate the transition of rig count serving as the leading indicator of production to workover and re-frac activity as well as the number of stages being fracked per day indicating output.
Active Frac Fleets and Crude Oil Production
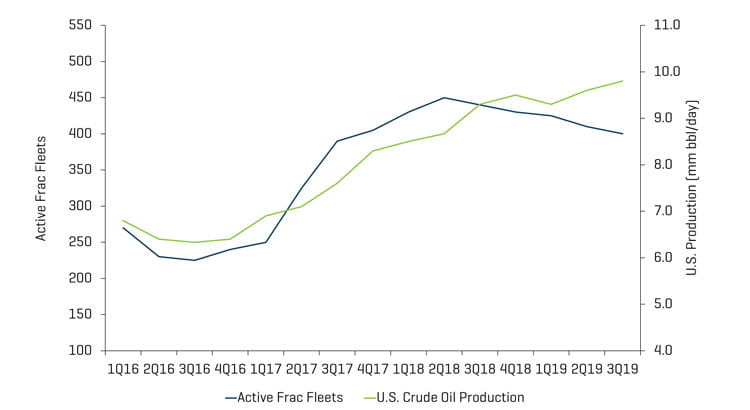
Resource: Industry Research
Frac Stages and Crude Oil Production
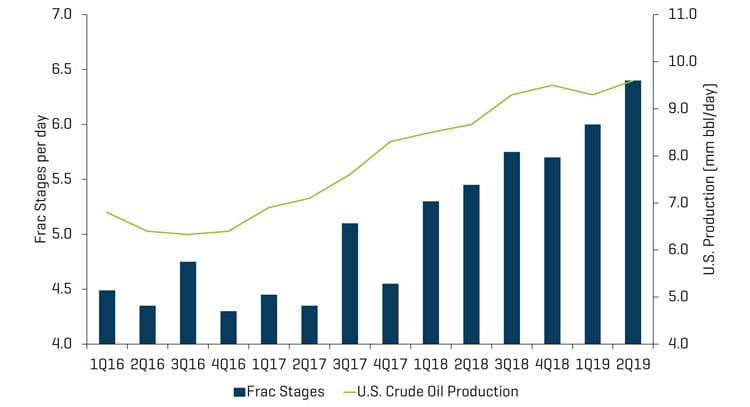
Source: Industry Research
Q3 Financial Results Yield No Surprises and Remain Subdued
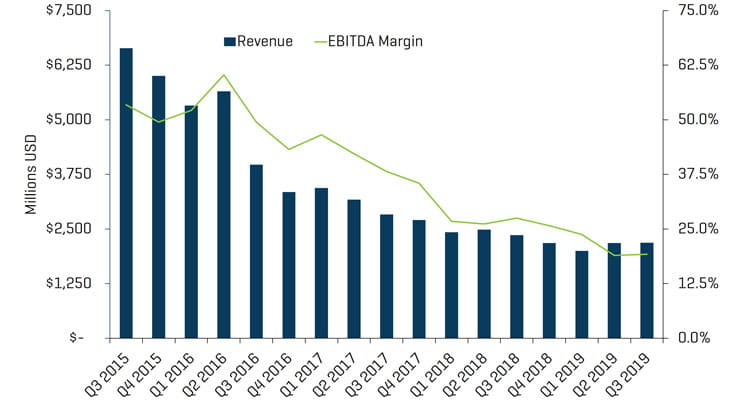
Revenue generally declined throughout the sector in the third quarter, however EBITDA margins showed some signs of stabilization, increasing slightly. Overall, results for the energy market were generally subdued, which contrasts the strong performance of the overall U.S. market. Revenue for Offshore Drilling and Equipment Manufacturers increased during the third quarter; however, EBITDA margins have remained flat. Production & Well Services performed similarly this quarter, with revenue up slightly and margins relatively flat, as differentiated service companies continue to gain market share, but competition continues to restrict material margin expansion. As production continues to be driven by increased efficiency, differentiated and well-positioned Production & Well Services companies that provide completion activity should see sustained positive results.
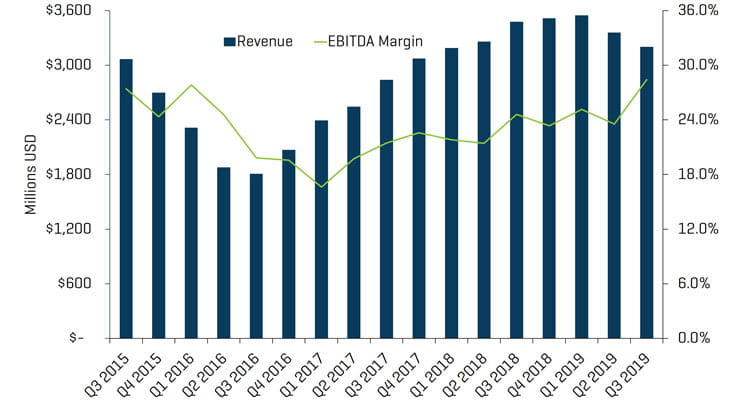
Offshore Drilling Quarterly Revenue And EBITDA Margins
Source: S&P Capital IQ
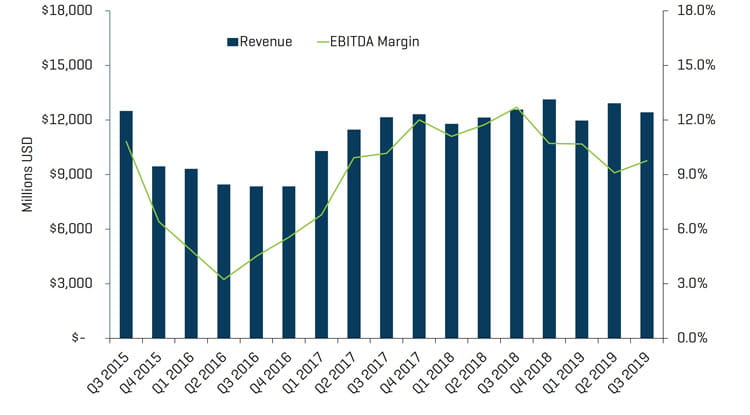
Production & Well Services Quarterly Revenue And EBITDA Margins
Source: S&P Capital IQ
Land Drilling Quarterly Revenue And EBITDA Margins
Source: S&P Capital IQ
Valuation Levels Turn Around and Improve in Q4
Public valuations for energy service companies rebounded during the quarter (increased 19.5%), though YoY performance greatly lagged the overall U.S. market. From December 31, 2018 the OSX has declined 2.9% compared with the S&P 500, which was up 28.9% during the same period.
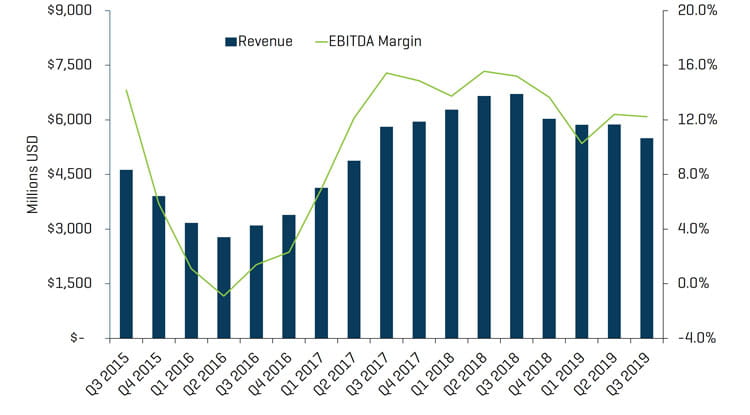
Energy Equipment Manufacturers saw modest margin improvements, increasing by 5% during the third quarter, while other sectors experienced relatively stable margins, remaining within 1% of the prior quarter. With respect to revenue, Offshore Drilling was the only sector that did not decrease, instead increasing by 0.4% quarter over quarter. During the previous 12 months, Land Drilling experienced the greatest EBITDA margin improvement, rising to 28.4% from 23.3%. Overall, each sub-segment experienced flat or slight margin contraction each quarter during the previous 12-month period, as competition in key regions continue to put pressure on margins.
Energy Equipment Manufacturers Quarterly Revenue And EBITDA Margins
Source: S&P Capital IQ
Equity Index Performance - OSX
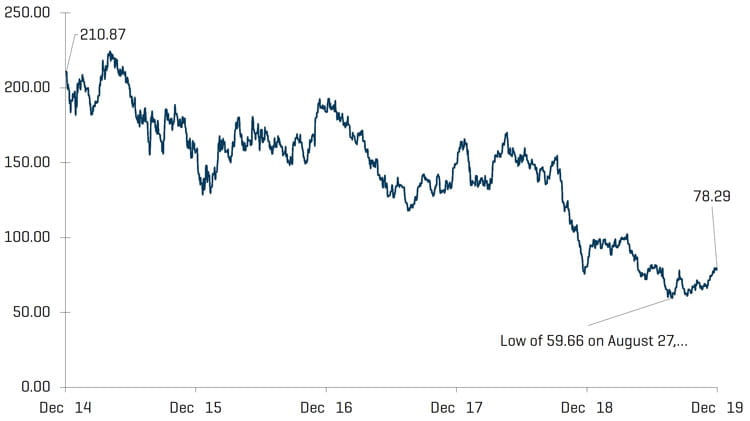
Source: S&P Capital IQ, Inc.
Equity Index Performance
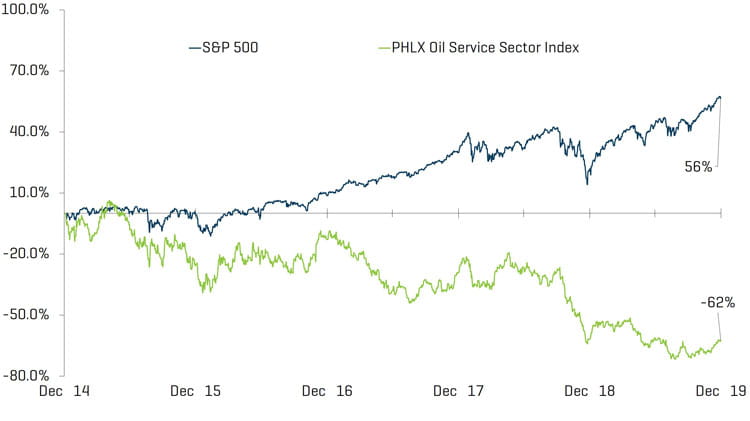
Source: S&P Capital IQ, Inc.
RECENT M&A TRENDS
M&A Activity Increased in Q4 Driven by Sponsor-Backed Add-Ons and Increased Focus on Water and Technology-Related Assets
Energy service and equipment M&A activity increased by transaction count and value in the fourth quarter of 2019, totaling 42 transactions and $4.5 billion, up from 35 transactions and $913.0 million in the third quarter. The increase in transaction dollar value was primarily driven by Apergy’s merger with Ecolab’s upstream business, ChampionX, for $4.4 billion. Excluding the largest transactions in the third and fourth quarters of 2019, reported transaction value decreased by $168.2 million from $313.0 million to $144.8 million, although the total number of transactions increased.
Improved M&A activity during 2019 provides for cautious optimism for 2020, although there are fundamental concerns regarding of weakening economic growth, geopolitical uncertainty, and uncertain global demand (further highlighted by the coronavirus). Total deal value reached $11.3 billion and total transactions were 167 transactions in 2019; both deal value ($8.2 billion) and transaction count (132) were higher than 2018.
NAM Oilfield Services And Equipment Transactions
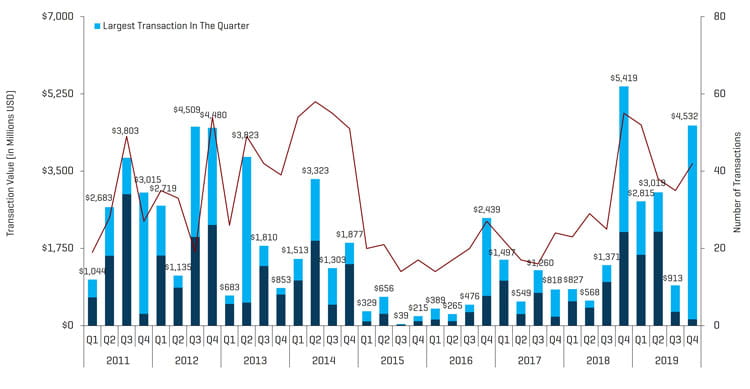
Source: 1Derrick, S&P Capital IQ, and proprietary information
Note: Q3 2015 excludes the Schlumberger/Cameron transaction value of $14.8 billion and Q4 2016 excludes the Baker Hughes/GE transaction value of $32.0 billion for scaling
Transactions in the fourth quarter of 2019 increased in quantity and value. The quarter-over-quarter increase in the total number of transactions was driven by additional activity within the Manufacturing subsegment (increasing from zero to seven transactions) and Tool Rental & Drilling Services (increasing from zero to three transactions). Overall within the Production & Well Services transactions, the fourth quarter showed a marked increase in high-quality water-related businesses as well as a focus on technology assets.
Q4 2019 NAM Energy Service And Equipment Transaction Count By Sector
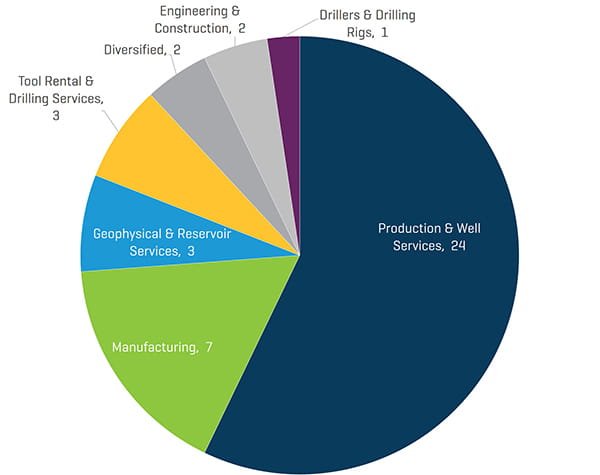
Source: 1Derrick, S&P Capital IQ, and proprietary information
Q4 2019 NAM Energy Service And Equipment Transaction Value By Sector (Millions USD)
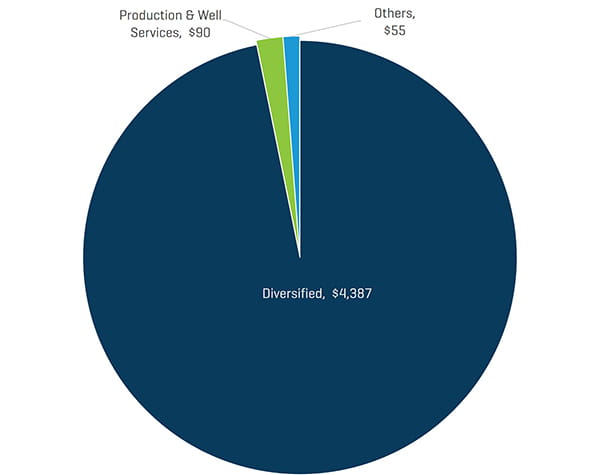
Source: 1Derrick, S&P Capital IQ, and proprietary information
Q4 2019 NAM Energy Service And Equipment Transaction Count By Buyer Profile
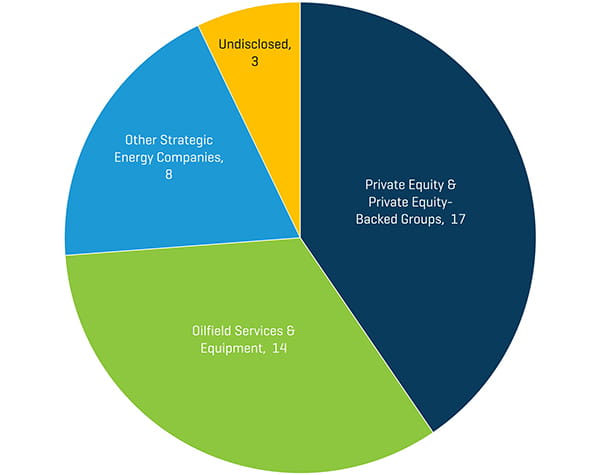
Source: 1Derrick, S&P Capital IQ, and proprietary information
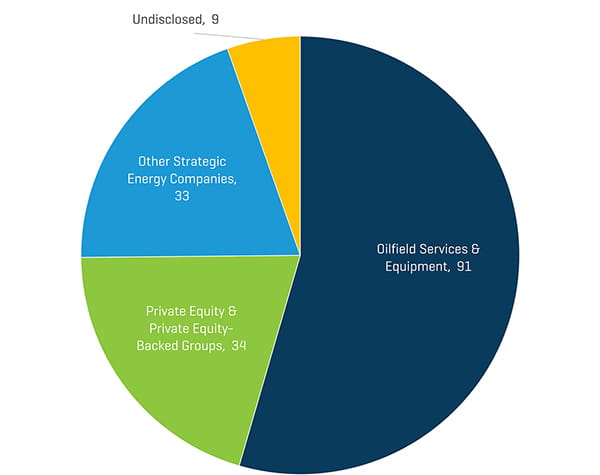
Strategic acquirers were the most active acquirers of Energy Service & Equipment businesses during the fourth quarter of 2019 (52% of all transactions) with PE and PE-backed groups representing 41% of the total fourth-quarter deals (with undisclosed buyers making up the remaining 7%). While sponsor activity increased during the fourth quarter, it’s worth noting that the majority of the sponsor-backed acquisitions were add-ons (sponsor-owned acquirors), as opposed to new platforms. Strategic acquirers, representing 74% of the acquisitions in 2019, were far more active than PE and PE-backed groups, representing only 20% during the same full-year period.
2019 NAM Energy Service And Equipment Transaction Count By Sector
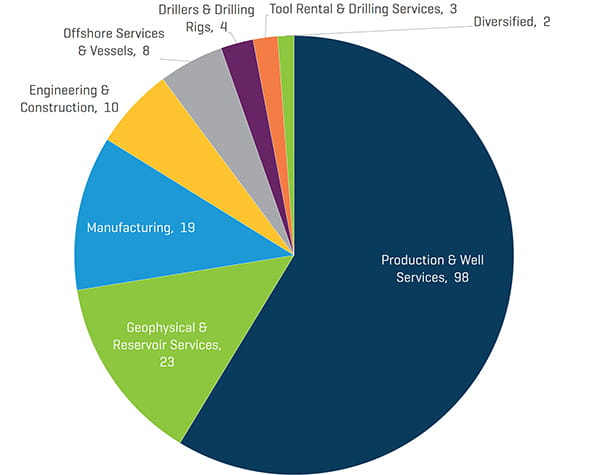
Source: 1Derrick, S&P Capital IQ, and proprietary information
2019 NAM Energy Service And Equipment Transaction Value By Sector (Millions USD)
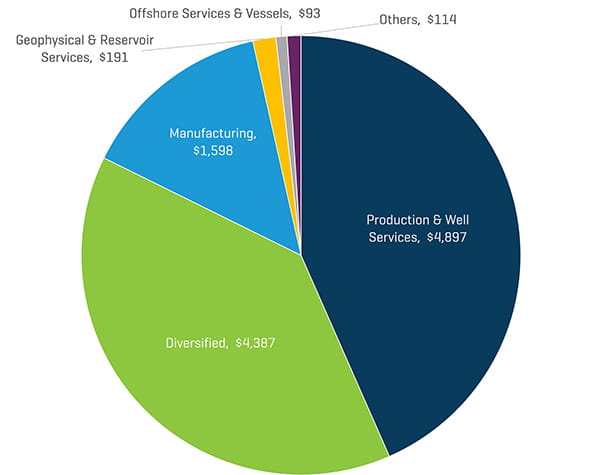
Source: 1Derrick, S&P Capital IQ, and proprietary information
2019 NAM Energy Service And Equipment Transaction Count By Buyer Profile