English


In the third quarter of 2019, the energy markets experienced a general decline as crude prices experienced significant volatility due to the strategic attacks on Saudi oil fields and uncertainty surrounding future demand. WTI crude oil prices ranged from the low $50s to low $60s during the quarter. U.S. drilling rig counts also declined while global production fluctuated, decreasing due to the Saudi attacks then rebounding as the shut-in was restored. Despite strong year-to-date performance of the overall U.S. economy, U.S. producers continue to cut rigs and frac spreads due to continued excess supply and concerns of an impending global slowdown. U.S. producers also continue to remain focused on price stability and living within cash flows, which may serve as a moderate headwind to U.S. production. While takeaway capacity remains a moderate constraint in moving production to market, particularly in the Permian Basin, the IEA estimates that as the pace of pipeline and terminal installations progresses, the U.S. will continue to challenge Saudi Arabia as the world’s top oil exporter. The downstream market also continues to benefit from ample feedstock supply. Oilfield service and equipment activity remains competitive in key regions such as the Permian, leading to margin compression. As a response to the competitiveness in key regions, players have begun to decamp congested areas of key basins, instead shifting focus to plays in regions such as the Northern portion of the Delaware Basin (located in New Mexico). Natural gas remained a relatively stagnant market during the quarter, though prices have recently jumped in October 2019.
Key Q3 Takeaways:
- Crude oil prices declined late in the quarter after Saudi Arabia restored the shut-in, closing 7.5% lower than the second quarter
- Natural gas prices remained relatively flat, ending 1.0% down for the quarter (though October has witnessed a marked increase)
- The Permian Basin remains the primary source of North American (“NAM”) E&P activity
- Financial performance, including EBITDA growth and margin expansion, declined in the third quarter of 2019. Performance expectations have softened for the fourth quarter of 2019 as commodity prices are no longer expected to increase, but instead begin to stabilize
- Public market valuation levels remained relatively flat during the quarter (S&P increasing 1.2%)
- Production & Well Services remains the most active sub-segment
CRUDE OIL AND NATURAL GAS
After a quarter of moderate volatility, WTI crude oil prices closed the third quarter lower than the end of the second quarter, decreasing from $58.47 per barrel to $54.07. WTI crude prices fluctuated between a low of $51.09 on August 7 and a high of $62.90 on September 16 following attacks on Saudi oil fields. Oil production there was quickly restored, however, causing prices to decrease more than 14% to close the quarter. As concerns of the global economy persist, uncertainty surrounding future oil demand continued through the end of the quarter.
Natural gas experienced greater daily volatility in the third quarter; there were 13 days during the quarter in which natural gas prices moved more than 3%. Overall, natural gas prices ended the quarter above the second-quarter close. Natural gas production continues to reach record highs, which is expected to continue to keep prices at historically low levels in the fourth quarter of 2019 and into 2020. Recent (October) price improvement was driven by expectations of a colder-than-usual November.
Crude Oil [WTI] Prices and Natural Gas [Henry Hub] Prices
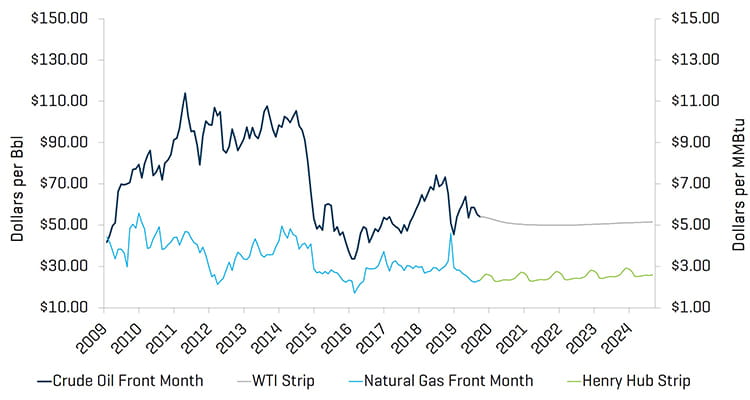
Source: Bloomberg, as of September 30, 2019
Crude oil production was relatively flat during the first half of 2019 and is expected to remain flat or decline slightly amid concerns of oversupply. The average U.S. land rig count decreased by 107 rigs, from 967 to 860 rigs during the quarter. With the exception of the Arkoma Woodford and Barnett Basin, most regions experienced declines in their rig counts, most notably the Permian, which was lower by 27 rigs, and the Cana Woodford, which was lower by 11 rigs.
Historical U.S. Land Rig Count
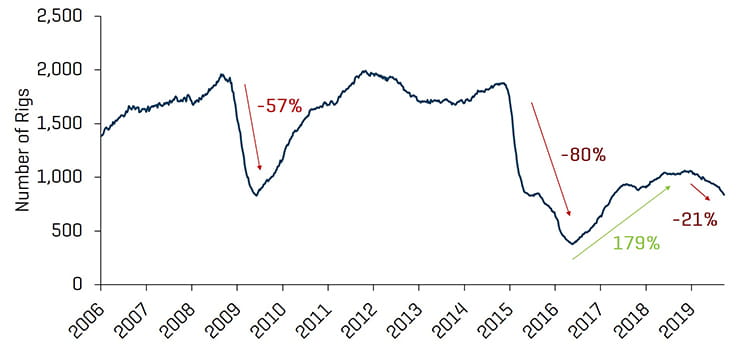
Source: Baker Hughes
Decrease in U.S. Land Rig Count Since Peak in 2018
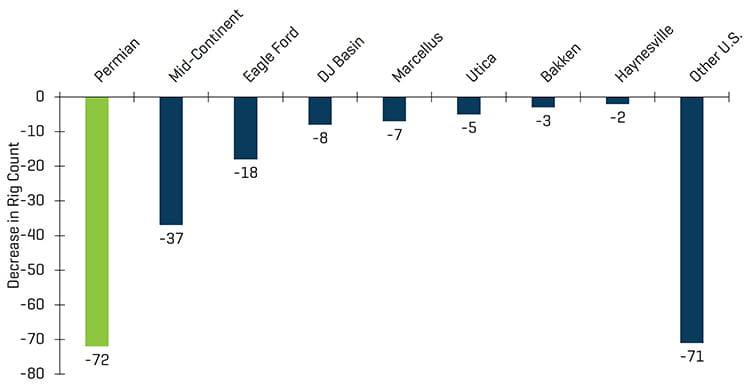
Source: Baker Hughes
Q2 Financial Results Generally Remain Depressed
Revenue and EBITDA margins experienced mixed results by sector in the second quarter of 2019, while, amidst recent softening, the overall market has remained up year-to-date (S&P 500 rising approximately 19%). Revenue for Offshore Drilling and Equipment Manufacturers increased moderately from the previous quarter, however, due to employee costs in a continued tight labor market and increased material prices, EBITDA margins have remained compressed. Production & Well Services revenue remained stable quarter over quarter; however the segment realized modest margin improvements for the first quarter in over a year as the strongest service companies have leveraged stable revenues for a third straight quarter to move focus to recovering cash flow. Crude price performance is expected to remain moderated due to the uncertainty in the market. Production levels in the U.S., driven by the Permian Basin, are expected to continue to grow through the end of 2020 as takeaway infrastructure continues to come online, which should continue to support activity in the sector even as prices are expected to remain range-bound.
Production & Well Services Quarterly Revenue and EBITDA Margins
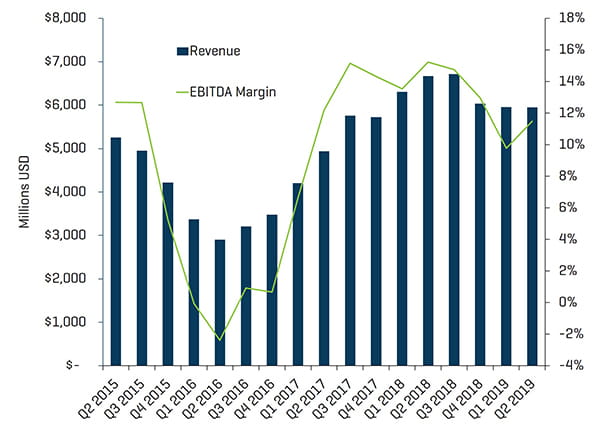
Source: S&P Capital IQ
Land Drilling Quarterly Revenue and EBITDA Margins
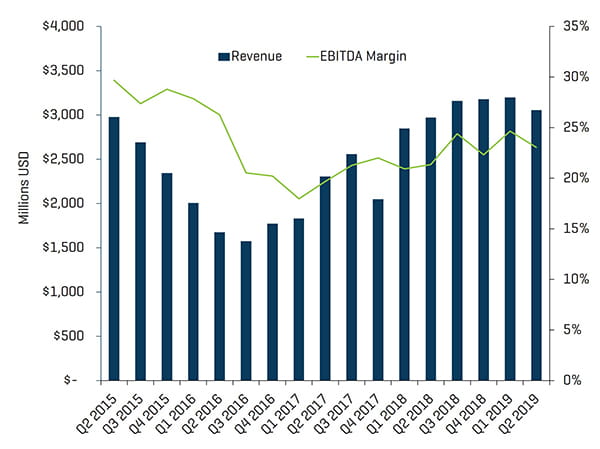
Source: S&P Capital IQ
Energy Equipment Manufacturers Quarterly Revenue and EBITDA Margins
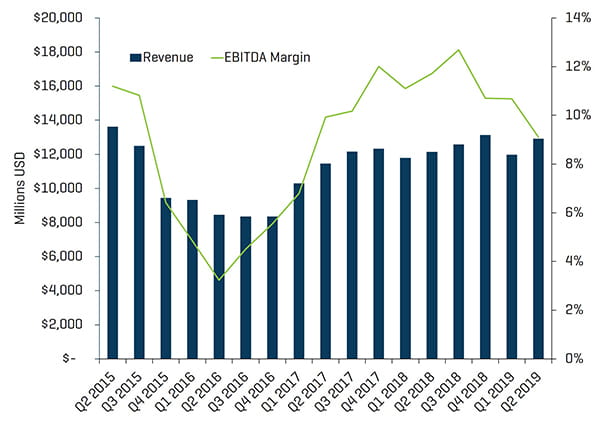
Source: S&P Capital IQ
Valuation Levels Remain Depressed as Broader Market Softens
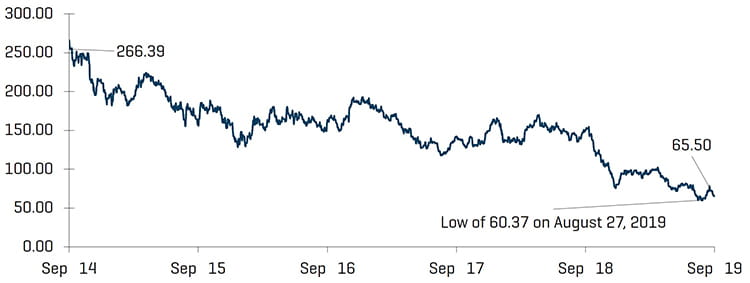
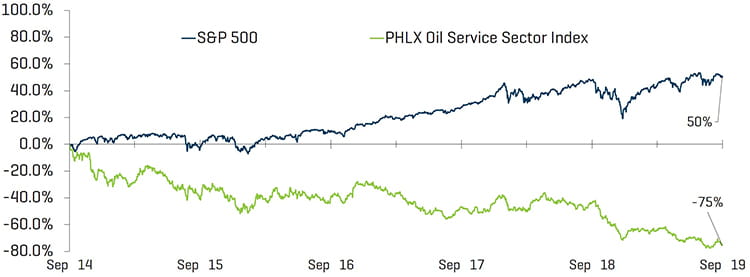
Public valuations for energy companies declined during the quarter (Philadelphia Oil Service Sector Index (OSX) decreased 19.5%), and year-over-year valuations continue to lag the overall market. From September 30, 2018, the OSX has declined 56.2% compared with the S&P 500, which was up 1.2% over the same period. The energy sector, as a whole, continues to underperform the broader market. Wall Street analysts expect energy stocks to continue to lag S&P performance throughout 2019, with investors securing positions in quality stocks that have operations in key basins such as the Permian Basin with diversification/growth opportunities in other key basins.
Energy Equipment Manufacturers, Offshore Drilling, and Land Drilling experienced margin contraction in the second quarter of 2019 dipping 2.6%, 4.8%, and 1.6%, respectively. Offshore Drilling and Energy Equipment Manufacturers revenue grew modestly, 8.7% and 7.8%, respectively, faring better than each of the other sectors.
Offshore Drilling Quarterly Revenue and EBITDA Margins
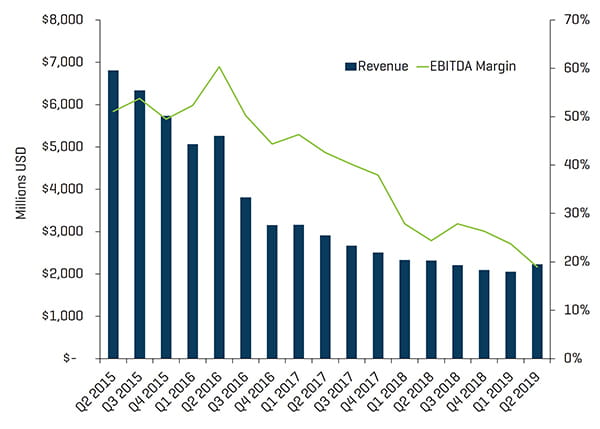
Source: S&P Capital IQ
Equity Index Performance - OSX
Source: S&P Capital IQ
Equity Index Performance
Source: S&P Capital IQ
RECENT M&A TRENDS
M&A Activity Weakened Likely Due to Continued Volatility Through 2019
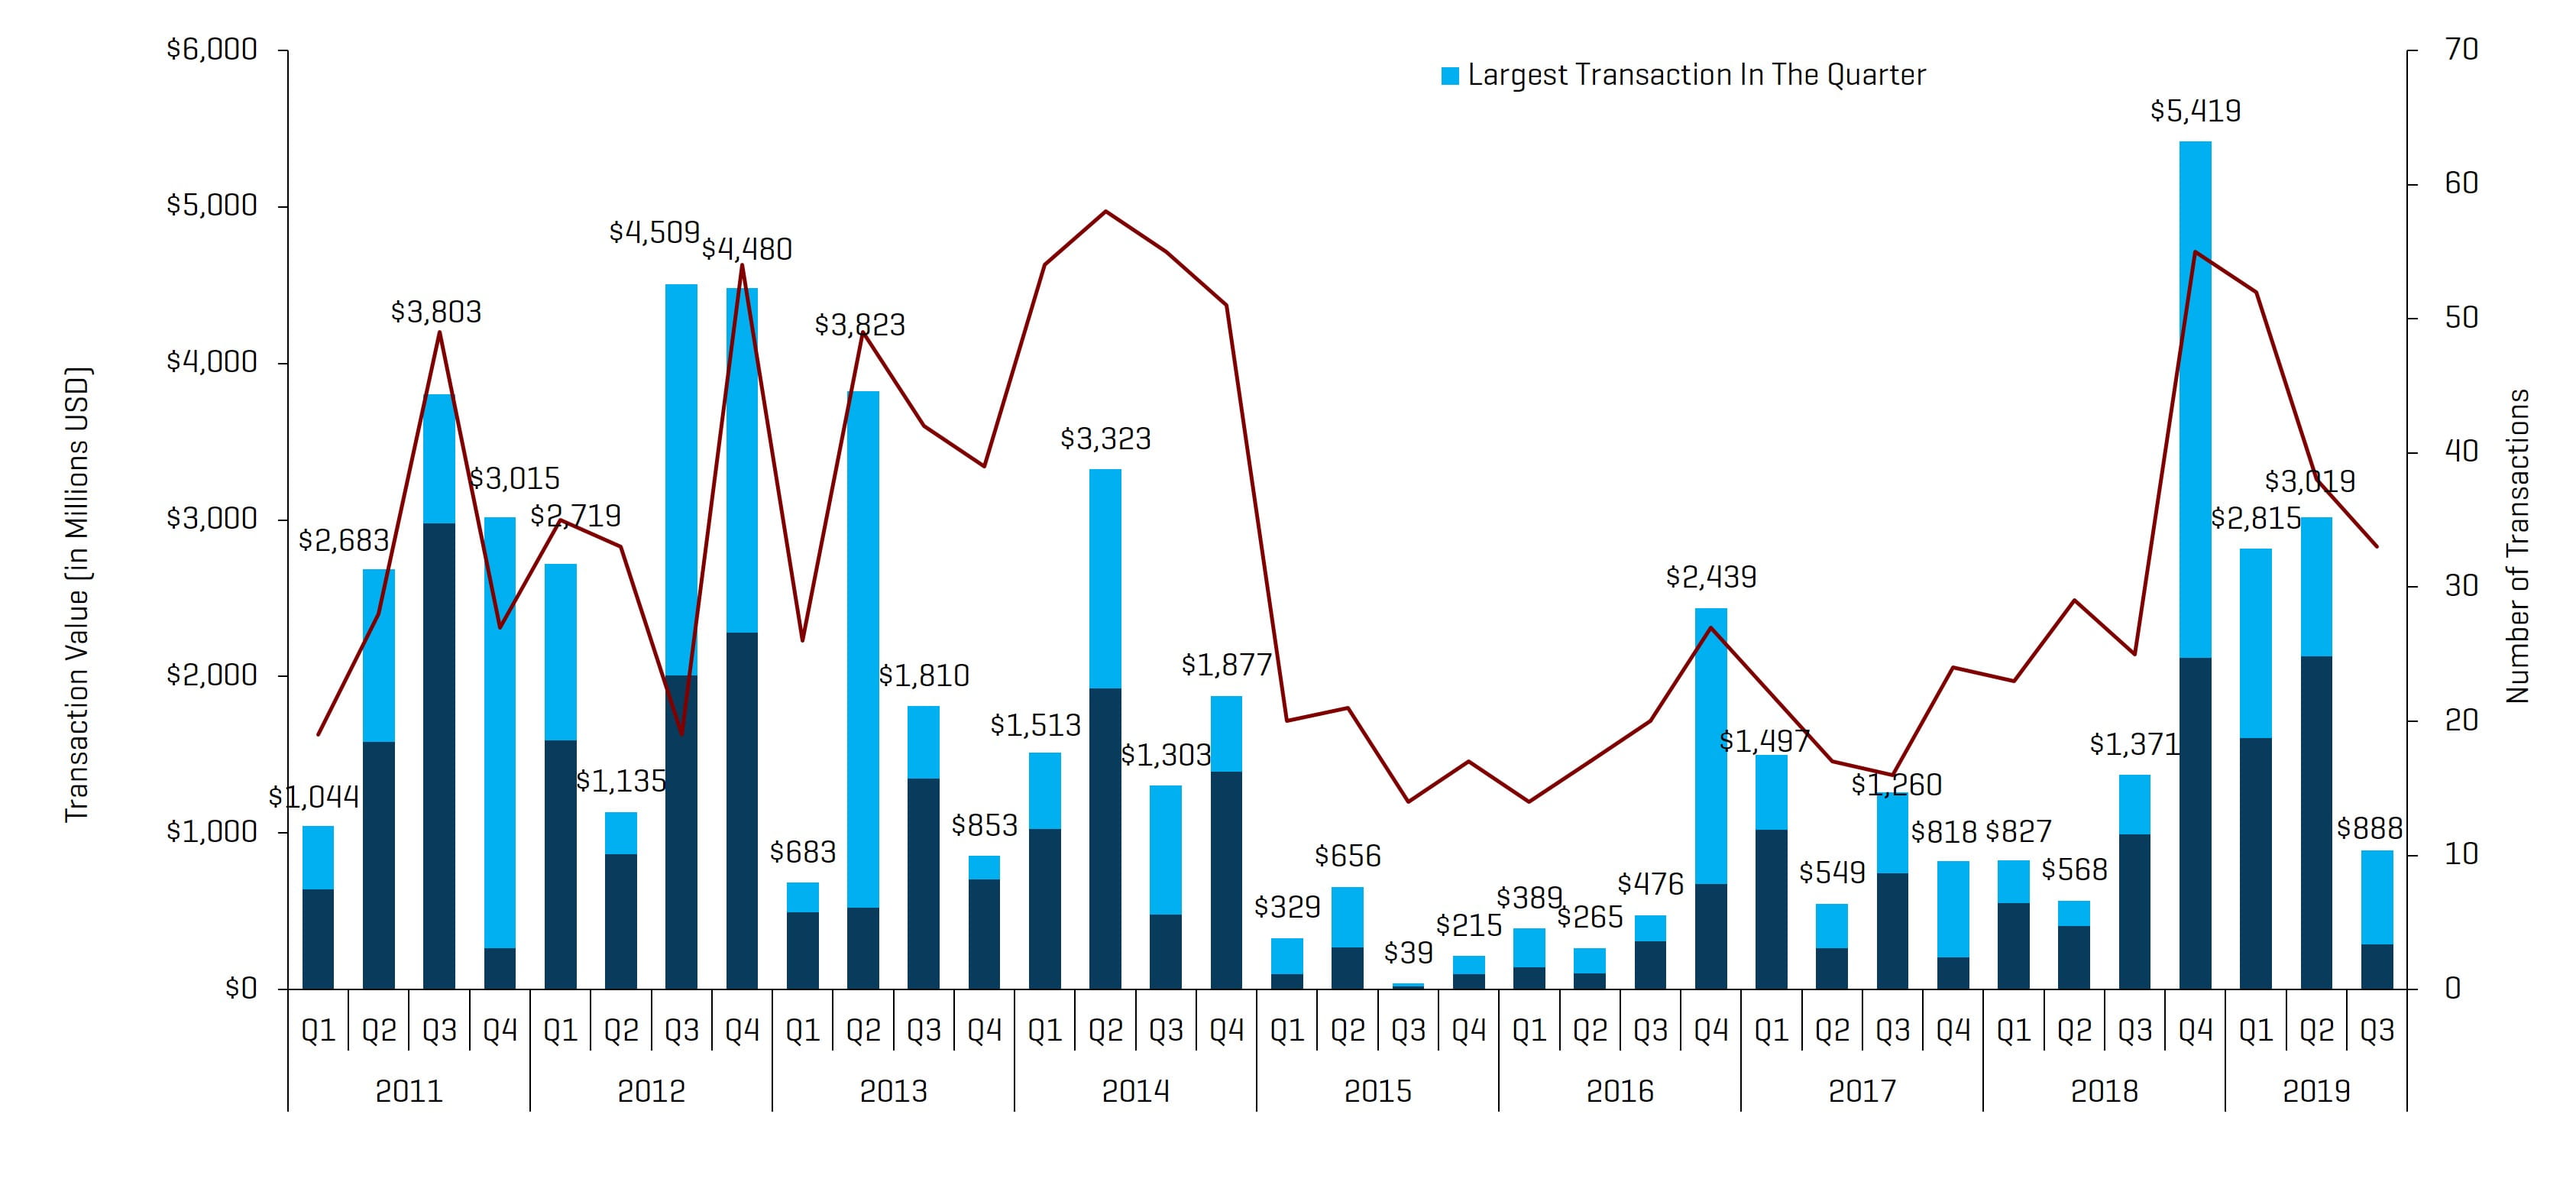
Energy service and equipment M&A activity declined by transaction count and value in the third quarter of 2019, totaling 33 transactions and $887.7 million, down from 38 transactions and $3.0 billion in the second quarter. Transaction dollar value was led by NGL Energy Partners acquisition of Hillstone Environmental Partners from Golden Gate Capital for $600 million. Excluding the largest transactions in the second and third quarters of 2019, transaction value decreased by $1.8 billion from $2.1 billion to $287.7 million.
In general, almost all deals in the energy service and equipment sector have been constrained because of industry headwinds (particularly upstream deals with undifferentiated drilling and completion-focused services and products) and limited leverage that is being placed on these businesses. Typically, only differentiated or diversified (and those with significant midstream and downstream exposure) businesses are able to secure senior debt (1.5x to 2x), but still only with select lenders. Successful sellers have largely been able to bridge the valuation gap through the use of rollover equity, earn-outs, etc.
The outlook for M&A and financing activity in the sector is likely to remain muted for the fourth quarter of 2019 due to uncertainty regarding activity levels and E&P budgets, as well as commodity price volatility and geopolitical/trade concerns.
NAM Oilfield Services and Equipment Transactions
Source: 1Derrick, S&P Capital IQ, and proprietary information
Note: Q3 2015 excluded the Schlumberger/Cameron transaction value of $14.8 billion and Q4 2016 excludes the Baker Hughes/GE transaction value of $32.0 billion for scaling
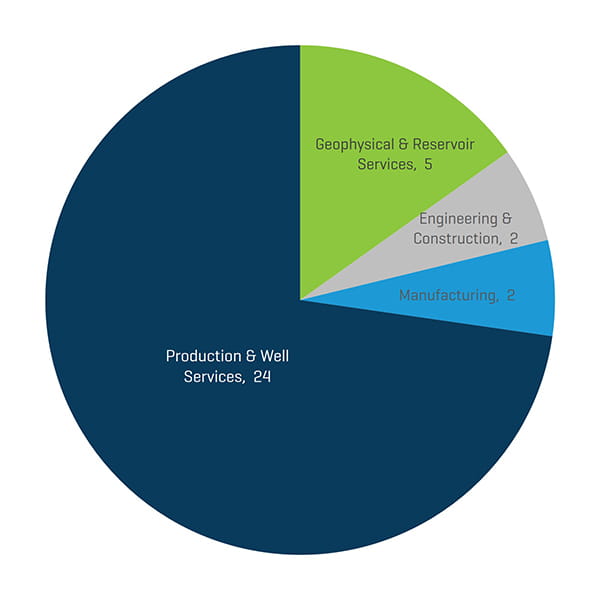
Transactions in the third quarter of 2019 were led by Production & Well Services in transaction quantity and value. The decrease in the total number of transactions quarter over quarter was driven by declines in all segments except Production & Wells Services (increasing from 21 to 24 transactions) and Geophysical & Reservoir Services (slightly increasing from four to five transactions).
Q3 2019 NAM Energy Service and Equipment Transaction Count by Sector
Source: 1Derrick, S&P Capital IQ, and proprietary information
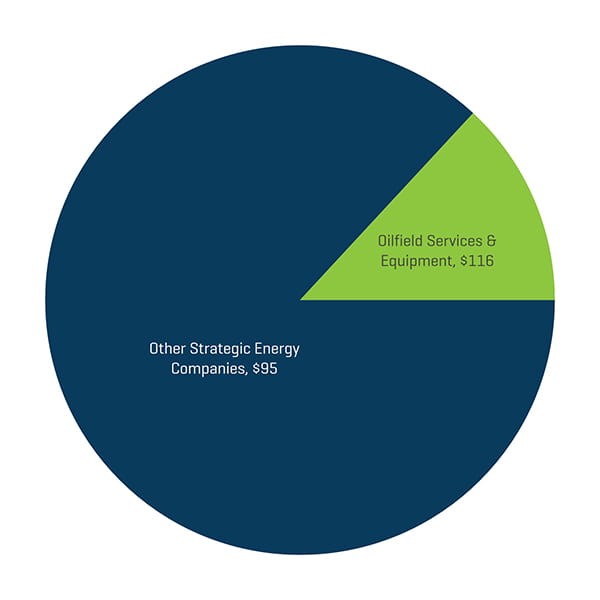
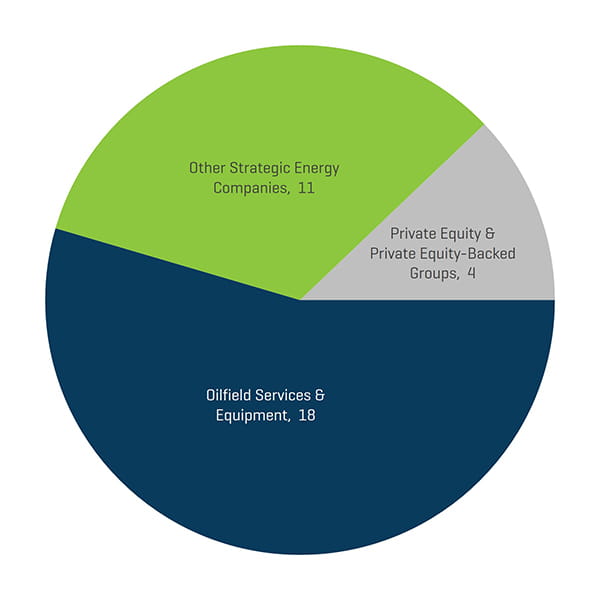
Strategic acquirers continue to be the most active acquirers of energy service & equipment businesses during the third quarter of 2019 (88% of all transactions) with PE and PE-backed groups representing 12% of total third-quarter deals, as PE buyers remain focused on energy transactions with diversified exposure across the energy value-chain (diversified away from pure upstream to downstream/industrial exposure).
Q3 2019 NAM Energy Service and Equipment Transaction Count by Buyer Profile
Source: 1Derrick, S&P Capital IQ, and proprietary information
Q3 2019 NAM Energy Services and Equipment Transaction Value by Buyer Profile [Millions USD]