English


In the midst of a broad global market downturn, the crude oil market suffered its worst annual loss (a 25% decline in WTI crude and 22% decline in Brent) since 2015, highlighted by a 38% decline in WTI in the fourth quarter of 2018 alone. The losses were driven by renewed concerns of a crude oil supply glut compounded with new worries about slackening global demand. This downturn also occurred during the 2019 capital expenditure budget decision window for many upstream companies. These companies are trying to balance near-term concerns with longer-term views on pricing and production. There appear to be firm convictions of living within cash flow. Thus, there has been some retrenchment in the form of reduced 2019 drilling plans and revised/staggered completion schedules, but the EIA anticipates both 2019 crude oil and natural gas production to exceed 2018 levels. The Permian Basin is expected to remain the key component of U.S. exploration and development activity with other areas also showing growth. Enhanced takeaway capacity via several new pipelines should help with Permian Basin differential issues by the end of 2019.
Key Takeaways:
- Crude oil prices closed the quarter materially down almost 40%, while a return to contango illustrates the modest expectation of future price increases
- Natural gas has been volatile as well, rising 49% in October and November, before giving up all its gains by the end of December
- Permian Basin remains the primary source of North American (“NAM”) E&P activity
- Financial performance, including revenue growth and margin expansion, has stalled, following a period of significant improvement in the energy service and equipment segment. Production and well services, energy equipment, and land drilling remain the leaders year over year
- Following commodity prices, public markets valuation levels declined meaningfully during the quarter (S&P declining 14%), highlighting concerns regarding production growth and potential weak global demand
- Production and well services and manufacturing transactions remain most active, while offshore services and drilling activity emerged in the quarter
Crude Oil and Natural Gas
WTI crude oil prices closed the fourth quarter materially lower, decreasing from $73.25 per barrel to $45.41. This represented the largest quarterly decline in crude prices since the fourth quarter of 2014. The quarter was highlighted by substantial volatility; there were 12 days during the quarter in which crude prices moved more than 3% compared with one day during the same quarter in 2017. In addition, the fourth quarter of 2018 witnessed a stretch of 12 consecutive days of declines, the longest period on record (since the fourth quarter of 2014). The decline has been ostensibly driven by several factors: 1) renewed concerns of crude oil oversupply, principally from U.S. shale producers, but also Saudi Arabia and Russia; 2) surprise waivers for certain Iranian crude exports (relief to certain countries from recent Iranian sanctions); and 3) lowered expectations for crude oil demand, particularly in Europe and Asia as economic growth moderates.
Natural gas experienced a volatile fourth quarter, rallying about 43% during November, before giving back all its gains in December. Pricing has been more favorable due to demand and early cold weather, but long-term supply concerns still linger (holding down future pricing expectations). The EIA expects relatively flat natural gas prices, driven by increasing demand, but anticipates continued record production.
Crude Oil (WTI) Prices and Natural Gas (Henry Hub) Prices
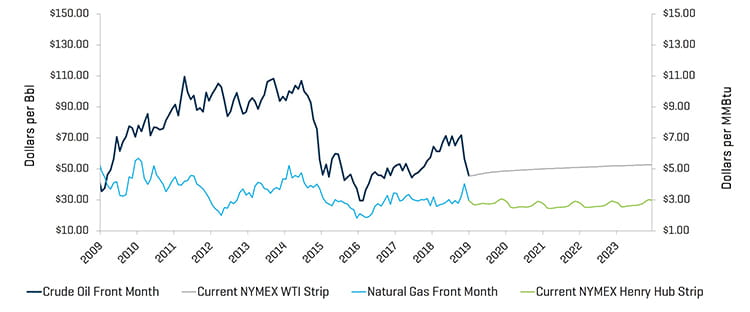
Source: Bloomberg, as of December 31, 2018
Continued efficiency and growth in North American production and a commensurate surge in U.S. crude oil output, which surpassed 11 million barrels per day in September, has not helped the oversupply narrative. The average U.S. land rig count increased by 25 rigs, from 1,034 to 1,059 rigs during the quarter, with no change in rigs added to the Permian Basin. Other basins/areas, such as the Barnett, Eagle Ford, Haynesville, and Utica, were all stagnant, while Woodford and Utica experienced modest declines in their rig counts.
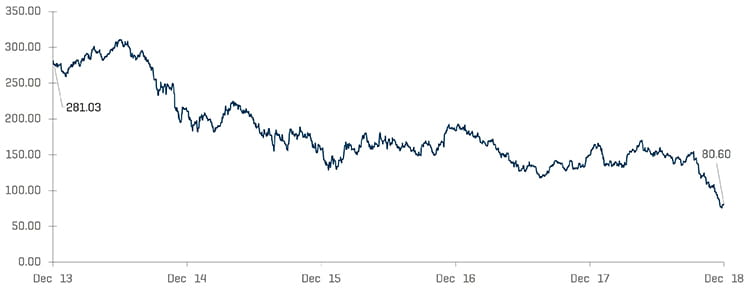
Historical U.S. Land Rig Count
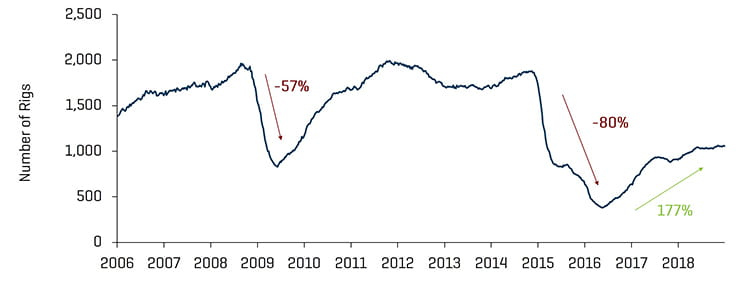
Source: Baker Hughes
Increase in U.S. Land Rig Count Since May 2016
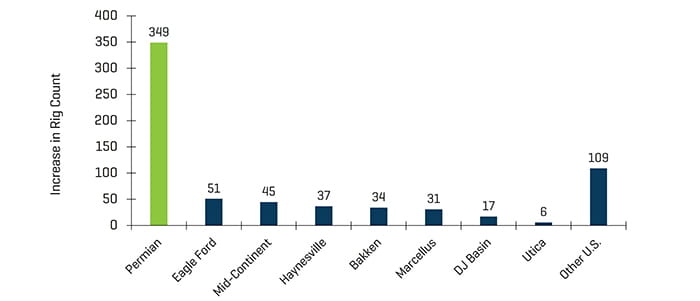
Source: Baker Hughes
Financial Results Stabilizing
The growth and margin expansion of the first two quarters of 2018 flattened out in the third quarter as competitive pressures returned to the market. Rising labor costs within a tight labor market have increased many companies’ cost basis. Land drilling margins picked up in the third quarter as drilling activity remained strong in certain basins. Fourth-quarter crude price volatility is expected to impact results late in the fourth quarter and the first several months of 2019, as new drilling and completion activity is expected to moderate. Production levels however are expected to grow in 2019, which should continue to support activity in the sector even amid a slightly lower price environment.
Production & Well Services Quarterly Revenue and EBITDA Margins
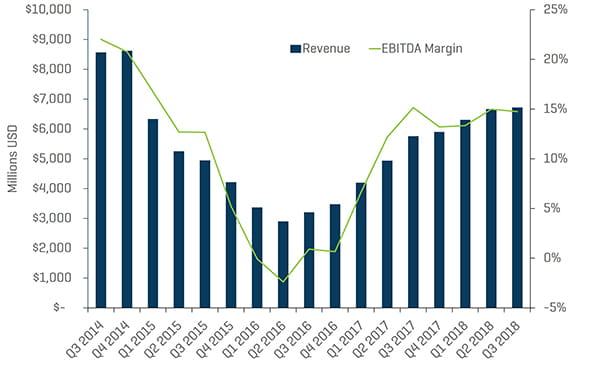
Source: S&P Capital IQ
Land Drilling Quarterly Revenue and EBITDA Margins
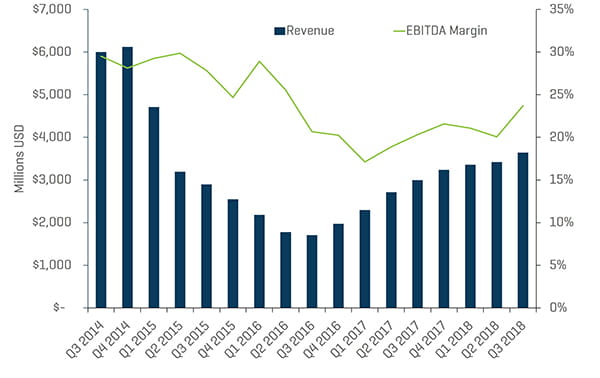
Source: S&P Capital IQ
Energy Equipment Manufacturers Quarterly Revenue and EBITDA Margins
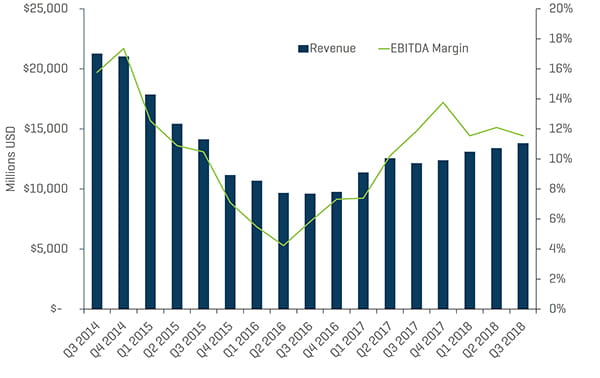
Source: S&P Capital IQ
Valuation Levels Continue to Lag Broader Market
Public valuations for energy companies declined materially during the quarter, with the Philadelphia Oil Service Sector Index (OSX) decreasing 46%, compared with a 14% decrease in the S&P 500 Index. The energy sector, as a whole, continues to underperform the broader market. Wall Street analysts expect energy stocks to continue to lag S&P performance throughout 2019, with investors remaining focused on a select group of quality stocks with operations in key basins such as the Permian.
Production and well services, and energy equipment manufacturers saw slight margin contractions in the third quarter of 2018 to 14.7% and 11.6%, respectively. Land drilling revenue rose, and EBITDA accelerated, faring better than offshore drilling, which started to see declines in revenue and EBITDA margins.
Offshore Drilling Quarterly Revenue and EBITDA Margins
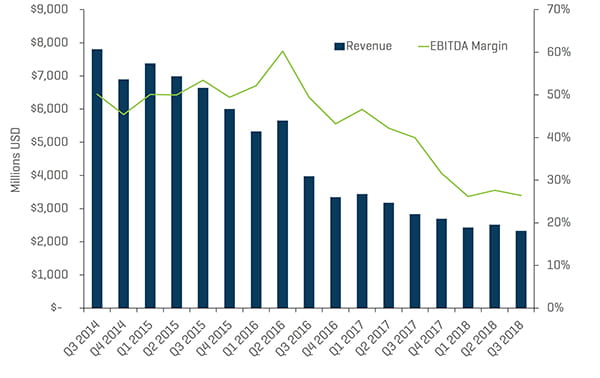
Source: S&P Capital IQ
Equity Index Performance - OSX
Source: S&P Capital IQ
Equity Index Performance
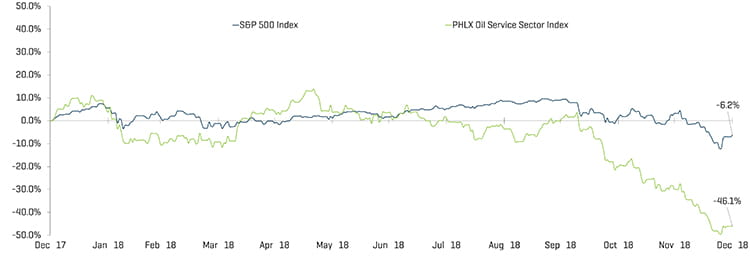
Source: S&P Capital IQ
Recent M&A Trends
M&A Activity Rose Meaningfully in the Quarter
Energy service and equipment M&A activity more than doubled in the fourth quarter, totaling 53 transactions, relative to the 25 transactions in the third quarter. As a result, the fourth quarter’s transaction value increased by $4 billion from $1.4 billion to $5.4 billion. Transaction dollar value was led by WorleyParsons acquiring the ECR business of Jacobs Engineering Group for $3.3 billion. Production and well services fell below engineering and construction in terms of deal value, due to the large WorleyParsons and Jacobs Engineering Group deal. However, production and well services remained the leader in number of transactions and experienced strong transaction value, which surpassed $1.4 billion in the quarter.
The outlook for 2019 M&A and financing activity in the sector is expected to moderate in the first half of the year as the recent volatility has caused some processes to stall or delay. The second half of the year should see increased activity if crude prices recover.
NAM Oilfield Services and Equipment Transactions
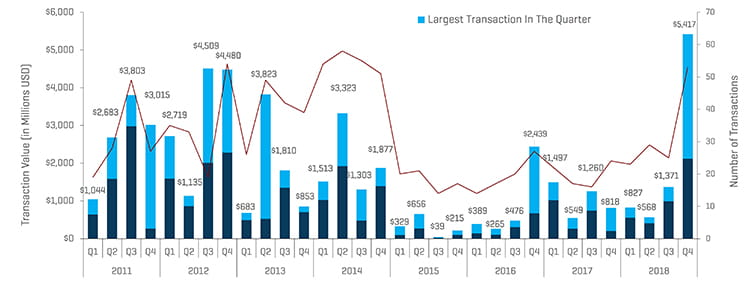
Source: 1Derrick, S&P Capital IQ, and proprietary information
Note: Q3 2015 excludes the Schlumberger/Cameron transaction value of $14.8 billion and Q4 2016 excludes the Baker Hughes/GE transaction value of $32.0 billion for scaling
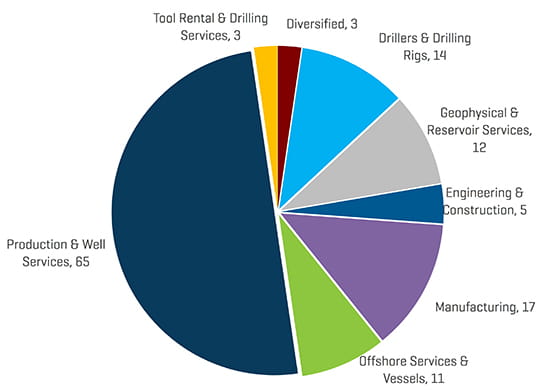
As mentioned, production and well services transactions have remained the most active OFS sector in NAM by transaction count and, with the exception of WorleyParsons acquisition of the ECR business of Jacobs Engineering Group for $3.3 billion, by transaction value.
The quarter had a relatively smooth mix of transaction across most sub-segments, further illustrating the increase in deal activity and movement on what was a steadily building backlog.
Q4 2018 NAM Energy Service and Equipment Transaction Count by Sector
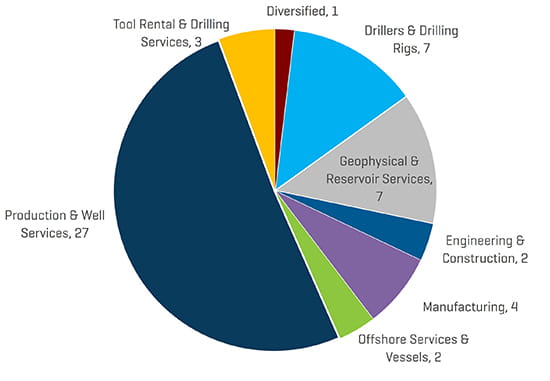
Source: 1Derrick, S&P Capital IQ, and proprietary information
Q4 2018 NAM Energy Service and Equipment Transaction Value by Sector (Millions USD)
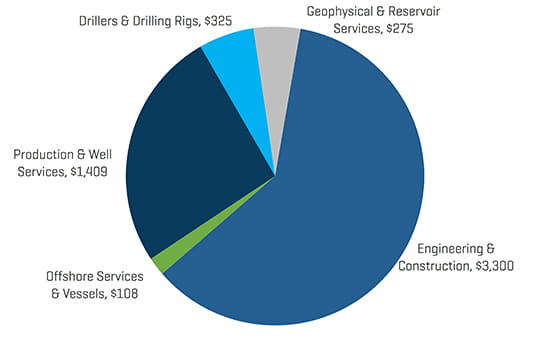
Source: 1Derrick, S&P Capital IQ, and proprietary information
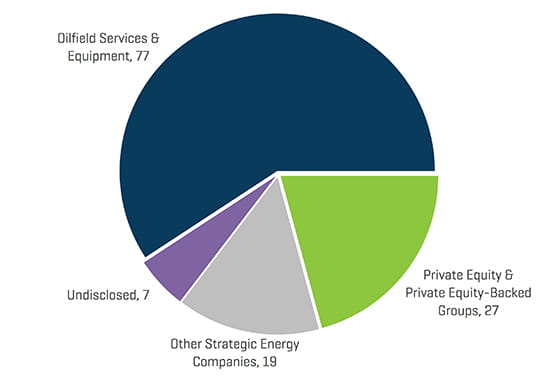
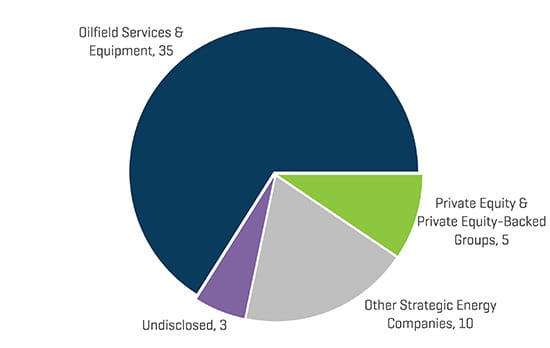
Strategic acquirers were the most active acquirers of energy service & equipment businesses during the fourth quarter (85% of all transactions) with private equity (PE) and PE-backed groups dipping to only 9% of total deals.
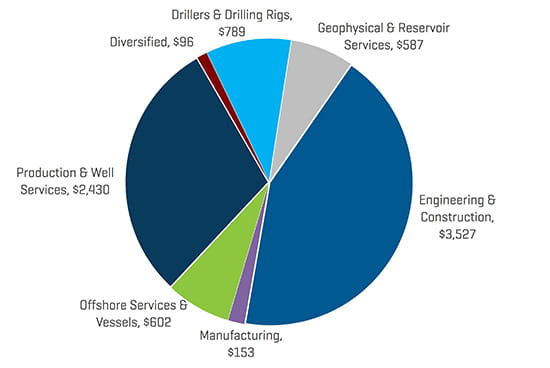
The trends in fourth-quarter transaction by subsegment and buyers was representative of the breakdown of total 2018 transactions, with production and well services leading the way, followed more distantly by Equipment Manufacturing transactions.
Q4 2018 NAM Energy Service and Equipment Transaction Count by Buyer Profile
Source: 1Derrick, S&P Capital IQ, and proprietary information
2018 NAM Energy Service and Equipment Transaction Count by Sector
Source: 1Derrick, S&P Capital IQ, and proprietary information
2018 NAM Energy Service and Equipment Transaction Value by Sector (Millions USD)
Source: 1Derrick, S&P Capital IQ, and proprietary information
2018 NAM Energy Service and Equipment Transaction Count by Buyer Profile