English


Energy markets remained relatively stable during the third quarter of 2018, holding the momentum observed in the second quarter. Crude prices maintained second-quarter gains with the global oil supply in August reaching a record 100 million barrels per day and amid future uncertainty, highlighted by continued backwardation. This has left many companies struggling to balance the pressure to increase spending and the longer-term doubts regarding the sustainability of the market. Permian Basin activity remains the key driver of U.S. exploration and development activity and has supported the continued recovery of sectors such as production and well services, energy equipment manufacturers, and contract land drilling. Certain research indicates that Permian Basin production could reach as high as 6.5 million barrels per day in five years, but that would require substantial investment estimated at more than $300 billion.
Key Q3 Takeaways:
- Crude oil prices closed the quarter flat, while backwardation illustrates future pricing concerns
- Permian Basin remains the primary source of North American (“NAM”) E&P activity
- Financial performance, including revenue growth and margin expansion, leveling out following a period of significant improvement in the energy service and equipment segment. Production & well services, energy equipment, and land drilling remain the year-over-year leaders
- Public markets valuation levels pulled back meaningfully during the quarter, possibly indicating the lingering concern regarding production growth
- Production and well services and manufacturing transactions remain most active, while offshore services and drilling activity emerged in the quarter
CRUDE OIL AND NATURAL GAS
Crude oil prices closed the third quarter near where they began, decreasing slightly from $73.94 to $73.25 per barrel. However, crude prices spent much of the quarter below these levels, dipping to $65.01 in mid-August, and only reaching a high of $74.14 just after the opening of the quarter. The decline and subsequent recovery was driven largely by sustained OPEC compliance with respect to production cuts, concern about potential conflict/sanctions in the Middle East (e.g. Iran), China and U.S. trade tensions, and natural disasters (e.g. hurricanes). Historically low storage levels moved even lower during the quarter, while global demand continued to increase.
Crude Oil (WTI) Prices and Natural Gas (Henry Hub) Prices
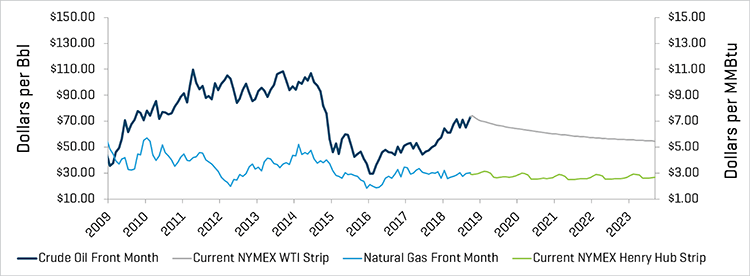
Source: Bloomberg, as of September 30, 2018
These positive developments were partially offset by continued efficiency and growth in North American production and a commensurate surge in U.S. crude oil output, which approached 11 million barrels per day in July. The average U.S. land rig count increased by only six rigs, from 1,028 to 1,034 rigs during the quarter, with two net rigs added to the Permian Basin. Other basins/areas, such as the Mid-Continent, Eagle Ford, Bakken, and Utica, all experienced modest rig count declines from the second quarter.
Historical U.S. Land Rig Count
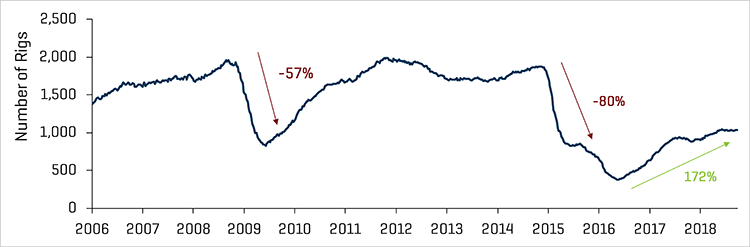
Source: Baker Hughes
Increase in U.S. Land Rig Count Since May 2016
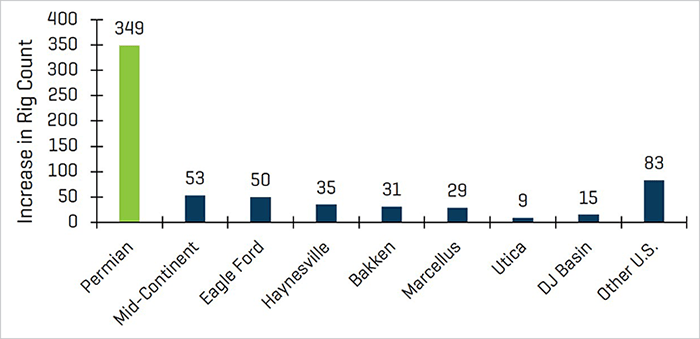
Source: Baker Hughes
Backwardation in the crude oil market continues to highlight concerns regarding longer-term crude pricing. The NAM market also continues to benefit from drilling and completion efficiencies, although the pace of efficiency is anticipated to moderate. Despite increases in pricing in certain service segments, the enhanced production continues to outweigh the incremental costs.
Continued Financial Improvement
Second-quarter 2018 financial performance leveled out following a period of improvement in the energy service and equipment segment.
In the second quarter of 2018, production & well services EBITDA margins grew to 15.0%, the highest levels achieved since the first quarter of 2015, with the exception of the third-quarter 2017 EBITDA margins. Subsectors that had been lagging, such as offshore drilling, have begun to stabilize with respect to revenue, but EBITDA margins remain challenged. Production and well services EBITDA margins grew 12.5% for the quarter while offshore drilling declined 1.8%. Meanwhile land drilling, which increased meaningfully year-over-year, remained flat from revenue and EBITDA growth in the second quarter compared with the first quarter of 2018. Finally, manufacturers recaptured margin that was lost in the first quarter, returning to 12% EBITDA margins in the second quarter.
Production & Well Services Quarterly Revenue and EBITDA Margins
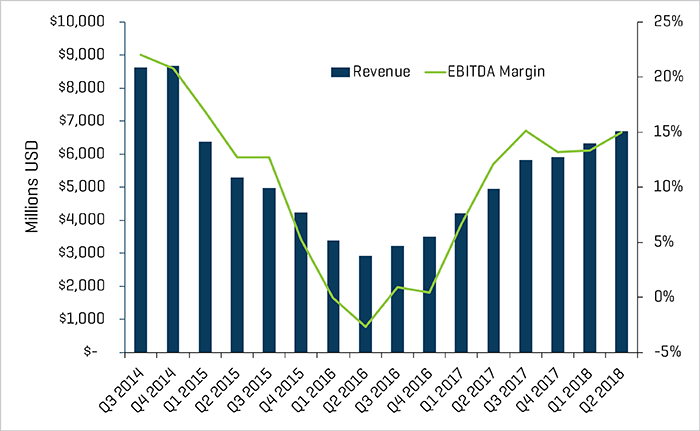
Source: S&P Capital IQ
Land Drilling Quarterly Revenue and EBITDA Margins
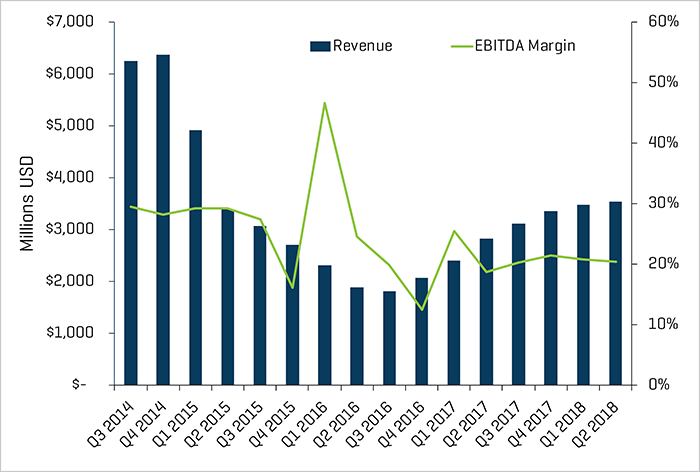
Source: S&P Capital IQ
Energy Equipment Manufacturers Quarterly Revenue and EBITDA Margins
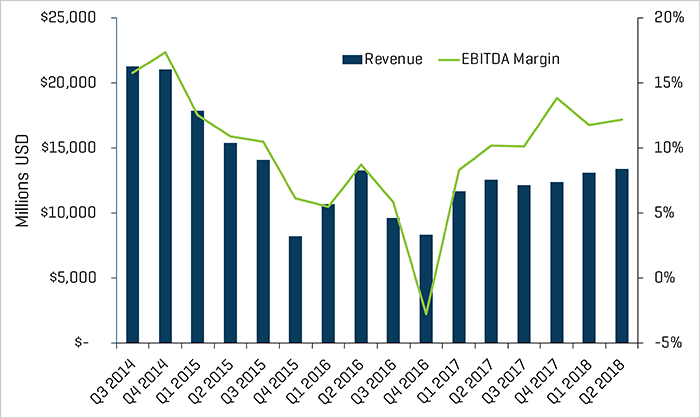
Source: S&P Capital IQ
Valuation Levels Again Lagging Broader Market
Public valuations for energy companies pulled back meaningfully during the quarter, with the Philadelphia Oil Service Sector Index (OSX) decreasing 3.5%, compared with a 7.2% increase in the S&P 500 Index. Continued significant production growth may be weighing on third-quarter energy performance, which had been softening in the second quarter. Despite these potential issues, a number of research analysts have highlighted concerns about crude oil supply in future years due to persistent underinvestment during the downturn.
Production and well services, and energy equipment manufacturers continued to see margin expansion in the second quarter of 2018 to 15.0% and 12.2% respectively. Land drilling revenue rose, but EBITDA margins remained flat, which fared better than offshore drilling, which had its first minor increase in revenue since early 2017. However, offshore drilling is still experiencing EBITDA margin contraction (decreasing to 25.4% in the quarter).
Offshore Drilling Quarterly Revenue and EBITDA Margins
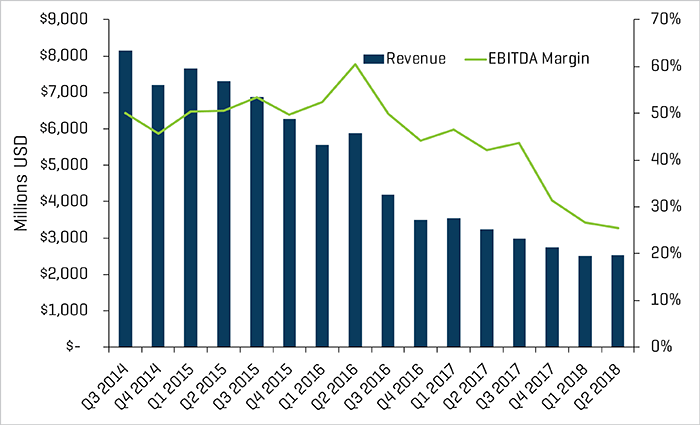
Source: S&P Capital IQ
Equity Index Performance - OSX
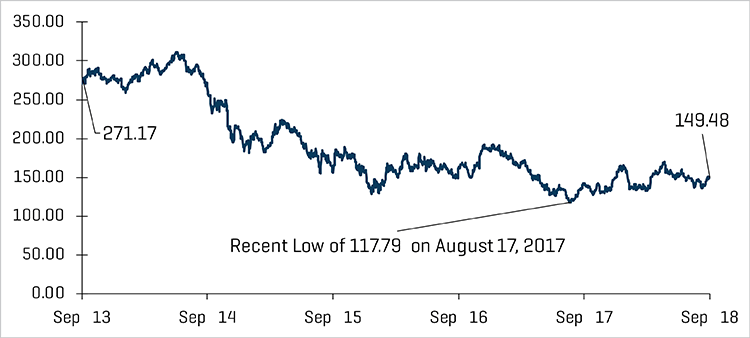
Source: S&P Capital IQ
Equity Index Performance
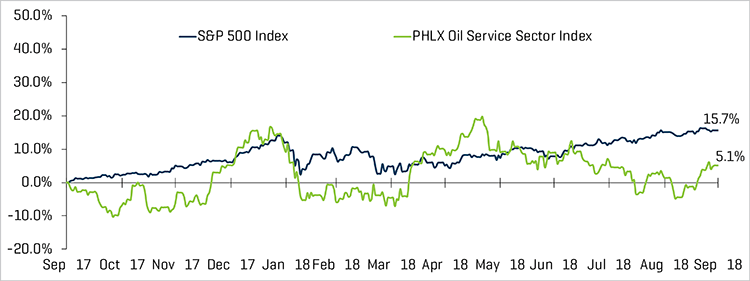
Source: S&P Capital IQ
RECENT M&A TRENDS
M&A Activity Has Stabilized
Energy service and equipment M&A activity slowed by count in the third quarter of 2018, totaling 25 transactions, relative to the 29 transactions in the second quarter. However, the third quarter remained consistent with prior-quarter levels and well above the lows observed from 2015 through mid-2017. Meanwhile, dollar volumes grew meaningfully in the third quarter compared with second-quarter levels, reaching $1.4 billion, and were slightly higher than third-quarter 2017 levels of $1.3 billion. Transaction dollar value was led by Tidewater’s acquisition of GulfMark for $340 million, which reflected a meaningful offshore services and vessels transaction that had been struggling to see activity. Excluding the Tidewater/GulfMark transaction, production and well services remained the leader in both number of transactions as well as total deal value, which reached $341 million in the quarter.
The outlook for remaining 2018 M&A and financing activity in the sector is positive as crude price gains hold, and a number of private company owners continue to assess exits.
NAM Oilfield Services and Equipment Transactions
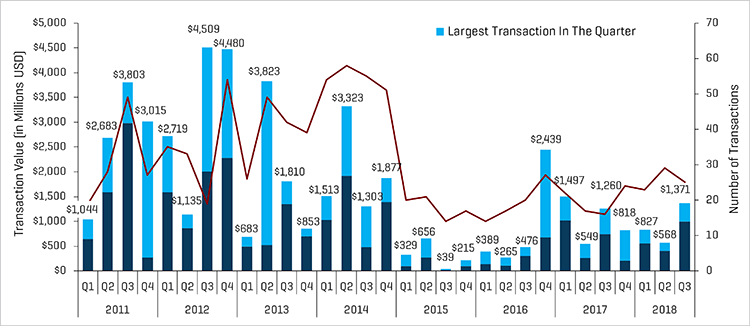
Source: 1Derrick, S&P Capital IQ, and proprietary information
Note: Q3 2015 excludes the Schlumberger/Cameron transaction value of $14.8 billion and Q4 2016 excludes the Baker Hughes/GE transaction value of $32.0 billion for scaling.
As mentioned, production and well services transactions have remained the most active OFS sector in NAM by transaction count and transaction value (excluding the Tidewater acquisition of GulfMark, which accounted for $340 million of the total offshore services dollar value of $379 million).
Energy equipment manufacturing also remains very active by number of transactions. After a sustained period of limited activity, offshore services transaction activity resurfaced with three transactions in the quarter, while drilling activity slowed slightly from the second quarter, down to two transactions in the third quarter of 2018.
Q3 2018 NAM Energy Service and Equipment Transaction Count by Sector
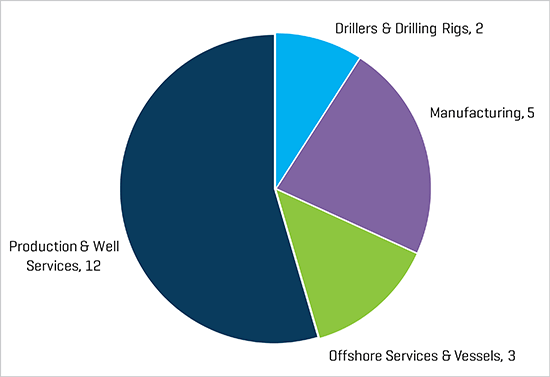
Source: 1Derrick, S&P Capital IQ, and proprietary information
Q3 2018 NAM Energy Service and Equipment Transaction Value by Sector (Millions USD)
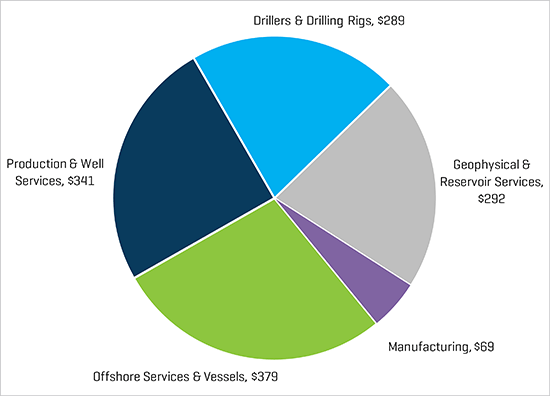
Source: 1Derrick, S&P Capital IQ, and proprietary information
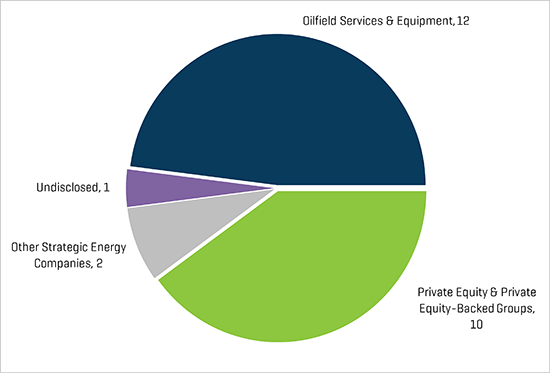
Strategic acquirers were the most active acquirers of energy service & equipment businesses during the third quarter of 2018 (56% of all transactions) with private equity (PE) and PE-backed groups, the second most active buyer segment (40% of total deals).
Q3 2018 NAM Energy Service and Equipment Transaction Count by Buyer Profile