English


While nearly every asset class experienced meaningful declines during the fourth quarter of 2018, that trend was reversed in the first quarter of 2019 as most asset classes recovered materially. In particular, the crude oil market witnessed one of its best quarters in nearly a decade, highlighted by a 32.4% increase in WTI crude prices (27.1% increase in Brent crude prices). The gains were driven by tighter crude supplies and relatively positive signs for the global economy (particularly in the United States and China). OPEC aided the crude oil markets with production cuts that have pushed the group’s supply to a four-year low with Saudi Arabia (planned) and Venezuela and Libya (unplanned) key components of the supply decline. In addition, many U.S. producers continue to reference living within cash flow, which should act as a moderate choke on local production. While a number of analysts anticipate reduced U.S. drilling and completion spending in 2019 due to the aforementioned fiscal restraint, the U.S. Energy Information Administration (EIA) anticipates both 2019 crude oil and natural gas production to exceed 2018 levels due to greater efficiency and improved takeaway capacity. West Texas (Permian Basin) and the Northeast (Marcellus and Utica Basins) are expected to lead crude oil and natural gas production, respectively.
Key Q1 Takeaways:
- Crude oil prices closed the quarter materially up more than 32%
- Natural gas has been volatile, as well, ending 9.5% down for the quarter
- Permian Basin remains the primary source of North American (“NAM”) exploration and production (E&P) activity
- Financial performance, including revenue growth and margin expansion, stalled in the fourth quarter of 2018. Performance expectations have softened for the first quarter of 2019 but remain positive for the remainder of 2019 as commodity prices recover and equity markets respond accordingly. Production and well services, energy equipment, and land drilling remain the leaders year over year, while offshore activity remains depressed
- Public market valuation levels also increased meaningfully during the quarter (with the S&P 500 increasing 13%)
- Production and well services and manufacturing transactions remain most active, while geophysical and reservoir services activity emerged in the quarter
Crude Oil and Natural Gas
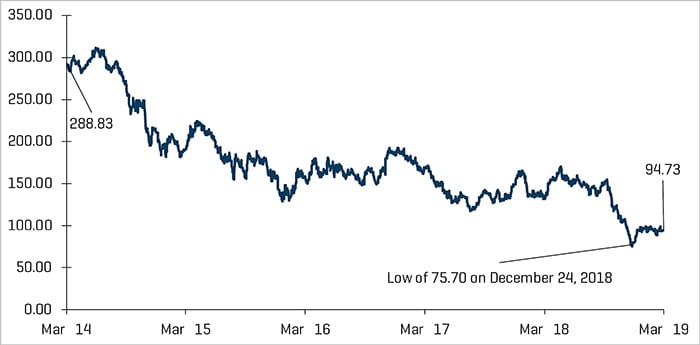
WTI crude oil prices closed the first quarter materially higher, increasing from $45.41 per barrel to $60.14. This represented the largest quarterly increase in crude prices since the second quarter of 2009. WTI crude prices also increased 40 days (out of 61 trading days) during the quarter, highlighting the consistent, positive momentum. The increase has been driven by a couple of factors: 1) tighter crude oil supplies due to outsized OPEC production cuts (particularly from Saudi Arabia and Venezuela); and 2) stronger-than-expected global growth (recent manufacturing data from China and the United States have been positive) which has bolstered crude oil demand expectations.
Following suit with the fourth quarter of 2018, natural gas experienced continued volatility in the first quarter; there were 13 days during the quarter in which natural gas prices moved more than 3%. Natural gas prices increased at the end of the quarter due to colder-than-expected temperatures; however the EIA expects relatively stable prices throughout 2019 as the impact of increasing demand driven by industrial, petrochemical, and liquified natural gas end users is anticipated to be moderated by continued record production.
Crude Oil (WTI) Prices and Natural Gas (Henry Hub) Prices
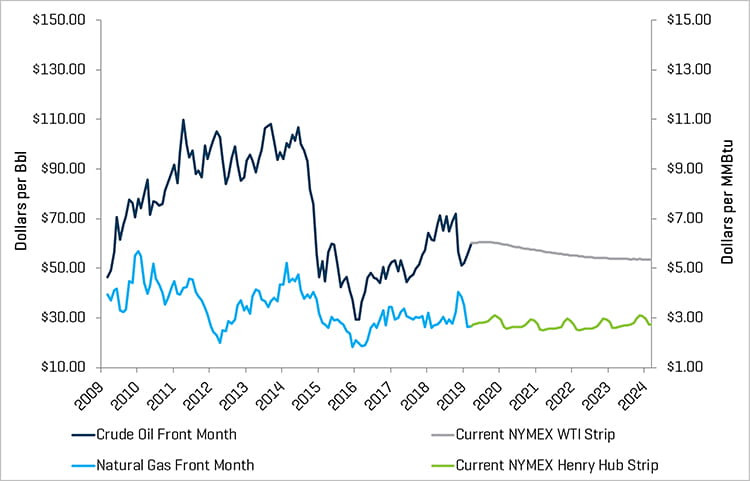
Source: Bloomberg, as of March 31, 2019
The North American market continues to witness drilling and completion efficiency and growth in production. U.S. crude oil output surpassed 11 million barrels per day in August 2018 and has maintained more than 11 million barrels per day since that time. However, a number of producers are focused on living within cash flows and have tempered drilling and completion plans for 2019. The average U.S. land rig count decreased by 77 rigs, from 1,083 to 1,006 rigs during the quarter. Most regions experienced declines in their rig counts, with the exception of Haynesville, Bakken, and Marcellus.
Historical U.S. Land Rig Count
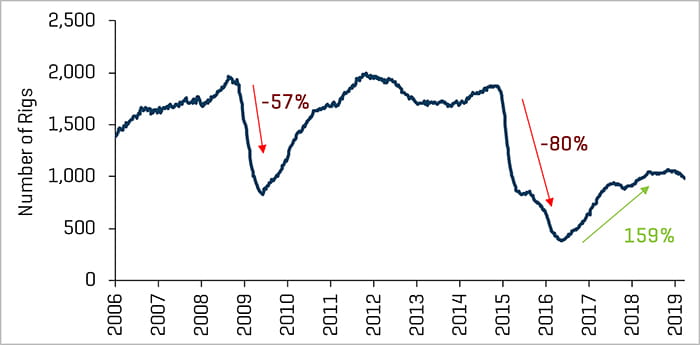
Source: Baker Hughes
Increase in U.S. Land Rig Count Since May 2016
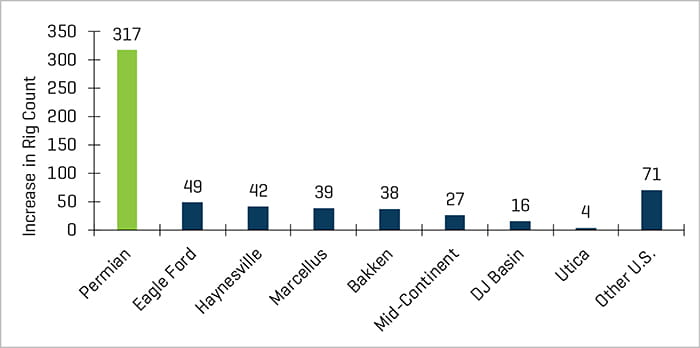
Source: Baker Hughes
Q4 Financial Results Modestly Declined
Revenue and EBITDA margins declined in the fourth quarter of 2018 as the overall market declined (the S&P 500 falling approximately 14%) as did commodity prices. Rising costs due to a tightening labor market have increased many companies’ operating costs. Land drilling margins stabilized following the third quarter’s meaningful margin improvement. Fourth-quarter crude price volatility impacted results late in the quarter as oil prices experienced a significant decline, closing the quarter at $45.41. Crude prices bounced back in the first quarter of 2019, but performance is expected to remain moderated until later in the year due to the uncertainty in the market during the early-year capital budgeting season. Production levels in the U.S., and specifically from the Permian basin, are expected to grow in 2019, which should continue to support activity in the sector even if prices remain range-bound.
Production & Well Services Quarterly Revenue and EBITDA Margins
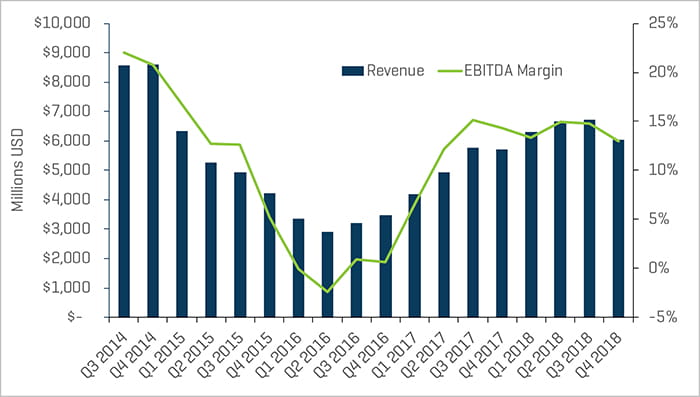
Source: S&P Capital IQ
Land Drilling Quarterly Revenue and EBITDA Margins
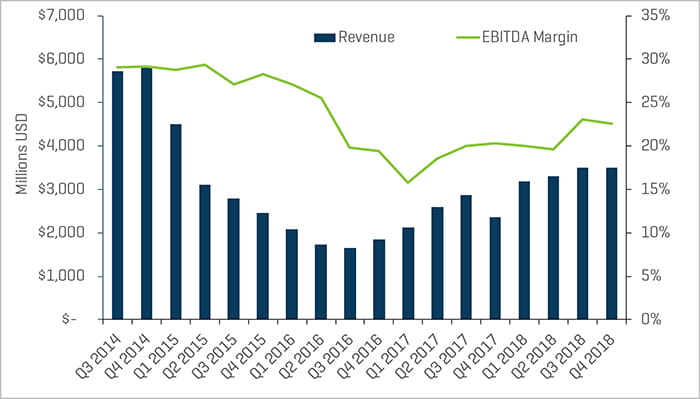
Source: S&P Capital IQ
Energy Equipment Manufacturers Quarterly Revenue and EBITDA Margins
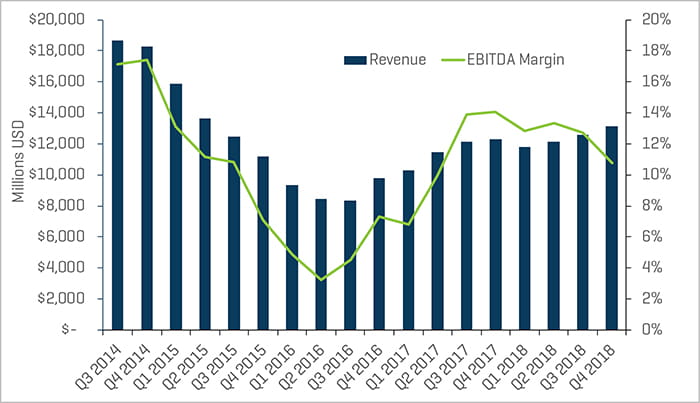
Source: S&P Capital IQ
Valuation Levels Continue to Lag Broader Market
Public valuations for energy companies increased during the quarter (Philadelphia Oil Service Sector Index (OSX) increased 17.5%), but year-over-year valuations continue to lag the overall market. Between March 31, 2018, and March 31, 2019, the OSX declined 30.2% compared with the S&P 500, which was up 7.3%. The energy sector, as a whole, continues to underperform the broader market. Wall Street analysts expect energy stocks to continue to lag S&P performance throughout 2019, with investors remaining focused on a select group of quality stocks with operations in key basins such as the Permian.
Production and well services, and energy equipment manufacturers experienced margin contraction in the fourth quarter of 2018 dipping to 12.9% and 10.7% respectively. Land drilling revenue remained flat. EBITDA slightly contracted, faring better than offshore drilling, which continues to lack meaningful signs of recovery, as revenue declined, and the EBITDA margin once again contracted.
Offshore Drilling Quarterly Revenue and EBITDA Margins
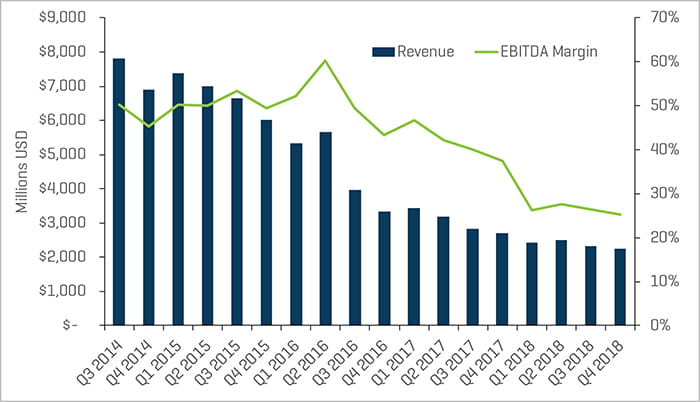
Source: S&P Capital IQ
Equity Index Performance - OSX
Source: S&P Capital IQ
Equity Index Performance
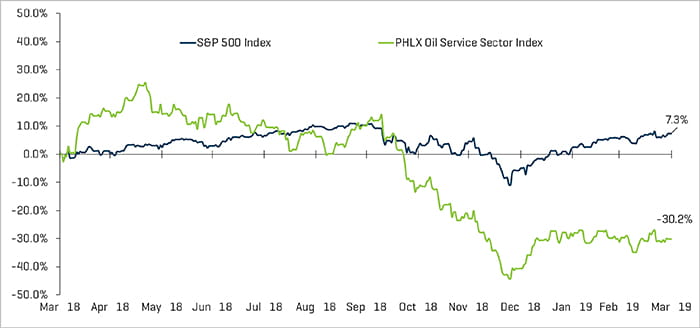
Source: S&P Capital IQ
Recent M&A Trends
M&A Activity Weakened Likely Due to Volatility at Year-End 2018
Energy service and equipment M&A activity declined slightly by transaction count in the first quarter of 2019, totaling 52 transactions, three less than 55 transactions in the fourth quarter of 2018, but transaction value decreased from $5.4 billion in the fourth quarter to $2.8 billion in the first quarter. Transaction dollar value was led by Tenaris acquiring IPSCO Tubulars from PAO TMK for $1.2 billion, which was significantly less than the $3.3 billion Worley Parsons acquisition of Jacobs Engineering Group in the fourth quarter 2018. Excluding the two largest transactions in both quarters, transaction value decreased by $507 million from $2.1 billion to $1.6 million.
The outlook for 2019 M&A and financing activity in the sector is likely to remain somewhat subdued during the first half of the year due to the recent volatility. The second half of the year should see increased M&A activity as crude prices and business accelerates in several basins.
NAM Oilfield Services And Equipment Transactions
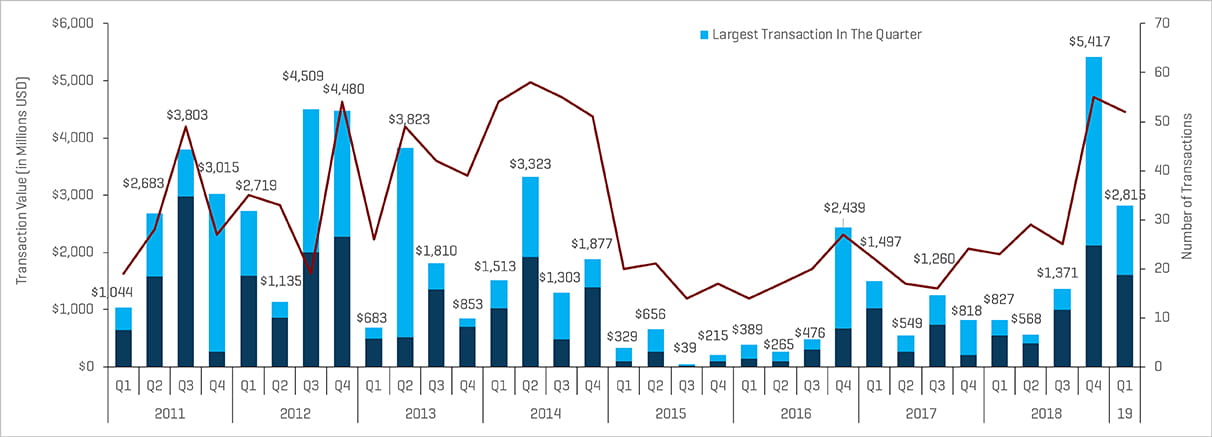
Source: 1Derrick, S&P Capital IQ, and proprietary information
Note: Q3 2015 excludes the Schlumberger/Cameron transaction value of $14.8 billion and Q4 2016 excludes the Baker Hughes/GE transaction value of $32.0 billion for scaling
As mentioned, production and well services transactions have remained the most active oilfield equipment and services sector in NAM by transaction count and transaction value.
The quarter saw a lopsided number of transactions, which were focused in the production and well services sector, further illustrating the concerns around oil price volatility. Geophysical and reservoir services transaction volume emerged, likely driven by the increased sophistication of proprietary technologies, which are high-value M&A targets.
Q1 2019 NAM Energy Service and Equipment Transaction Count by Sector
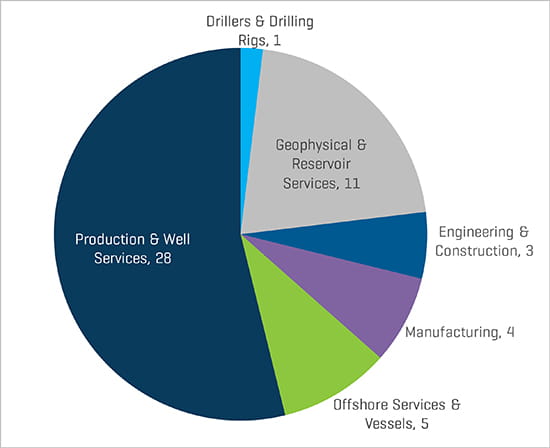
Source: 1Derrick, S&P Capital IQ, and proprietary information
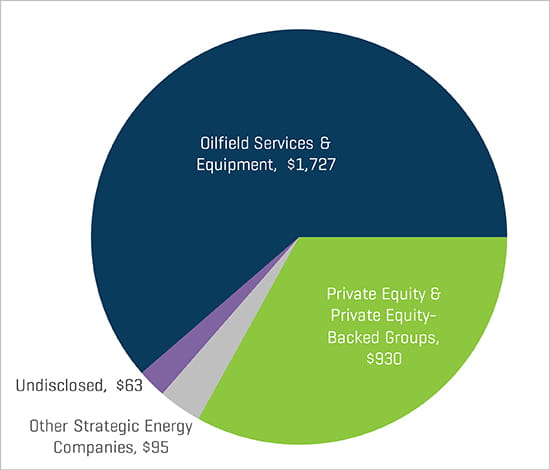
Q1 2019 NAM Energy Service And Equipment Transaction Value By Sector (Millions USD)
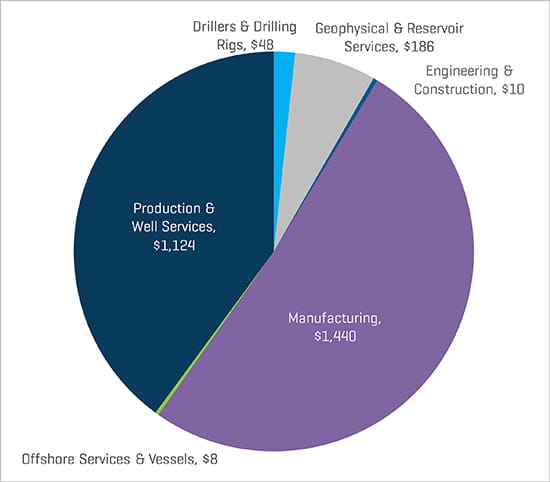
Source: 1Derrick, S&P Capital IQ, and proprietary information
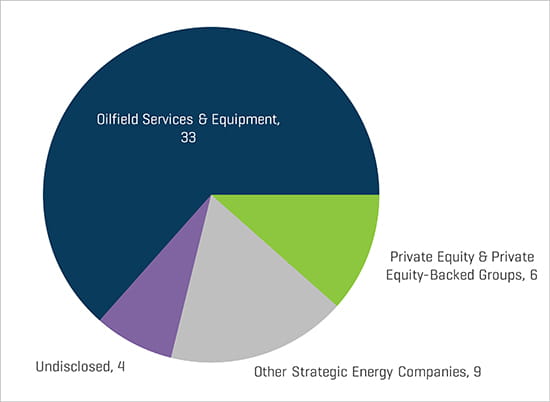
Strategic acquirers were the most active acquirers of energy service and equipment businesses during the first quarter of 2019 (63% of all transactions) with private equity and private equity-backed groups representing 12% of total first-quarter deals.
The trends in first-quarter transactions by sub-segment and buyers was representative of the breakdown of total first quarter 2019 transactions, with production and well services leading the way, followed more distantly by geophysical and reservoir services.
Q1 2019 NAM Energy Service And Equipment Transaction Count By Buyer Profile
Source: 1Derrick, S&P Capital IQ, and proprietary information
Q1 2019 NAM Energy Service And Equipment Transaction Value By Buyer Profile (Millions USD)