English


The year’s final quarter witnessed material improvement for many energy sector benchmarks. U.S. crude oil prices climbed to $48.52 per barrel by December 31, a 21% gain from the end of the third quarter in 2020. WTI prices ranged largely in the high $30s to low $40s until a noticeable jump began in mid-November. Overall, the year displayed breathtaking volatility, with crude oil prices beginning in the low $60s, plummeting during the early days of the pandemic including a drop into negative territory in April, before rapidly climbing through the second half of the year. The drilling rig count grew steadily during the fourth quarter, continuing a positive trend that began in mid-August 2020. The rig count increased 35% or by 90 rigs during the quarter (Baker Hughes), which represented the best quarterly rig count growth since the first half of 2017. Completion activity also rebounded with the number of active frac spreads moving from approximately 120-125 spreads in the third quarter to approximately 135-140 spreads in December 2020. While the percentage increase is not striking, the growth is notable given the usual slowdowns during the holiday periods in November and December. Natural gas was arguably the weakest energy benchmark, closing the quarter at a similar level ($2.53 in Q3 compared $2.54 in Q4). While natural gas prices witnessed material gains in October (32.7%), there were substantial declines in November (14%) and December (12%).
According to the U.S. Energy Information Administration (“EIA”) U.S. crude oil production declined from more than 12.8 million barrels per day in January 2020 to 11.2 million barrels per day in November 2020 (the most recent data available). The EIA anticipates U.S. crude production to modestly decrease in Q1 2021 due to Lower 48 production declines. However, improving demand for hydrocarbon products (as COVID-19 vaccines are distributed and restrictions eventually relax) is expected to bolster the global energy industry. The Biden administration has already signed several executive orders including rejoining the Paris Climate Accord, pausing offshore and Federal land leasing and permitting activity as well as ramping up regulatory scrutiny (e.g., Keystone XL permit revocation). These have been largely in-line with the agenda highlighted during his campaign. See table below regarding the Biden Administration energy agenda.
Bankruptcies continued to accumulate during the quarter as firms exhausted liquidity. While improving oil prices have increased cash flow, many firms have debt levels that are not sustainable (particularly in the face of looming maturities). Recent M&A activity within the energy service and equipment segment has been largely focused on production and well services.
Key Q4 Takeaways:
- WTI prices rose steadily during the fourth quarter, closing up 21%
- Henry Hub prices opened and closed the volatile quarter around the same level
- North American (“NAM”) energy transaction activity remained at lower levels as companies remain inwardly-focused
- The number of fourth quarter bankruptcies increased by 24
- Public market energy company valuations have generally trended higher through Q4 2020, tracking improved crude oil prices and receiving a boost from COVID-19 vaccine news
- The Biden Administration is expected to make significant policy changes over its tenure – the scope and its potential impact will be a key focus in 2021
Crude Oil and Natural Gas Prices Diverge During Quarter
WTI crude front month oil prices closed the fourth quarter 21% higher than the third quarter, increasing from $40.22 per barrel to $48.52. Research analysts have forecasted median prices of $44.00 and $45.50 for the first and second quarters of 2021, respectively. U.S. crude production is expected to remain between 11.02 and 10.33 million barrels per day through 2021.
Natural gas prices saw continued daily price volatility during the fourth quarter; there were 28 days during the quarter in which natural gas prices moved more than 3%. The net result over the quarter was near zero as most of October’s material gains were reversed in November and December.
Crude Oil (WTI) Prices and Natural Gas (Henry Hub) Prices
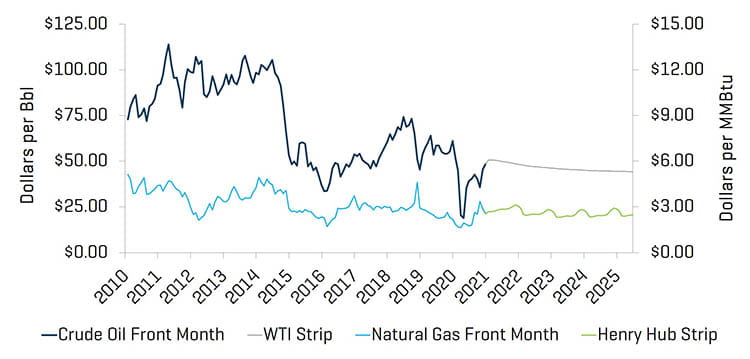
Source: Bloomberg, as of December 31, 2020
Research Analyst Crude Oil (WTI) Prices Estimates
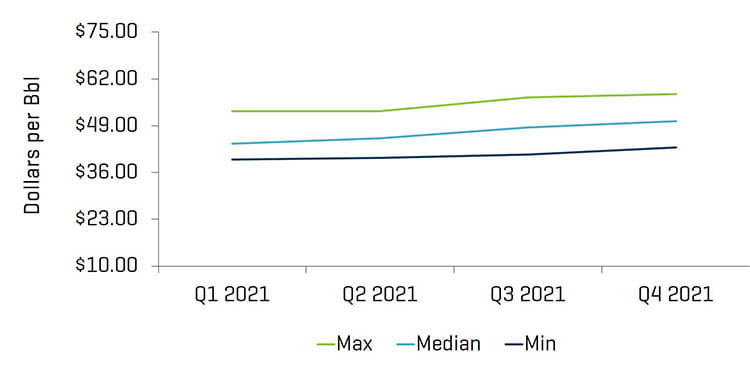
Source: Bloomberg, as of December 31, 2020
Total U.S. rig count (including offshore rigs) increased by 90 rigs, from 261 at the end of the third quarter to 351 rigs by the end of the fourth quarter. Most regions saw increases in rig counts, most notably the Permian (increasing from 125 to 175), Eagle Ford (increasing from 12 to 26), and Haynesville (increasing from 36 to 43).
Historical U.S. Land Rig Count
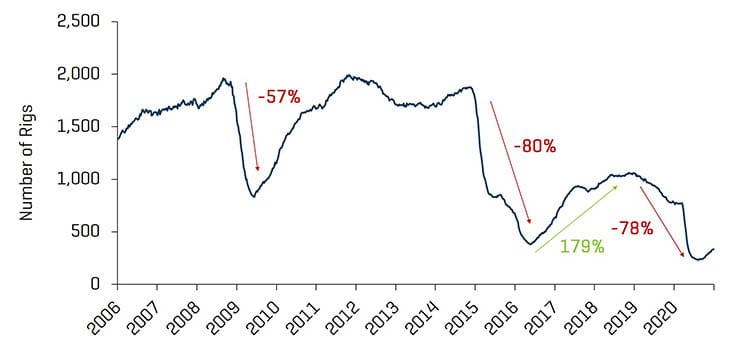
Source: Baker Hughes
Decrease in U.S. Rig Count Since Peak in 2018
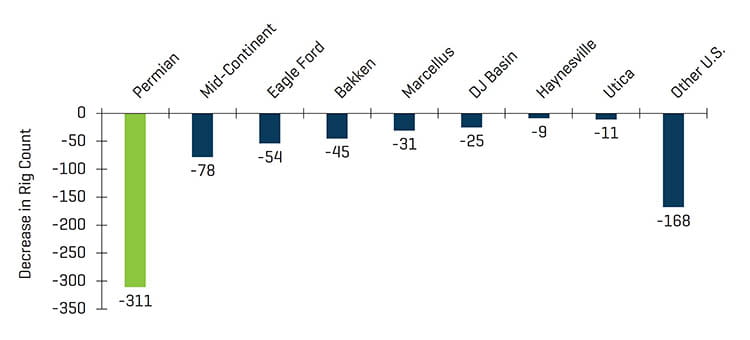
Source: Baker Hughes
U.S. Rig Count and Crude Oil (WTI) Prices
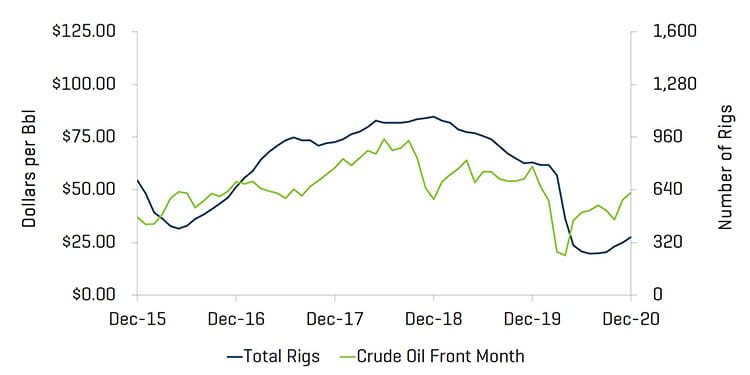
Source: Bloomberg, as of December 31, 2020 and Baker Hughes
Valuation Levels Improve as Vaccines and Forecast Clarity Offer Hope
Overall, public valuations for energy service companies increased during the quarter, increasing 59.3%. Year-over-year performance for energy service companies was down 43.4% as the sector continues to trail the overall U.S. market (up 11.7% during the quarter and 16.3% year-over-year), as the impact of COVID-19 on global energy demand remains the key driver of suppressed investor sentiment.
Equity Index Performance - OSX
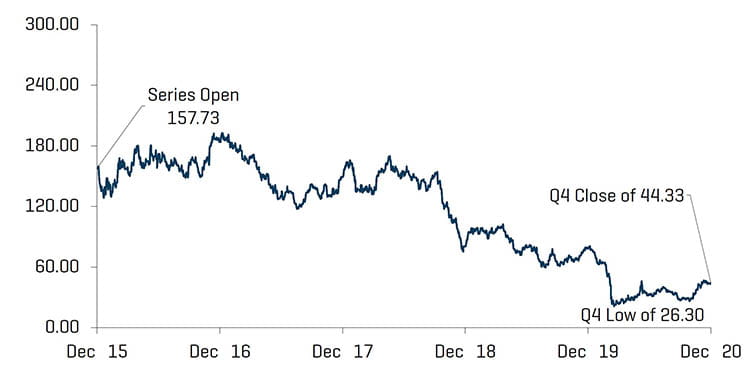
Source: S&P CapitalIQ, Inc.
Equity Index Performance
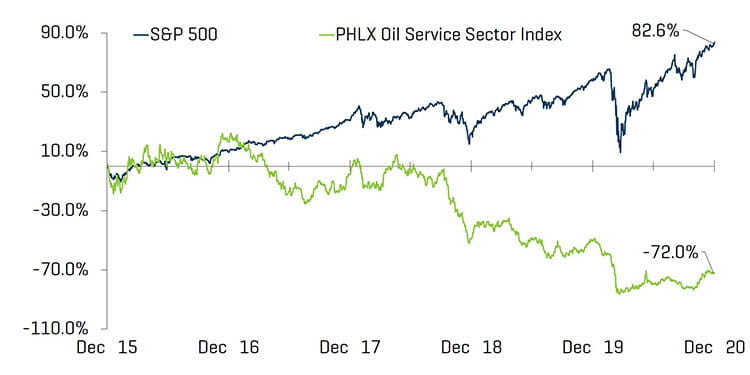
Source: S&P CapitalIQ, Inc.
The fourth quarter saw another increase in the number of bankruptcies within the energy industry. Despite easing quarantine restrictions, many industry participants feel continued distress from suppressed demand. Oilfield service companies represented the majority of filings during the quarter.
North American Producer, Midstream, & OFS Bankruptcies
Source: Haynes and Boone, LLP
Q4 2020 Energy Company Bankruptcies by Function
Source: Haynes and Boone, LLP
RECENT M&A TRENDS
M&A Activity Witnessed Modest Improvement Though Still Weak
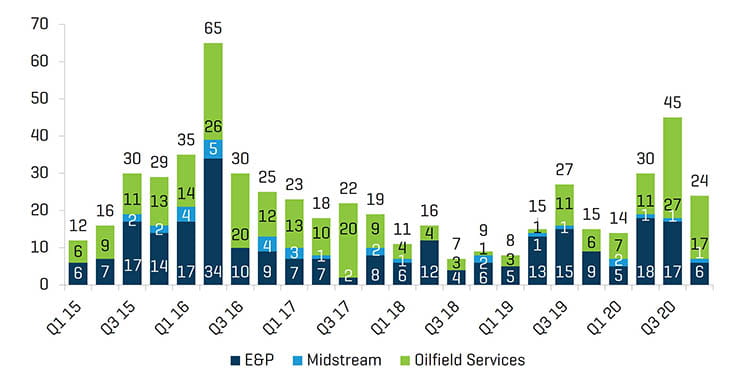
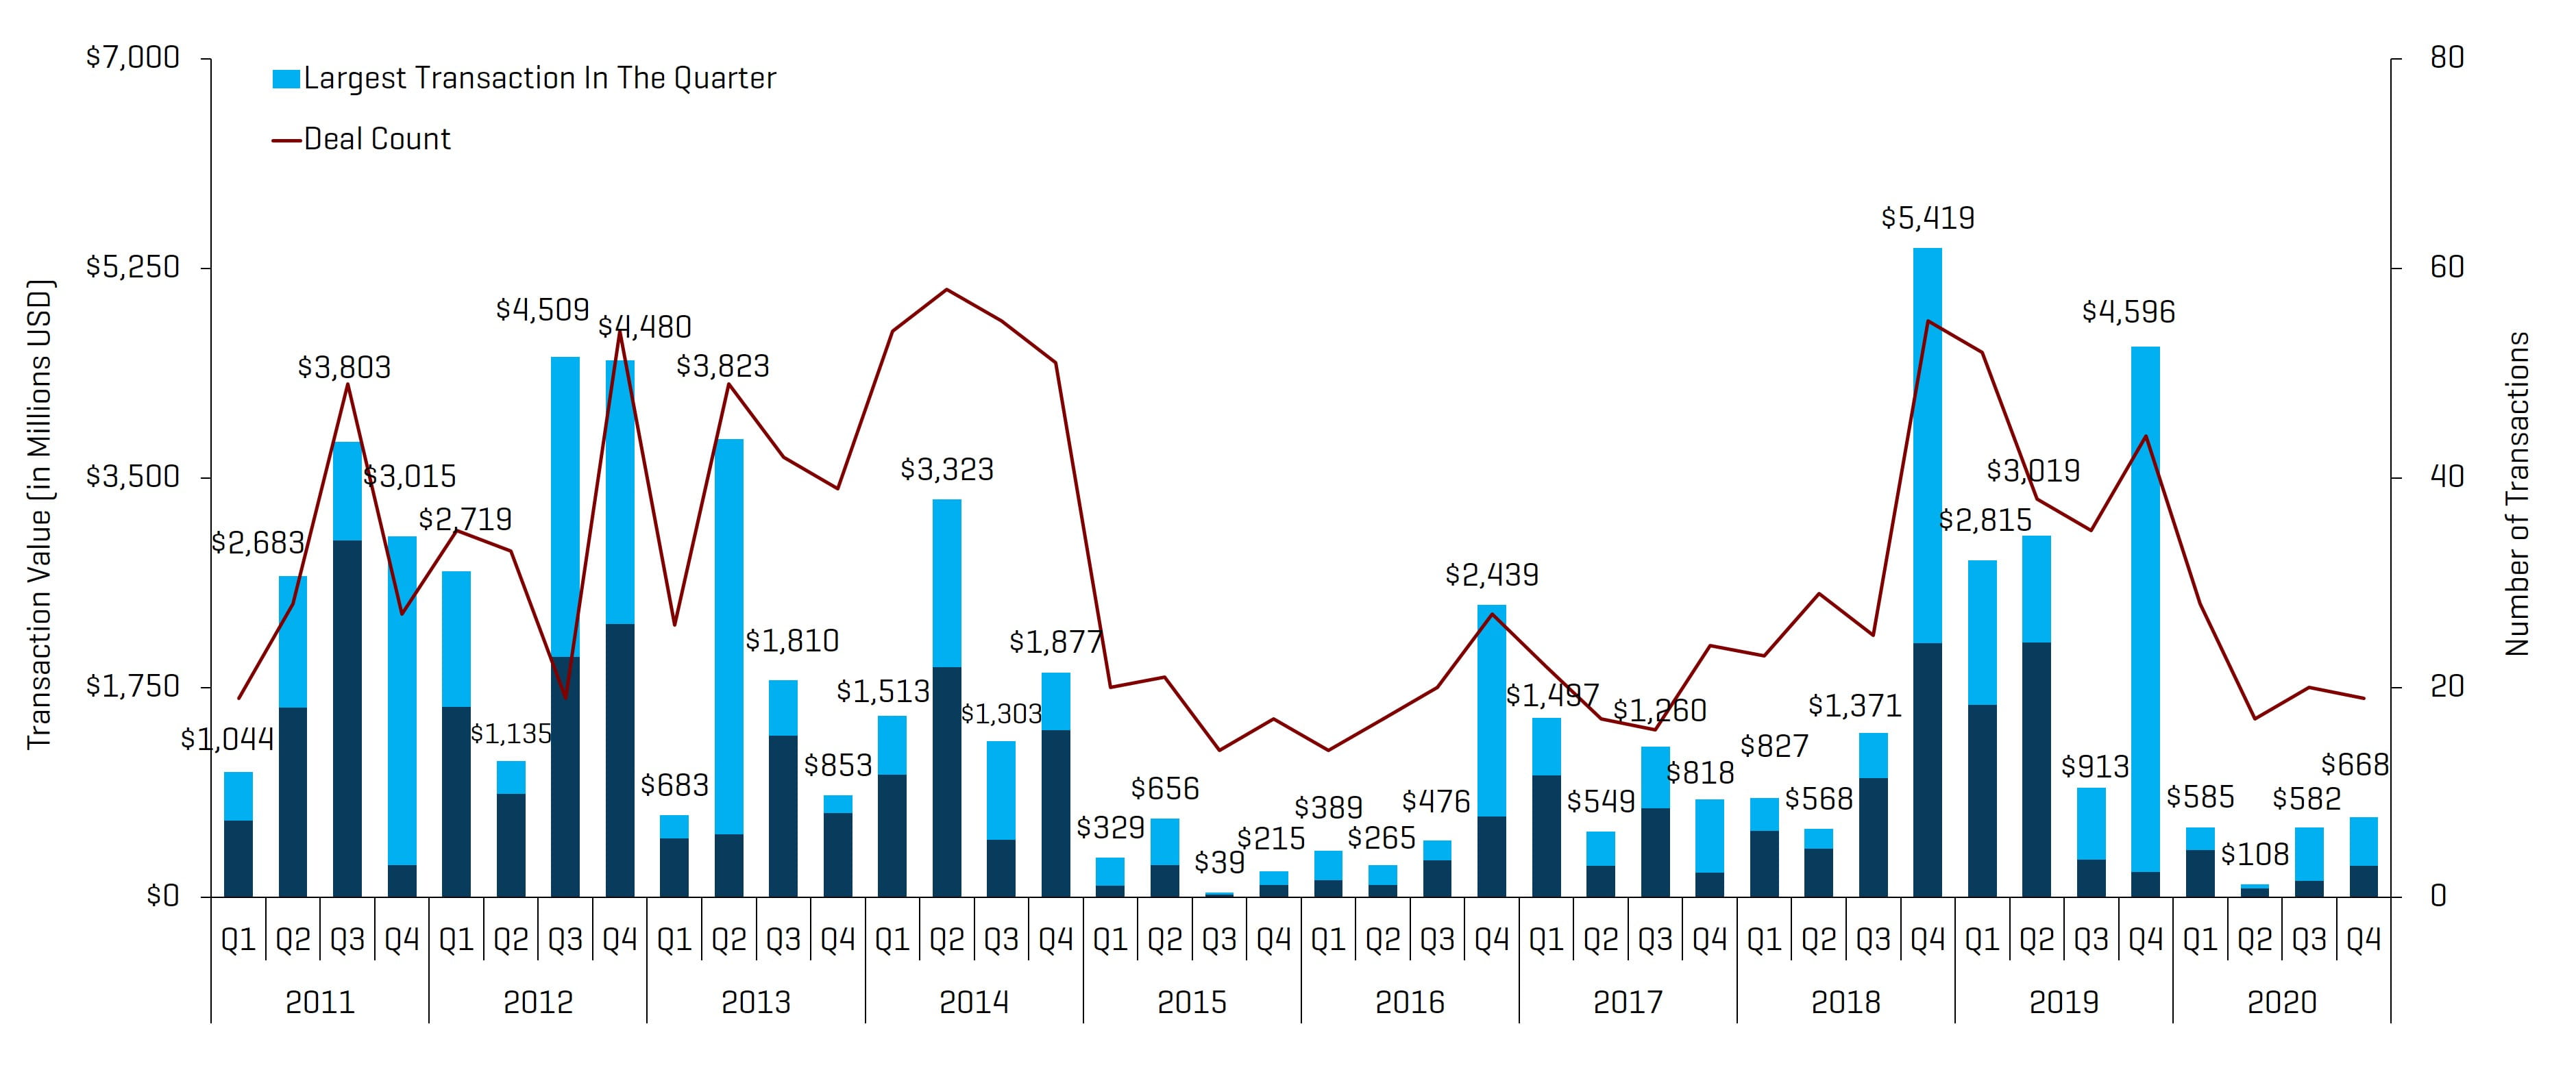
Energy service and equipment M&A activity remained similar by deal count and increased by value in the fourth quarter of 2020, totaling 19 transactions and $667.8 million, down slightly from 20 transactions and up from $582.0 million in the third quarter of 2020. Similar to the prior quarter, much of this quarter’s transaction value was driven by a single transaction: Caterpillar’s acquisition of Weir Group’s Oil and Gas division for $405 million. The outlook for 2021 M&A and financing activity in the Energy sector is likely to remain subdued until oil demand meaningfully recovers and financing is more readily available. Mid-2021 should see increased M&A activity as the vaccines are more widely distributed and business/travel accelerates.
NAM Oilfield Services and Equipment Transactions
Source: 1Derrick, S&P Capital IQ, and proprietary information
Note: Q3 2015 excludes the Schlumberger/Cameron transaction value of $14.8 billion and Q4 2016 excludes the Baker Hughes/GE transaction value of $32.0 billion for scaling
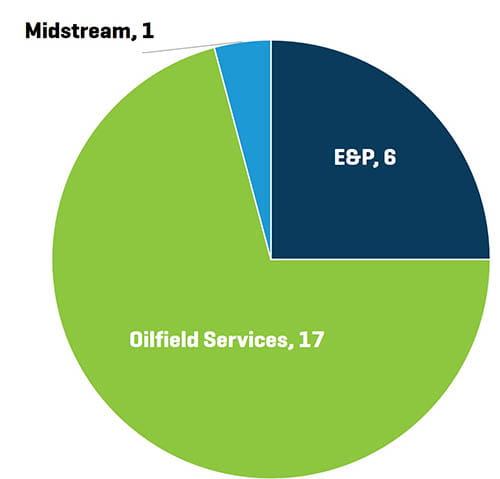
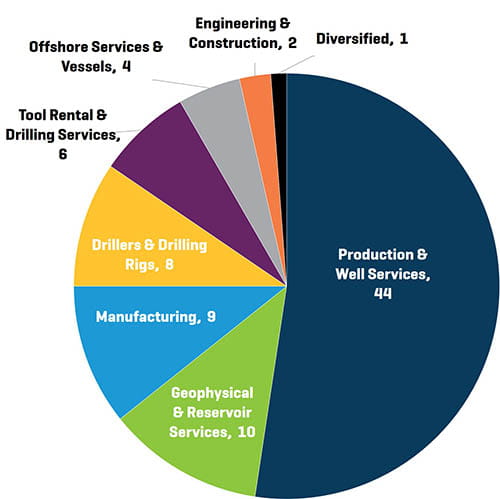
Q4 2020 NAM Energy Service and Equipment Transaction Count by Sector
Source: 1Derrick, S&P Capital IQ, and proprietary information
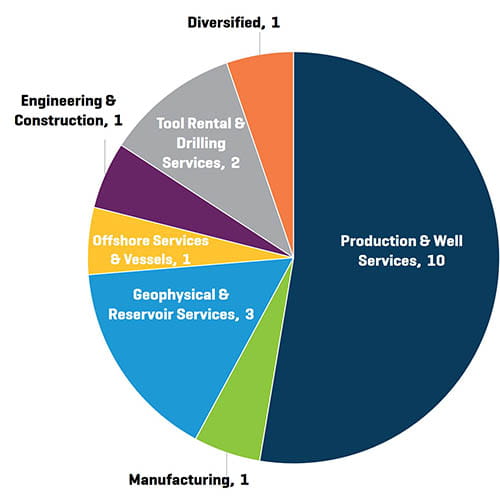
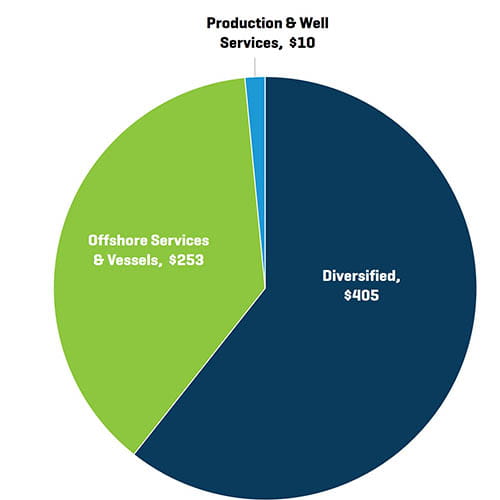
Transactions in the fourth quarter of 2020 decreased slightly in quantity and increased in value. The majority of transactions in the fourth quarter were Production & Well Services businesses (10), which was similar to the third quarter (12 total). Deal value in the fourth quarter was driven by Diversified businesses (Weir Group’s Oil and Gas division) and Offshore Services (RigNet’s sale to Viasat).
Q4 2020 NAM Energy Service and Equipment Transaction Value by Sector (Millions USD)
Source: 1Derrick, S&P Capital IQ, and proprietary information
Q4 2020 NAM Energy Service and Equipment Transaction Count by Buyer Profile
Source: 1Derrick, S&P Capital IQ, and proprietary information
Q4 2020 NAM Energy Service and Equipment Transaction Value by Buyer Profile (Millions USD)
Source: 1Derrick, S&P Capital IQ, and proprietary information
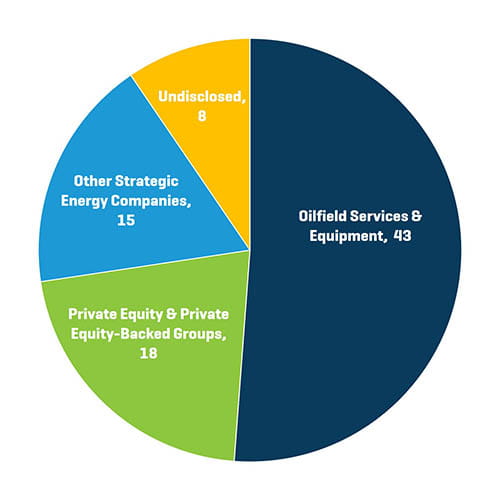
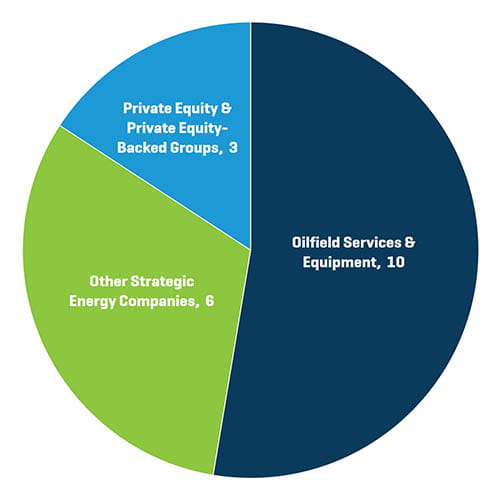
Strategic acquirers were the most active acquirers of Energy Service & Equipment businesses during the fourth quarter of 2020, representing 84.2% of all transactions (by count). PE and PE-backed groups are expected to remain muted buyers as debt financing remains challenging.
2020 NAM Energy Service and Equipment Transaction Count by Sector
Source: 1Derrick, S&P Capital IQ, and proprietary information
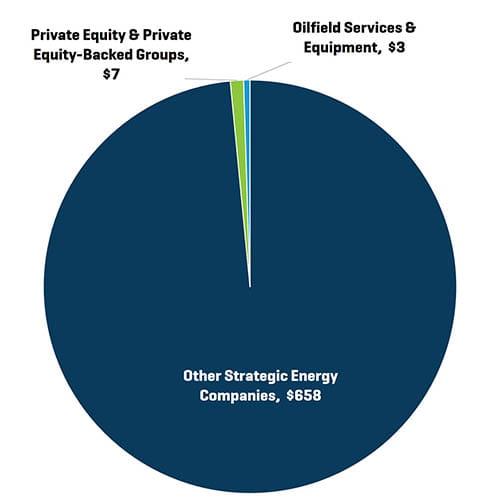
2020 NAM Energy Service and Equipment Transaction Count by Buyer Profile