English


The energy industry continued to witness substantial volatility during the second quarter of 2020. WTI front month prices dipped into negative territory for the first time ever on April 20, before rapidly rebounding during the next few weeks. Highlighting this roller coaster performance, WTI front month crude prices declined 10.8% from the beginning of the quarter to the day before the trough, then rebounded 292.3% by quarter-end! The decline and subsequent rise were both unprecedented in speed and percentage change. Despite the recovery in crude prices, many energy service companies continue to suffer from weak exploration and production (E&P) demand. A reduction in refined product demand due to COVID-19 restrictions, extreme uncertainty with respect to forecasts, and severe capital constraints have all been factors in the sector’s underperformance.
Oil and gas producers responded to the market by rapidly reducing drilling and completion activity and shutting in production. According to the U.S. Energy Information Administration (EIA), U.S. production declined from more than 12.7 million barrels per day in March to 11.0 million barrels per day by quarter-end. The U.S. frac spread count bottomed out at approximately 50 while the land drilling rig count declined to 254 by the end of the second quarter (a decline of 456 rigs, or 64.2%, from the end of the first quarter). This represents a decrease of 528 land rigs from the 2019 year-end level of 782. In addition, the second-quarter rig level was 33.2% below the nadir reached during the 2014-2016 oil and gas market decline.
While first quarter 2020 energy company bankruptcies were roughly in line with recent prior quarters, the second quarter witnessed a marked acceleration in distress. Thirty energy companies filed for bankruptcy protection, which was approximately twice as many compared to the prior quarter and the second quarter of 2019. This trend is likely to continue as companies exhaust Paycheck Protection Program (PPP) funding and industry activity levels remain depressed. While distress has been noted across the energy spectrum, the most prevalent areas of distress remain E&P companies and energy service and equipment companies.
The decline in U.S. drilling and completion activity will manifest itself in fewer wells and production in the future. This reduced production combined with improved refined product demand (COVID-19 issues continue to cloud the forecast), are expected to create a more balanced market. Crude price forecasts reflect this dynamic with most indicating meaningful contango.
Key Q2 Takeaways:
- WTI prices rebounded over the second quarter, closing up 91.7%;
- Henry Hub prices also improved over the quarter, ending 6.8% higher;
- North American (“NAM”) E&P transaction activity is expected to remain depressed as players focus on cash flow generation and liquidity;
- The number of second quarter bankruptcies accelerated compared to recent quarters; bankruptcies are anticipated to remain elevated in the third quarter as PPP funding is exhausted; and
- Public market valuations moderately increased through the second quarter of 2020 as worldwide COVID-19 quarantine restrictions have begun to subside
Crude Oil and Natural Gas
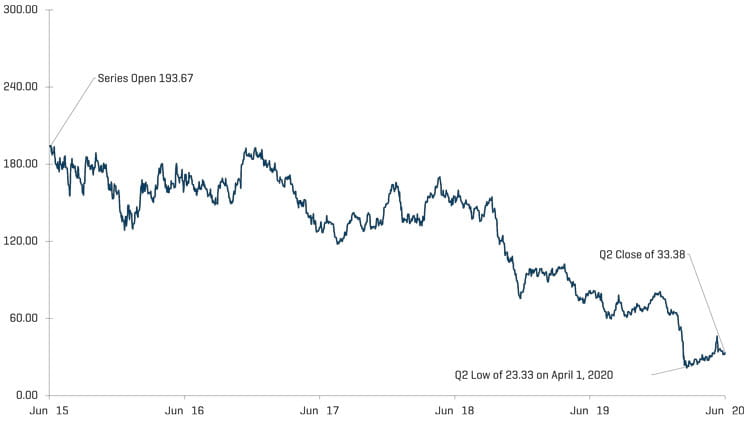
WTI crude front month oil prices closed the second quarter 91.7% higher than the first quarter, increasing from $20.31 per barrel to $39.27. Research analysts have forecasted median prices of $33.00 and $38.00 for the third and fourth quarters of 2020, respectively (notably lower than current prices). U.S. crude production is expected to remain between 10.9 and 11.2 million barrels per day through 2021.
Once again, natural gas experienced less severe daily price volatility during the second quarter; there were 37 days during the quarter in which natural gas prices moved more than 3% (similar to 35 such days for crude prices), however, natural gas prices only once moved more than 10% in any given day (compared with 11 such days for crude prices). In conjunction with more muted volatility, natural gas did not experience as robust of a rebound as crude oil, increasing from $1.64 to $1.75 over the quarter (6.8%).
CRUDE OIL [WTI] PRICES AND NATURAL GAS [HENRY HUB] PRICES
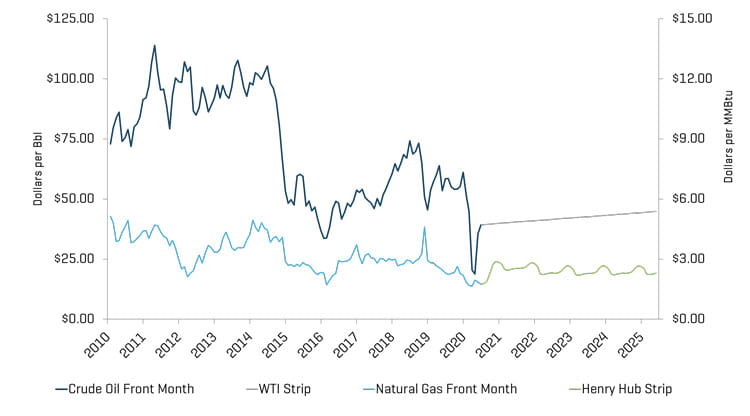
Source: Bloomberg, as of June 30, 2020
RESEARCH ANALYST CRUDE OIL [WTI] PRICE ESTIMATES
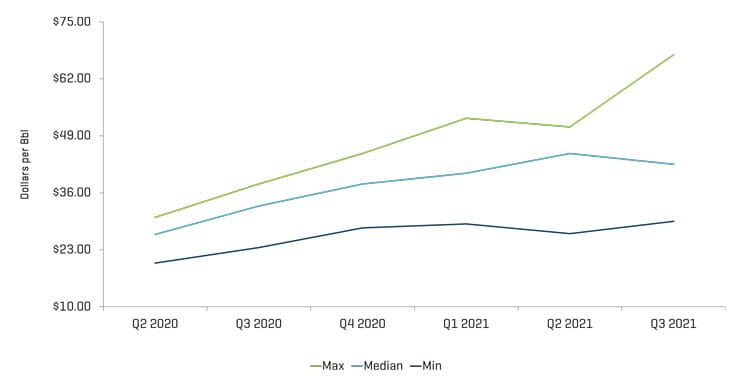
Source: Bloomberg, as of June 30, 2020
Note: Excludes estimates prior to March 9, 2020
Total U.S. rig count (including offshore rigs) decreased by 463 rigs, from 728 at the end of the first quarter to 265 rigs by the end of the second quarter. Most regions saw material declines in rig counts, most notably the Permian (decreased by 251 rigs). Similar to the previous quarter, U.S. crude oil production matched rig declines and decreased from more than 12.7 MMbpd in March 2020 to 11.0 MMbpd in June 2020.
HISTORICAL U.S. LAND RIG COUNT
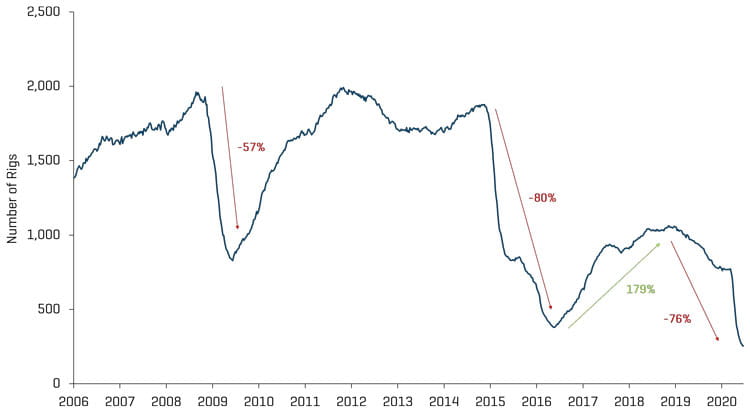
Source: Baker Hughes
DECREASE IN U.S. RIG COUNT SINCE PEAK IN 2018
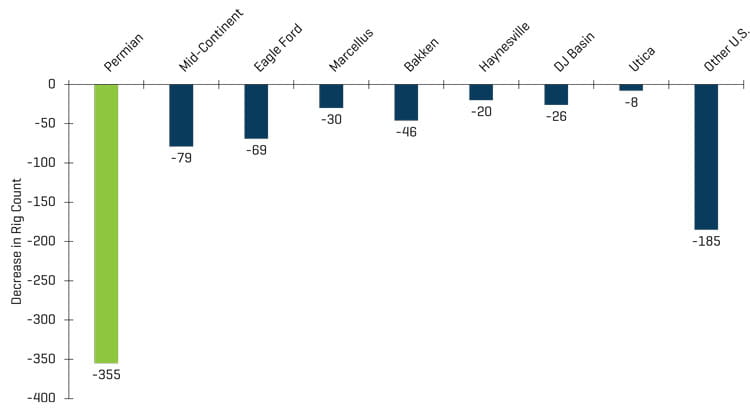
Source: Baker Hughes
U.S. RIG COUNT AND CRUDE OIL [WTI] PRICES
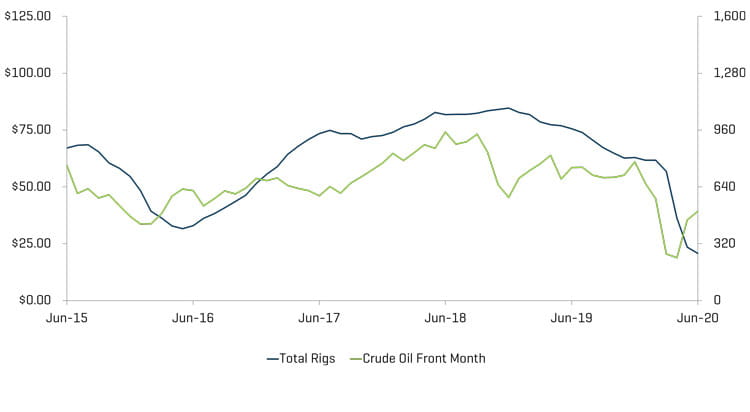
Source: Bloomberg, as of June 30, 2020 and Baker Hughes
Valuation Levels Modestly Improve as Coronavirus Lockdowns Subside
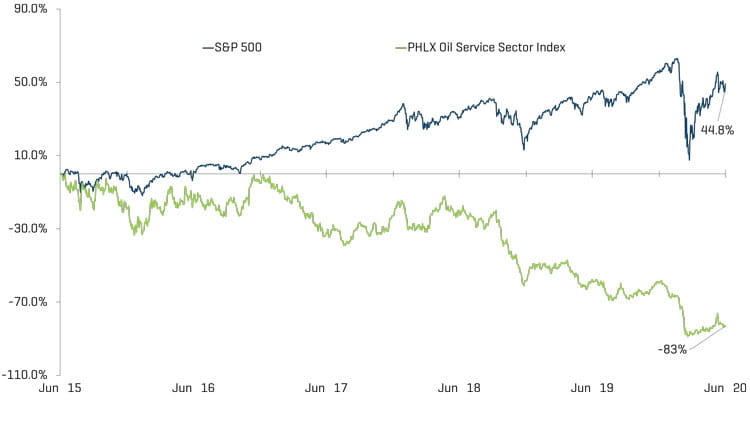
Overall, public valuations for energy service companies improved during the quarter, increasing 35.0%. Year-over-year performance for energy service companies (down 59.0%), however, continued to lag behind the overall U.S. market (up 20.0% during the quarter), as the extended impact of COVID-19 on global energy demand has continued to suppress investor sentiment.
EQUITY INDEX PERFORMANCE - OSX
Source: S&P Capital IQ, Inc.
EQUITY INDEX PERFORMANCE
Source: S&P Capital IQ, Inc.
The number of bankruptcies within the energy industry increased substantially as a result of reduced demand stemming from COVID-19 travel restrictions. Despite governments beginning to ease quarantine restrictions, many industry participants will likely feel continued distress in the coming months as global demand creeps to pre-COVID levels.
NORTH AMERICAN PRODUCER AND OFS BANKRUPTCIES
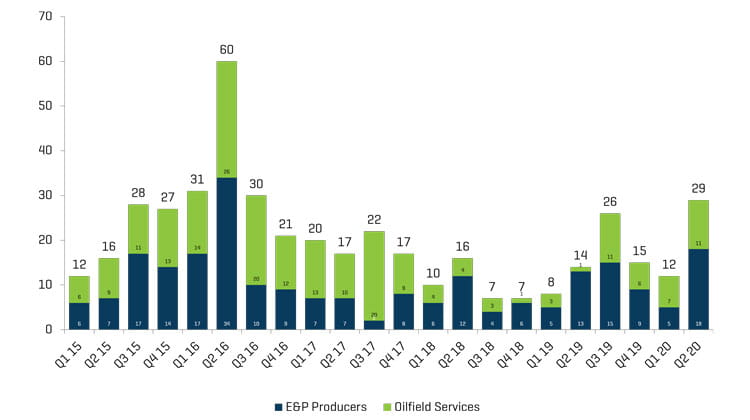
Source: Haynes and Boone, LLP
Q2 2020 ENERGY COMPANY BANKRUPTCIES BY FUNCTION
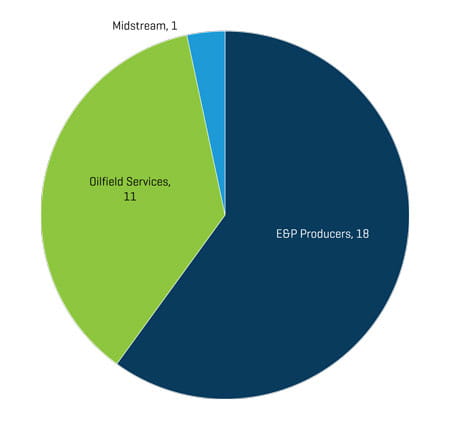
Source: Haynes and Boone, LLP
RECENT M&A TRENDS
M&A Activity Continued to Slow Through Q2 as the Demand Impact of COVID-19 Persisted
Energy service and equipment M&A activity decreased by transaction count and value in the second quarter of 2020, totaling 16 transactions and $104.2 million, down from 28 transactions and $584.7 million in the first quarter of 2020. Early in the first quarter of 2020 M&A activity exhibited promising signs, with more than a dozen transactions occurring in January, before global COVID-19 quarantine restrictions were imposed. Uncertainty behind the duration and severity of these restrictions stemmed the relative rise in activity and yielded another quarter of minimal transactions. Transactions further slowed late in the quarter with only three transactions occurring in June, suggesting that momentum may have driven the early transactions to completion as opposed to new activity. Significant concerns around the demand-side continue and consolidation is unlikely to occur in the immediate-term, however, once cash flow generation and better visibility return, the markets are expected to quickly trend toward a rebalance.
NAM OILFIELD SERVICES AND EQUIPMENT TRANSACTIONS
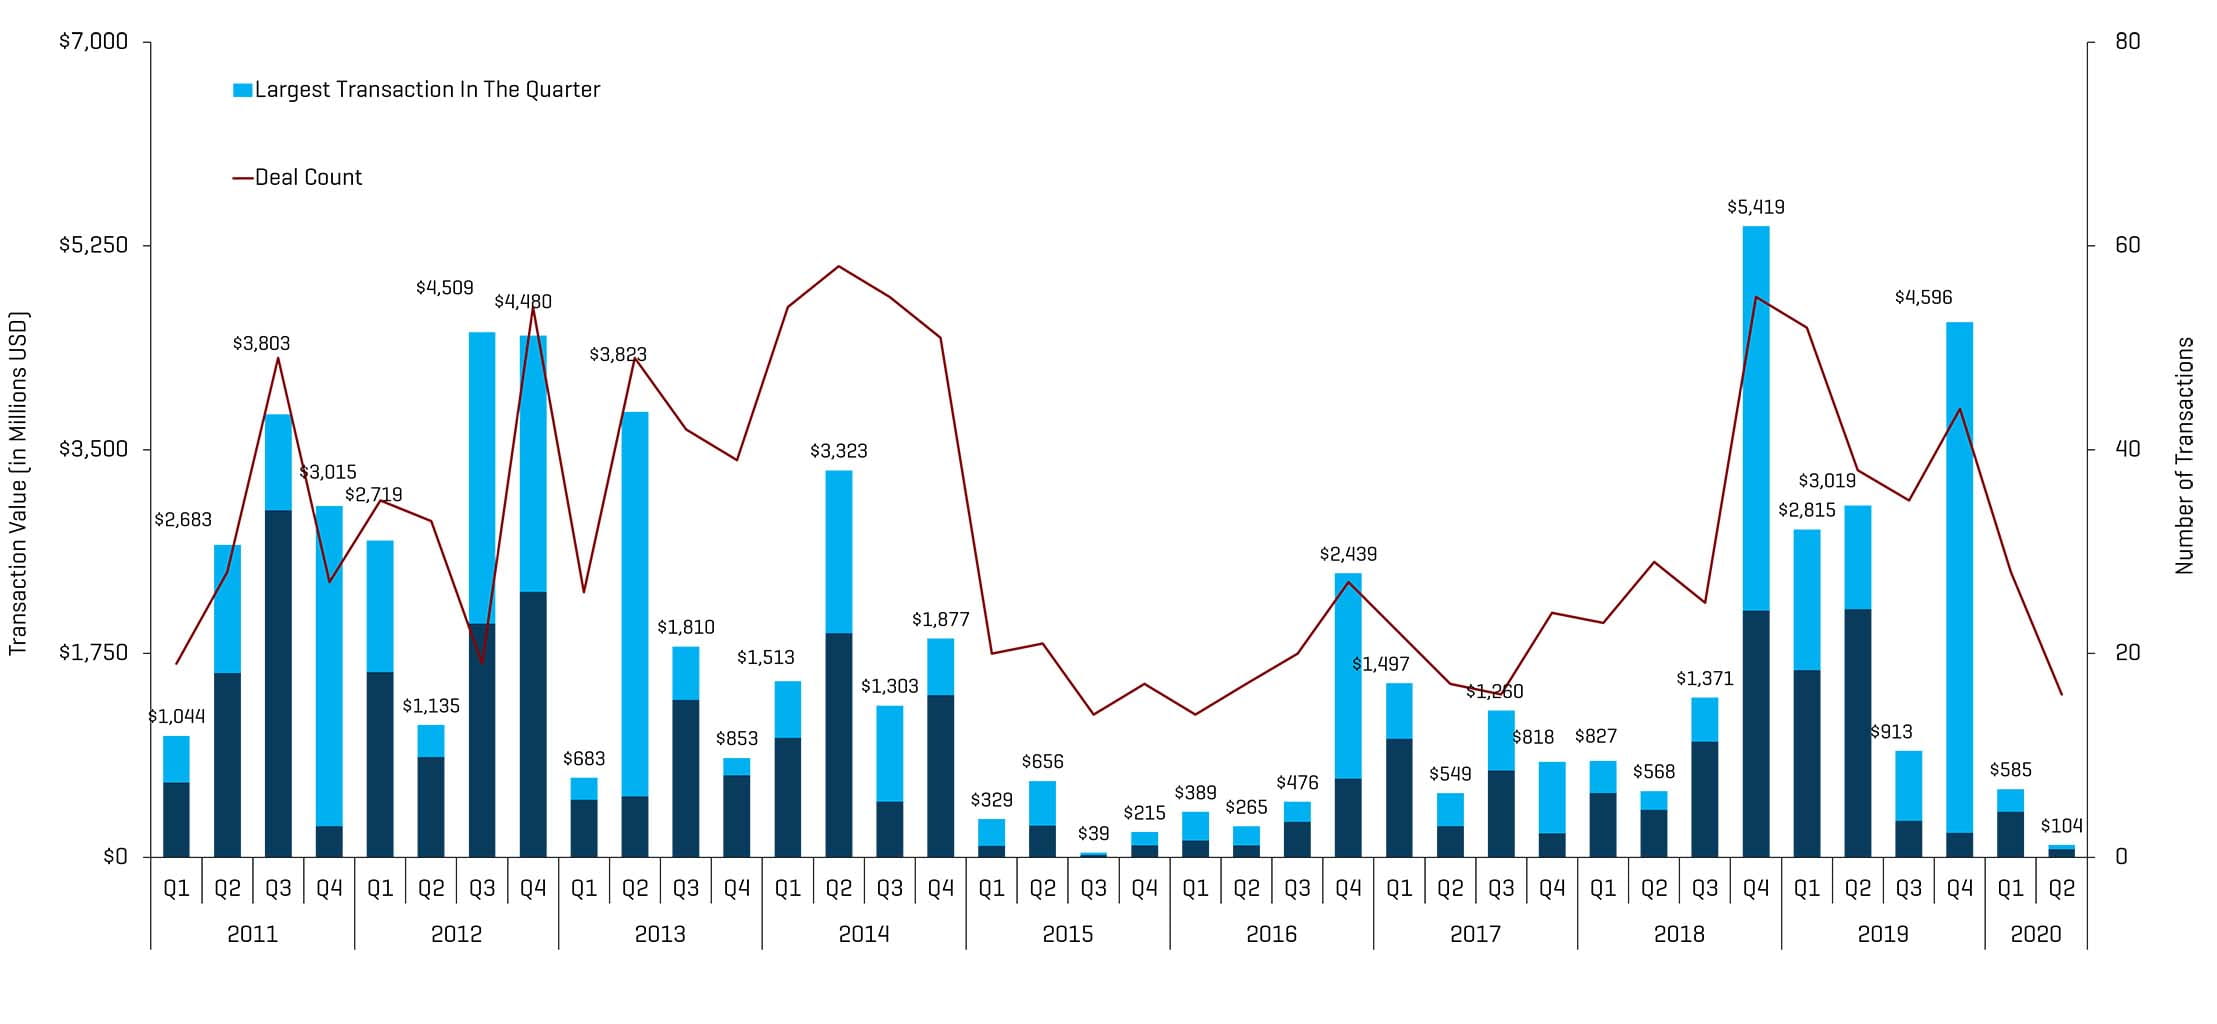
Source: 1Derrick, S&P Capital IQ, and proprietary information
Note: Q3 2015 excludes the Schlumberger/Cameron transaction value of $14.8 billion and Q4 2016 excludes the Baker Hughes/GE transaction value of $32.0 billion for scaling
Q2 2020 NAM ENERGY SERVICE AND EQUIPMENT TRANSACTION COUNT BY SECTOR
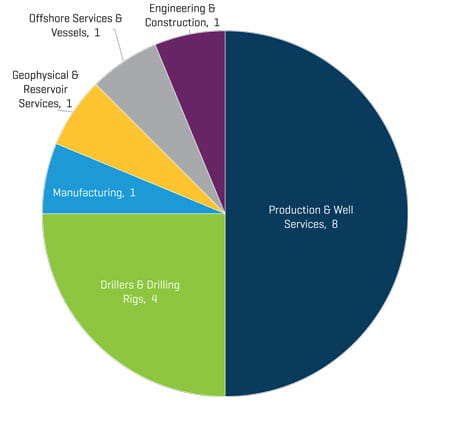
Source: 1Derrick, S&P Capital IQ, and proprietary information
Transactions in the second quarter of 2020 decreased in quantity and value. The decrease in the total number of transactions quarter-over-quarter was primarily driven by reduced activity from Production & Well Services businesses (decreasing from 14 to 8 transactions) as operators in the segment have struggled to justify production amid lower demand (and an existing oversupply dynamic).
Q2 2020 NAM ENERGY SERVICE AND EQUIPMENT TRANSACTION VALUE BY SECTOR [MILLIONS USD]
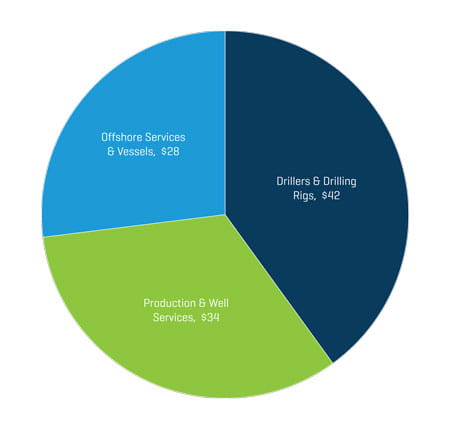
Source: 1Derrick, S&P Capital IQ, and proprietary information
Q2 2020 NAM ENERGY SERVICE AND EQUIPMENT TRANSACTION COUNT BY BUYER PROFILE
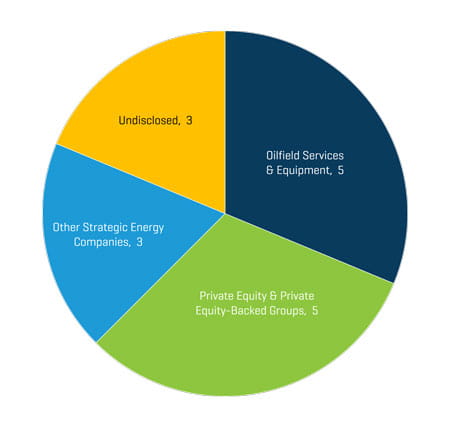
Source: 1Derrick, S&P Capital IQ, and proprietary information
Q2 2020 NAM ENERGY SERVICE AND EQUIPMENT TRANSACTION VALUE BY BUYER PROFILE [MILLIONS USD]
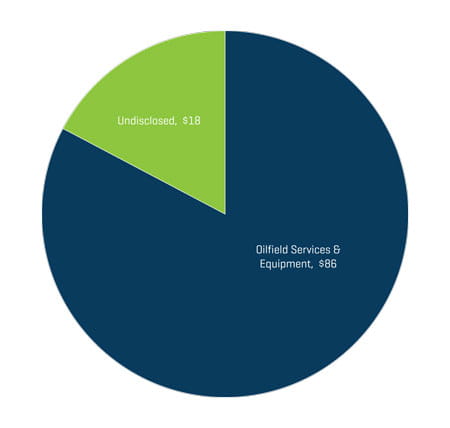
Source: 1Derrick, S&P Capital IQ, and proprietary information
Strategic acquirers were the most active acquirers of Energy Service & Equipment businesses during the second quarter of 2020, representing 83% of all transactions. Private equity and private equity-backed groups will likely remain inactive as financing is virtually non-existent and groups focus on cash flow generation and await reduced volatility.