English


The energy sector is no stranger to volatility, but the first quarter of 2020 represented a particularly tumultuous period. Crude oil prices declined 66.5% during the period, representing the largest quarterly decline on record (dating back to March 1983). The segment is being buffeted by several factors including: 1) persistent oversupply driven by U.S. shale producers and, most recently, ramped up Saudi Arabian and Russian production (see #3); 2) collapse in demand due to COVID-19 restrictions (via much less end use of diesel, jet fuel, etc.); 3) a market share tug-of-war among Saudi Arabia, Russia and other key players (notably U.S. shale producers) regarding production which, for the short-term, has led to Saudi and Russia boosting production when it is least needed (Note: the recent agreement on April 12 intended to partially alleviate the oversupply issue, but did not go far enough to mitigate the crashing demand); and 4) poor investor sentiment (the energy sector has been the worst performer in the S&P 500 for the past decade as well as increased ESG sensitivities from institutional investors). The combination of all these factors has led to a “perfect storm” in the sector.
No sector is immune, as upstream companies are witnessing 18-year low crude prices, and downstream businesses such as refineries are not benefiting from the low feedstock prices as demand has been crippled by COVID-19-driven restrictions. Not surprisingly, nearly all upstream businesses are cutting drilling and expenditure budgets (the average reduction in budgets during the quarter has been 30% to 35%). The drilling rig and frac spread counts, which had already declined ~40% and ~25%, respectively, since a recent peak in late 2018, are expected to further plummet in the face of these cuts. This has led to announcements of tens of thousands of energy-focused job layoffs and furloughs in the U.S. alone. Bankruptcies and restructurings are likely to accelerate as well, as companies grapple with ~$20 per barrel crude prices. EBITDA multiples and other valuation metrics have become meaningless as forecasting is very difficult now; near-term multiples are expected to balloon due to EBITDA estimates plummeting in 2020 (and have therefore not been included in this quarter’s report).
While energy businesses alone cannot resolve all the factors above (e.g., COVID-19), actions being taken now should lead to a future recovery in the sector. The rapid reduction in North American drilling and completion activity will manifest itself in fewer wells and production in the future. The EIA estimates U.S. crude oil production to decline from 12.7 to 11.1 million barrels per day (MMbpd) by year-end 2020. In addition, while the timing of lifting of COVID-19 restrictions is difficult to estimate, the impact on energy demand should be pronounced (i.e., diesel, jet fuel use should rapidly ramp up). This combination of improved supply (less) and demand (more) should provide better balance in the market and lead to improved commodity pricing. It will not resolve negative investor sentiment or immediate oversupply issue, but at least some of the trends will be moving in a positive direction.
Key Q1 Takeaways:
- WTI prices decreased over the first quarter, closing down 66.5% (largest decline on record);
- Henry Hub prices declined further over the quarter, ending ~25% lower;
- North American (“NAM”) E&P transaction activity is expected to decline as players cut budgets (30-35% reduction in drilling and completion budgets over the quarter) and remain focused on cash flow generation;
- While the number of first quarter bankruptcies remains in-line with prior periods, bankruptcies are anticipated to increase materially in the second quarter; and
- Public market valuations have seen significant declines through Q1 2020 as results have been impacted by worldwide quarantines due to COVID-19 and the Saudi-Russian market share tug-of-war
CRUDE OIL AND NATURAL GAS
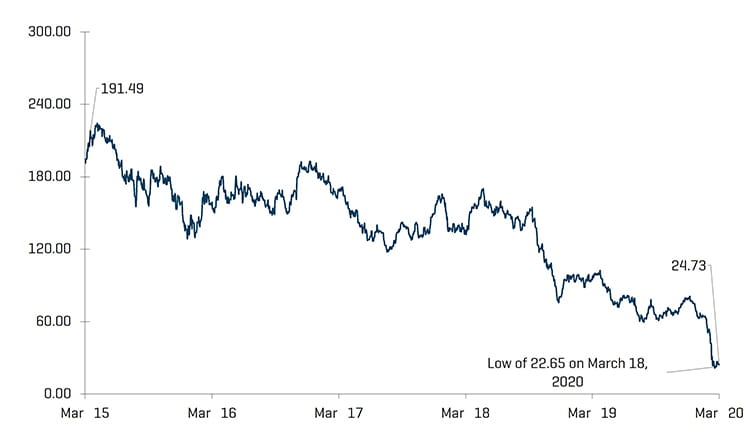
WTI crude oil prices closed the first quarter 66.5% lower than the fourth quarter, decreasing from $61.06 per barrel to $20.48, the lowest price in the last 18 years. Prior to the March 6 announcement that the Russians would not abide by the OPEC decision to cut oil production and the subsequent Saudi production boost response, in parallel with the extended COVID-19 restrictions, the median second quarter forecast was $56.25 per barrel. Research analysts have since revised their second quarter forecasts downward to a median price of $30.00 per barrel (a 46.7% decrease). It is notable, however, that the revised forecasts through the first half of 2021 are less than 15% lower than the forecasts prior to the announcement (i.e., illustrating pronounced contango in the market), indicating a degree of optimism (or return to normalcy) around a rebound in the near-term. Similarly, U.S. crude production is expected to decline from ~12.7 to ~11 MMbpd by October 2020 before modestly increasing to ~11.2 MMbpd by year-end 2021.
In contrast to crude oil, natural gas experienced less severe daily price volatility during the generally volatile first quarter (i.e., the energy “winner” in an overall terrible market); although there were 21 days during the quarter in which natural gas prices moved more than 3% (similar to 20 such days for crude prices), natural gas prices did not move more than 10% in any given day (compared to six such days for crude prices, and, more notably, three days greater that 20%). Despite slightly muted daily swings, natural gas prices trended downward and ended the quarter more than 25% below the fourth quarter 2019 close.
Crude Oil (WTI) Prices and Natural Gas (Henry Hub) Prices
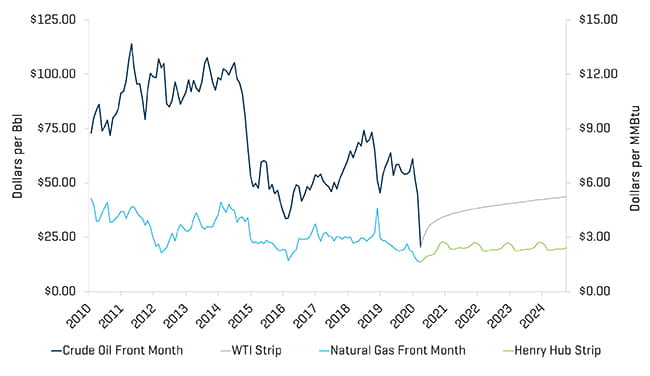
Source: Bloomberg, as of March 31, 2020
Research Analyst Crude Oil (WTI) Price Estimates1
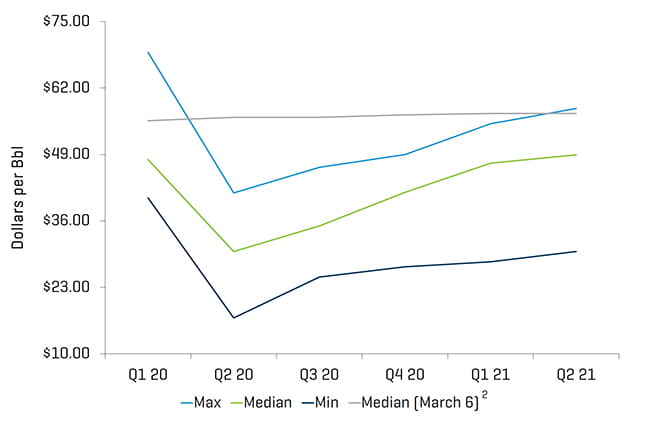
Source: Bloomberg, as of March 31, 2020
(1) Excludes estimates prior to March 9, 2020;
(2) Includes estimates from January 17 through March 6, 2020
U.S. rig count decreased by 141 rigs, from 805 to 664 rigs during the quarter. With the exception of the Arkoma Woodford and Granite Wash basins, all other regions saw material declines in their rig counts, most notably the Permian (decreasing by 54 rigs). Unlike previous quarters in 2019, U.S. crude oil production matched rig declines and decreased from 12.8 MMbpd in December 2019 to ~12.7 MMbpd in March 2020.
Historical U.S. Land Rig Count
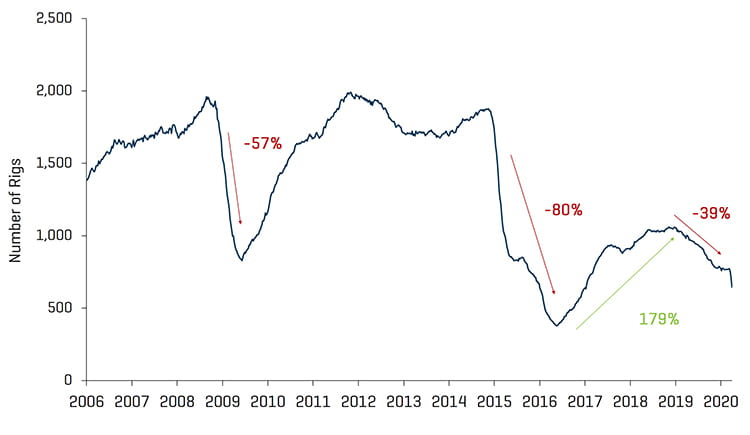
Source: Baker Hughes
Decrease in U.S. Rig Count Since Peak in 2018
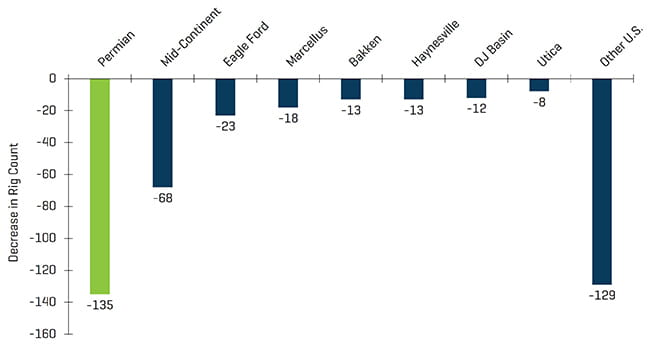
Source: Baker Hughes
U.S. Rig Count and Crude Oil (WTI) Prices
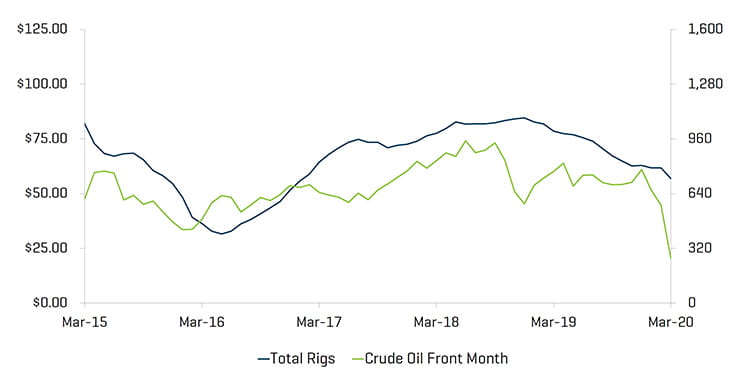
Source: Bloomberg, as of March 31, 2020 and Baker Hughes
VALUATION LEVELS TURN SHARPLY IN RESPONSE TO CORONAVIRUS SHUTDOWN
Public valuations for energy service companies declined sharply during the quarter, decreasing 68.4%. Year-over-year performance for energy service companies (down 73.9%) lagged behind the overall U.S. market (down 8.8%), despite the S&P 500 declining 20.0% over the quarter (including losing ~33% of value from February 19 to March 23) amid COVID-19 concerns.
Equity Index Performance - OSX
Source: S&P Capital IQ, Inc.
Equity Index Performance
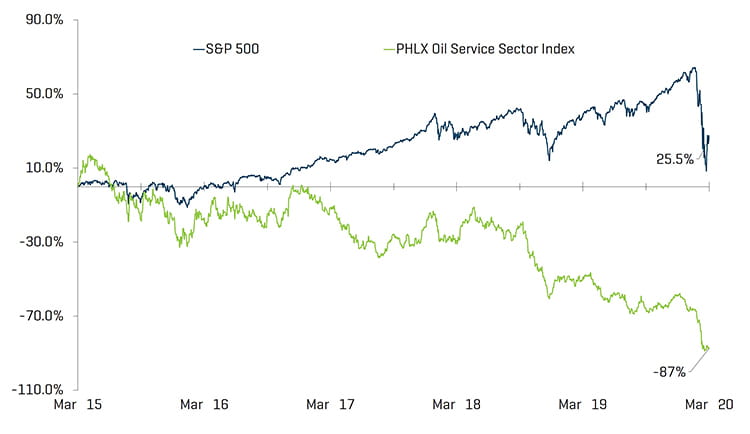
Source: S&P Capital IQ, Inc.
The number of bankruptcies within the energy industry were in line with previous quarters, as producers and energy service providers had not yet completely felt the impact of ~$20 per barrel crude. Many industry participants are likely to feel distress in the coming months, however, as COVID-19-driven demand effects and continued excess production are expected to hamper the supply-demand balance over the near-term.
North American Producer and OFS Bankruptcies
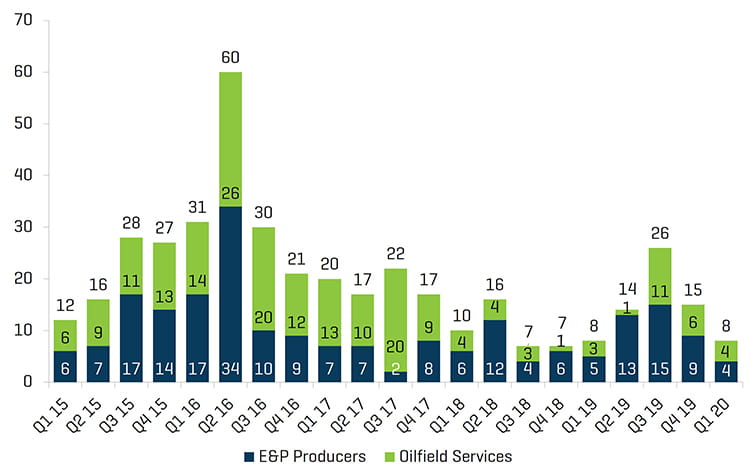
Source: Haynes and Boone, LLP
RECENT M&A TRENDS
M&A Activity Decreased in Q1 Amid Significant Uncertainty and a Continued Focus on Cash-Flow
Energy service and equipment M&A activity decreased by transaction count and value in the first quarter of 2020, totaling 26 transactions and $543.0 million, down from 44 transactions and $4.6 billion in the fourth quarter of 2019. Though the decrease was material, it should be noted that the largest transaction of the last quarter was a $4.4 billion merger between Apergy and ChampionX. Excluding the largest transactions from both quarters, total transaction value actually increased by ~$140 million; this quarter-over-quarter dynamic underscores the cautious optimism the industry exhibited at the beginning of the year. The optimism was short-lived, however, as both supply and demand-side forces suppressed the appetite for inorganic growth opportunities and forced companies to quickly return focus to cash flow generation. Although significant concerns remain, consolidation is expected to occur as early as late 2020 when demand is expected to tick back up and the markets trend toward a rebalance.
NAM Oilfield Services and Equipment Transactions
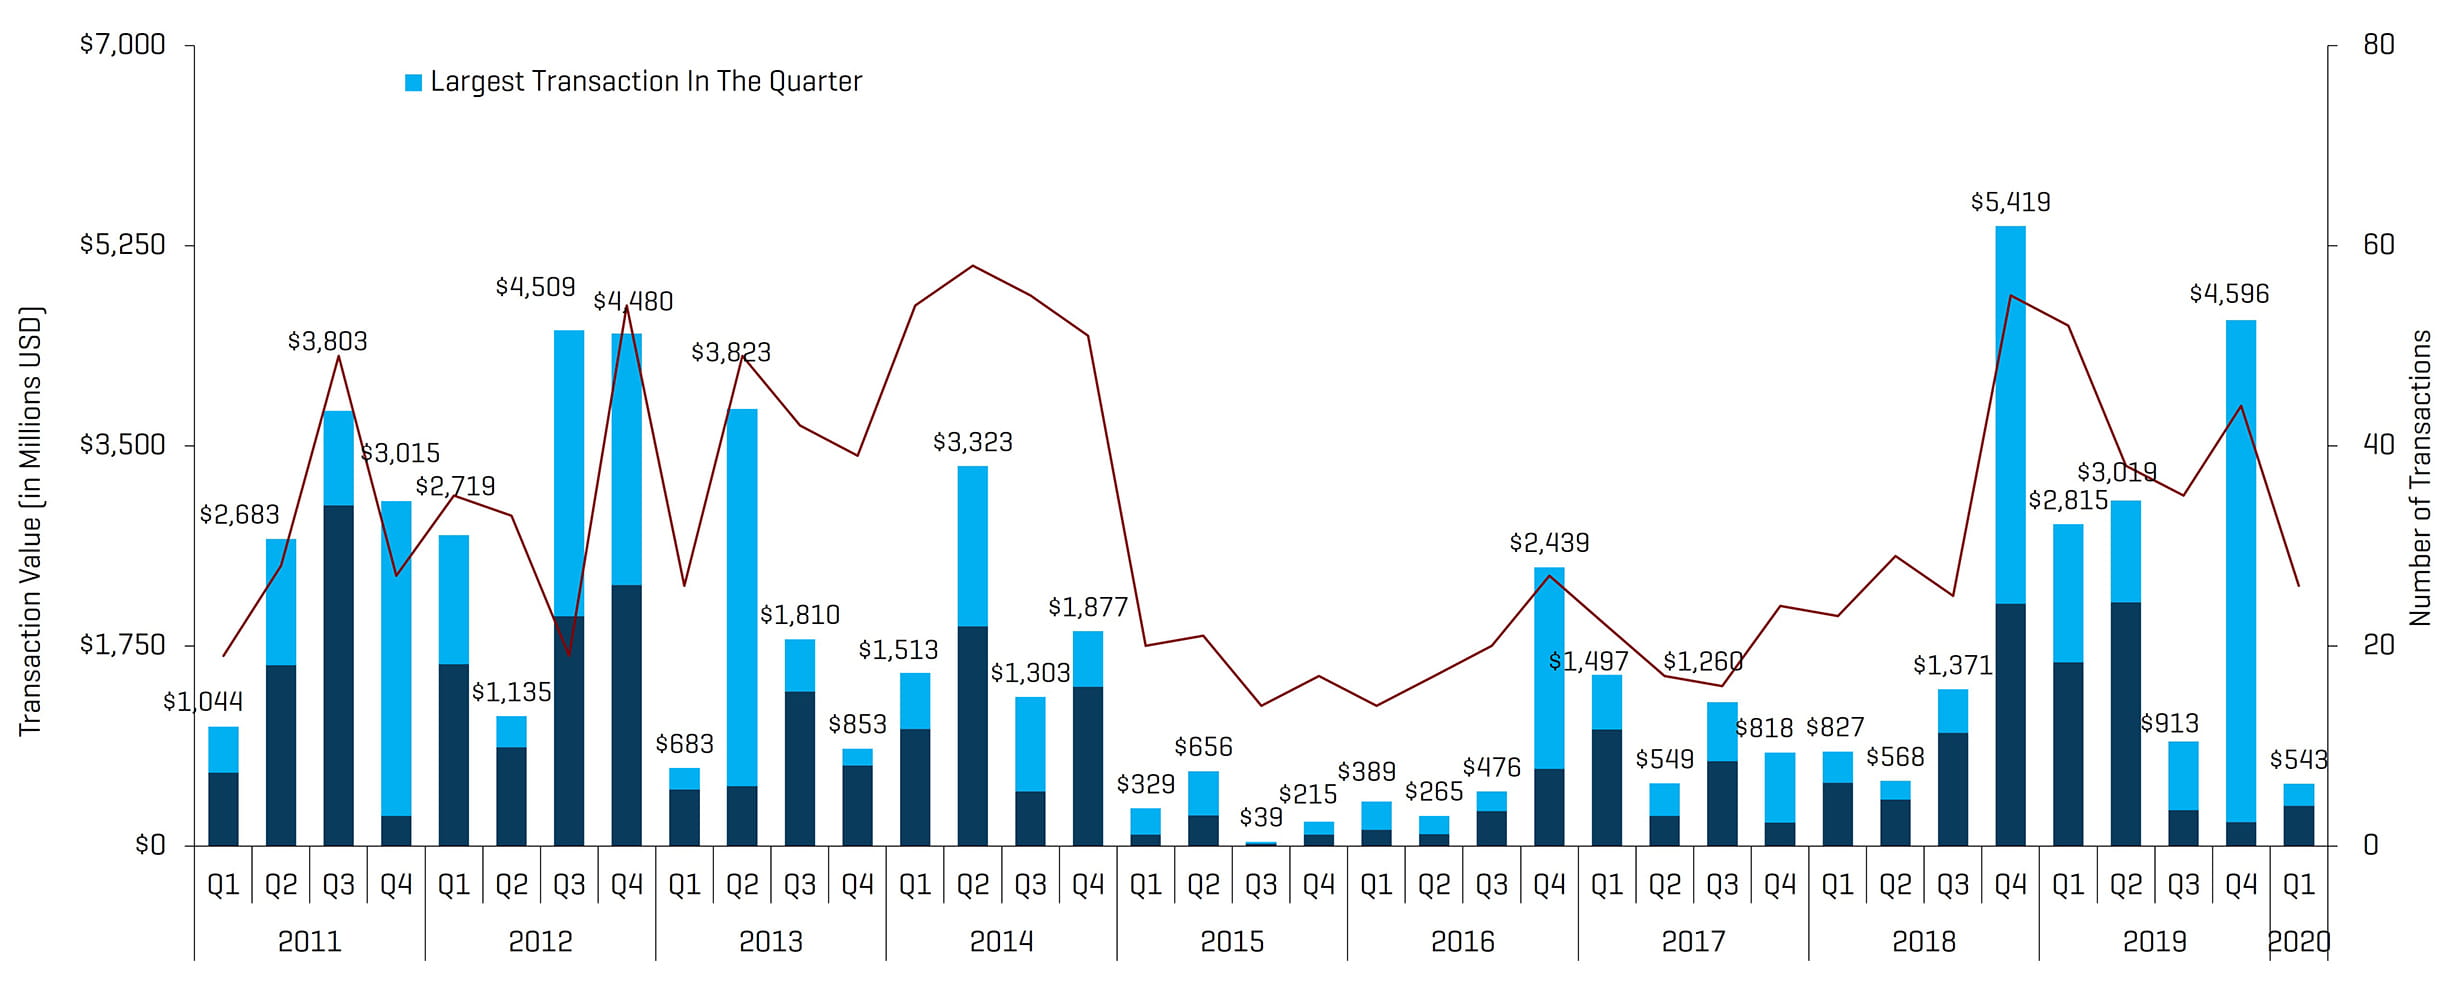
Source: 1Derrick, S&P Capital IQ, and proprietary information
Note: Q3 2015 excludes the Schlumberger/Cameron transaction value of $14.8 billion and Q4 2016 excludes the Baker Hughes/GE transaction value of $32.0 billion for scaling
Q1 2020 NAM Energy Service and Equipment Transaction Count by Sector
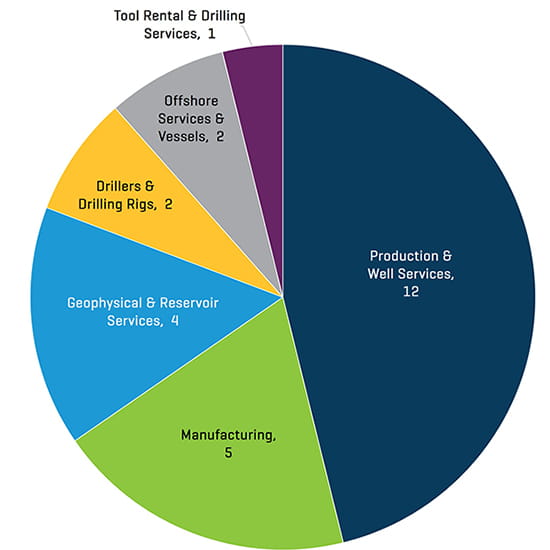
Source: 1Derrick, S&P Capital IQ, and proprietary information
Transactions in the first quarter of 2020 decreased in quantity and value. The decrease in the total number of transactions quarter-over-quarter was driven by muted activity from Production & Well Services businesses (decreasing from 25 to 12 transactions). The Offshore Services and Vessels and Geophysical and Reservoir Services segments did however see slight increases in transactions, zero to two and three to four, respectively.
Q1 2020 NAM Energy Service and Equipment Transaction Value by Sector [Millions USD]
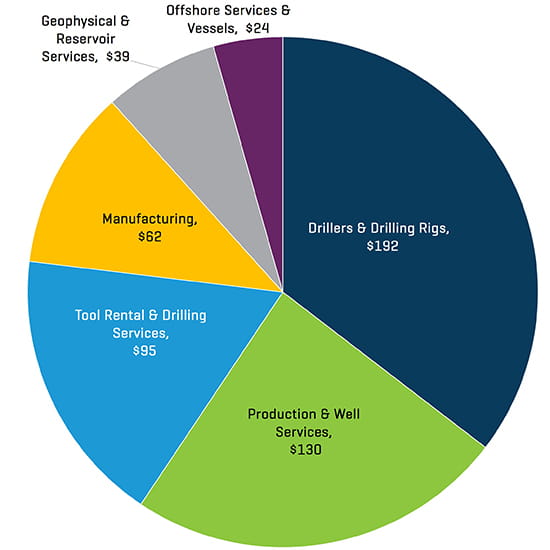
Source: 1Derrick, S&P Capital IQ, and proprietary information
Q1 2020 NAM Energy Service and Equipment Transaction Value by Buyer Profile [Millions USD]
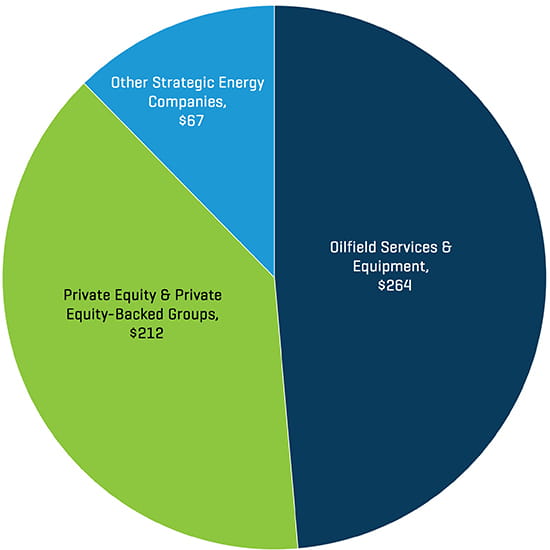
Source: 1Derrick, S&P Capital IQ, and proprietary information
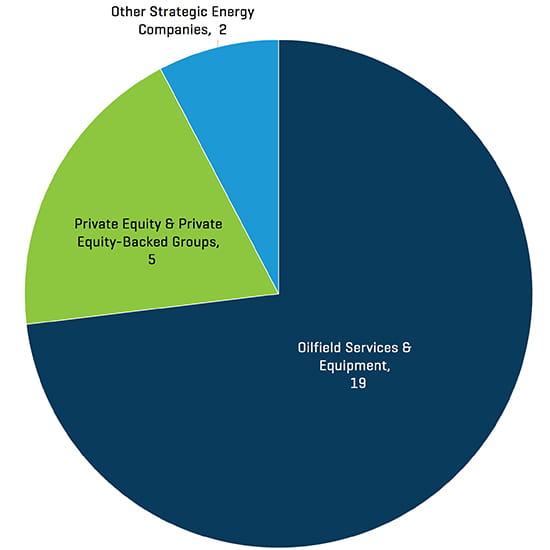
Q1 2020 NAM Energy Service and Equipment Transaction Value by Buyer Profile
Source: 1Derrick, S&P Capital IQ, and proprietary information
Strategic acquirers were again the most active acquirers of Energy Service & Equipment businesses during the first quarter of 2020, representing 81% of all transactions. PE and PE-backed groups represented the remaining 19% of total first quarter deals. While sponsor activity increased during the first quarter as a percentage of transactions, the number of transactions decreased quarter-over-quarter as groups sought less expansion opportunities and focused on increasing cash flow generation at existing portfolio companies.