English


The most recent quarter marked a period of “relative” stability for the energy sector. U.S. crude oil prices remained volatile, but less so than the first half of 2020. WTI prices ranged largely between the high $30s and low $40s during the quarter. While the drilling rig count continued its decline through most of the period, both the absolute and percentage changes were more muted compared to prior monthly declines. The rig count reached a nadir of 244 rigs on August 14, 2020; however, it has proceeded to increase 7% or 17 rigs during the past several weeks (Baker Hughes). Completion activity has also rebounded with the number of active frac spreads moving from approximately 70-75 spreads (Q2 2020) to approximately 120-125 spreads in September 2020.
According to the U.S. Energy Information Administration (“EIA”) U.S. crude oil production declined from more than 12.8 million barrels per day in January 2020 to 11.2 million barrels per day in September 2020 (the most recent data available). However, it should be noted that July production was approximately 6% higher than June 2020 levels. Improving demand for hydrocarbon products (as COVID-19 restrictions eventually ease) should help the global energy industry (in 2021 and 2022) though potential changes in regulations/permitting and ESG trends could create unique winners and losers in the segment. A new Presidential administration is likely to lead to more scrutiny and a throttle to U.S. supply, though most of the attention to date has been focused on offshore leases and activity on federal lands.
Consistent with the second quarter impact of COVID-19 on the industry, bankruptcies have steadily increased as PPP funding is exhausted, oil prices remain depressed, and lower demand persists. Although lenders have provided increased flexibility for struggling borrowers as they have reached covenant thresholds, many have been unable to find a clear path to profitability. Recent M&A activity within the energy service and equipment segment has been largely bifurcated between distressed-type transactions and those with some differentiated technology. The market will continue to place a premium on businesses that can create efficiencies and reduce costs. There has been a focus on businesses capable of analyzing large volumes of data, those that incorporate automation and artificial intelligence in their solutions, and safety and compliance technologies. A new administration may drive investments to energy transformation technologies and services - from hydrocarbons to solar, wind, and hydrogen fuel cells.
Key Q3 Takeaways:
- WTI prices remained relatively steady over the third quarter, closing up 1.0%
- Henry Hub prices materially improved during the quarter, ending 51.2% higher
- North American (“NAM”) E&P transaction activity remained depressed as players continued to focus internally on cash flow generation and liquidity
- The number of third quarter bankruptcies accelerated as PPP funding was exhausted
- In the aggregate, public market valuations have moderately increased through the third quarter as COVID-19 quarantine restrictions slowly subsided, though energy service companies have seen continued declines
Crude Oil and Natural Gas
WTI crude front month oil prices closed the third quarter 1.0% higher than the second quarter, increasing from $39.82 per barrel to $40.22. Research analysts have forecasted median prices of $39.60 and $42.50 for the fourth quarter of 2020 and first quarter of 2021, respectively. U.S. crude production is expected to remain between 11.0 and 11.3 million barrels per day through 2021.
Natural gas experienced slightly less daily price volatility during the third quarter; there were 30 days during the quarter in which natural gas prices moved more than 3% (as opposed to 37 such days during the second quarter). Despite less daily volatility, there were 4 days that prices moved more than 10%, the net result was an increase from $1.67 to $2.53 during the quarter.
Crude Oil [WTI] Prices and Natural Gas [Henry Hub] Prices
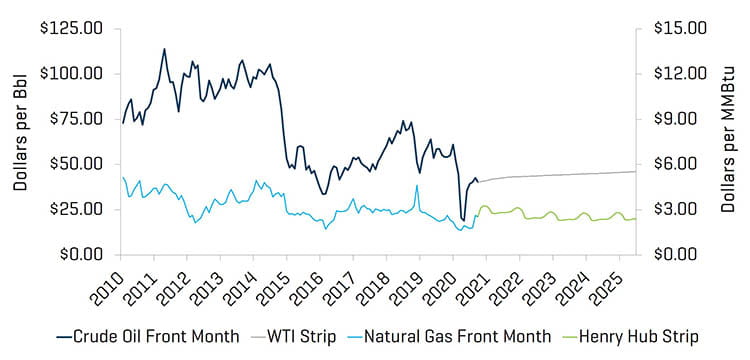
Source: Bloomberg, as of September 30, 2020
Research Analyst Crude Oil [WTI] Price Estimates
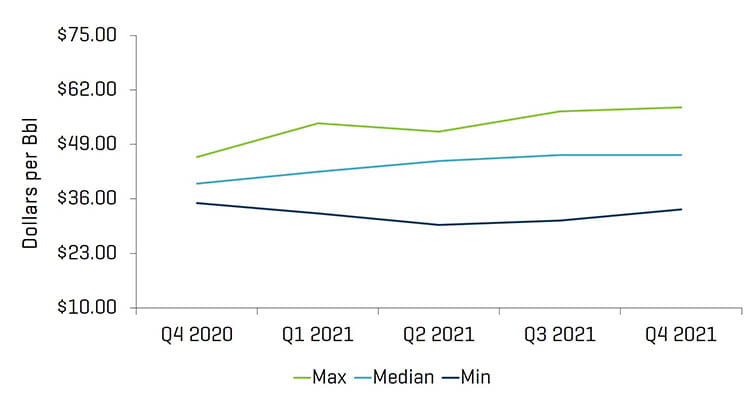
Source: Bloomberg, as of September 30, 2020
Total U.S. rig count (including offshore rigs) decreased by 4 rigs, from 265 at the end of the second quarter to 261 rigs by the end of the third quarter. Most regions saw slight declines in rig counts, most notably the Permian (decreasing from 131 to 125), Utica (decreasing from 9 to 6), and Barnett (decreasing from 2 to 0). Despite a slight decline in rigs, U.S. crude oil production rose from 10.5 MMbpd in June 2020 to 11.2 MMbpd in September 2020.
Historical U.S. Land Rig Count
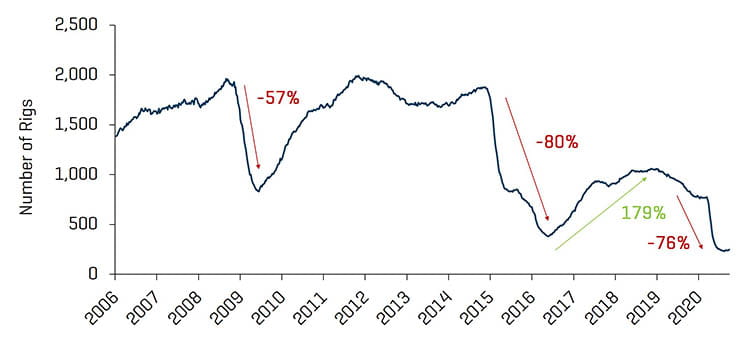
Source: Baker Hughes
Decrease in U.S. Rig Count Since Peak in 2018
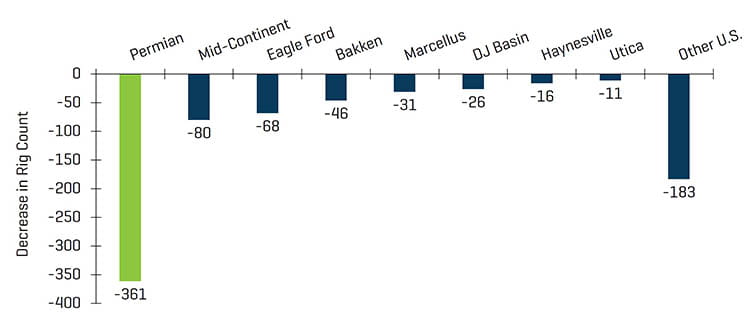
Source: Baker Hughes
U.S. Rig Count and Crude Oil [WTI] Prices
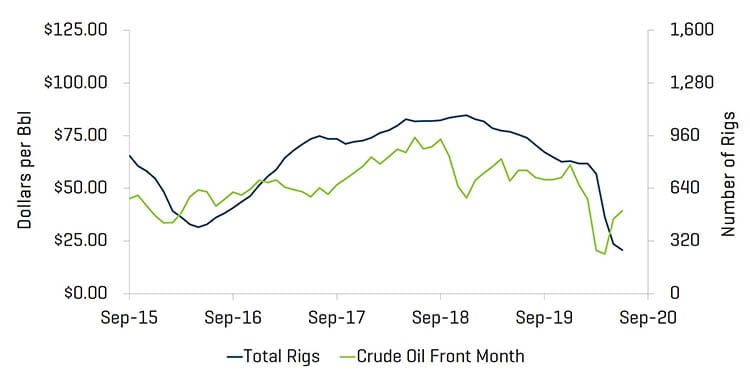
Source: Bloomberg, as of September 30, 2020 and Baker Hughes
Energy Service Valuation Levels Lag as the Broader Market Modestly Improves
Overall, public valuations for energy service companies declined during the quarter, decreasing 14.1%. Year-over-year performance for energy service companies was down 56.0% as the sector continues to trail the overall U.S. market (up 7.9% during the quarter and 14.4% year-over-year), as the impact of COVID-19 on global energy demand remains the key driver of suppressed investor sentiment.
Equity Index Performance - OSX
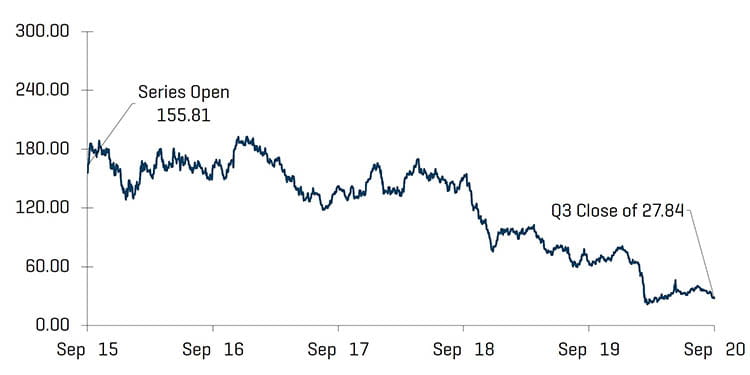
Source: S&P Capital IQ, Inc.
Equity Index Performance
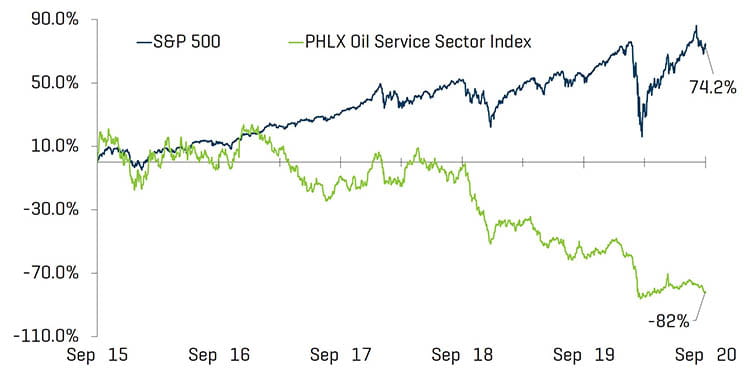
Source: S&P Capital IQ, Inc.
The third quarter saw another material increase in the number of bankruptcies within the energy industry. Despite easing quarantine restrictions, many industry participants feel continued distress from suppressed demand.
North American Producer, Midstream, & OFS Bankruptcies
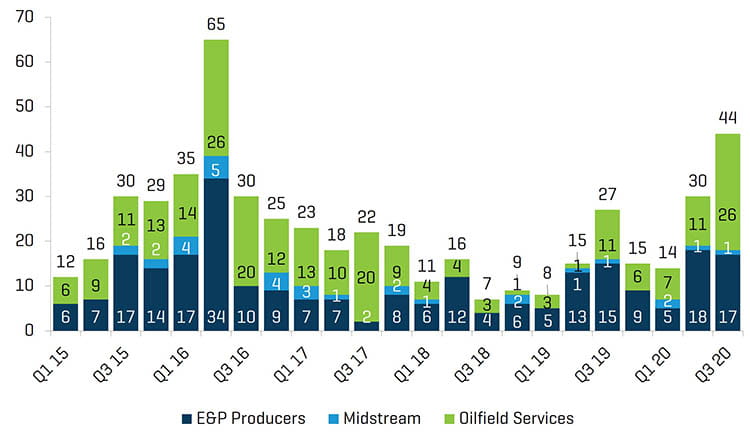
Source: Haynes and Boone, LLP
Q3 2020 Energy Company Bankruptcies by Function
Source: Haynes and Boone, LLP
RECENT M&A TRENDS
M&A Activity Remained Slow Through Q3 as the Impact of COVID-19 Persists
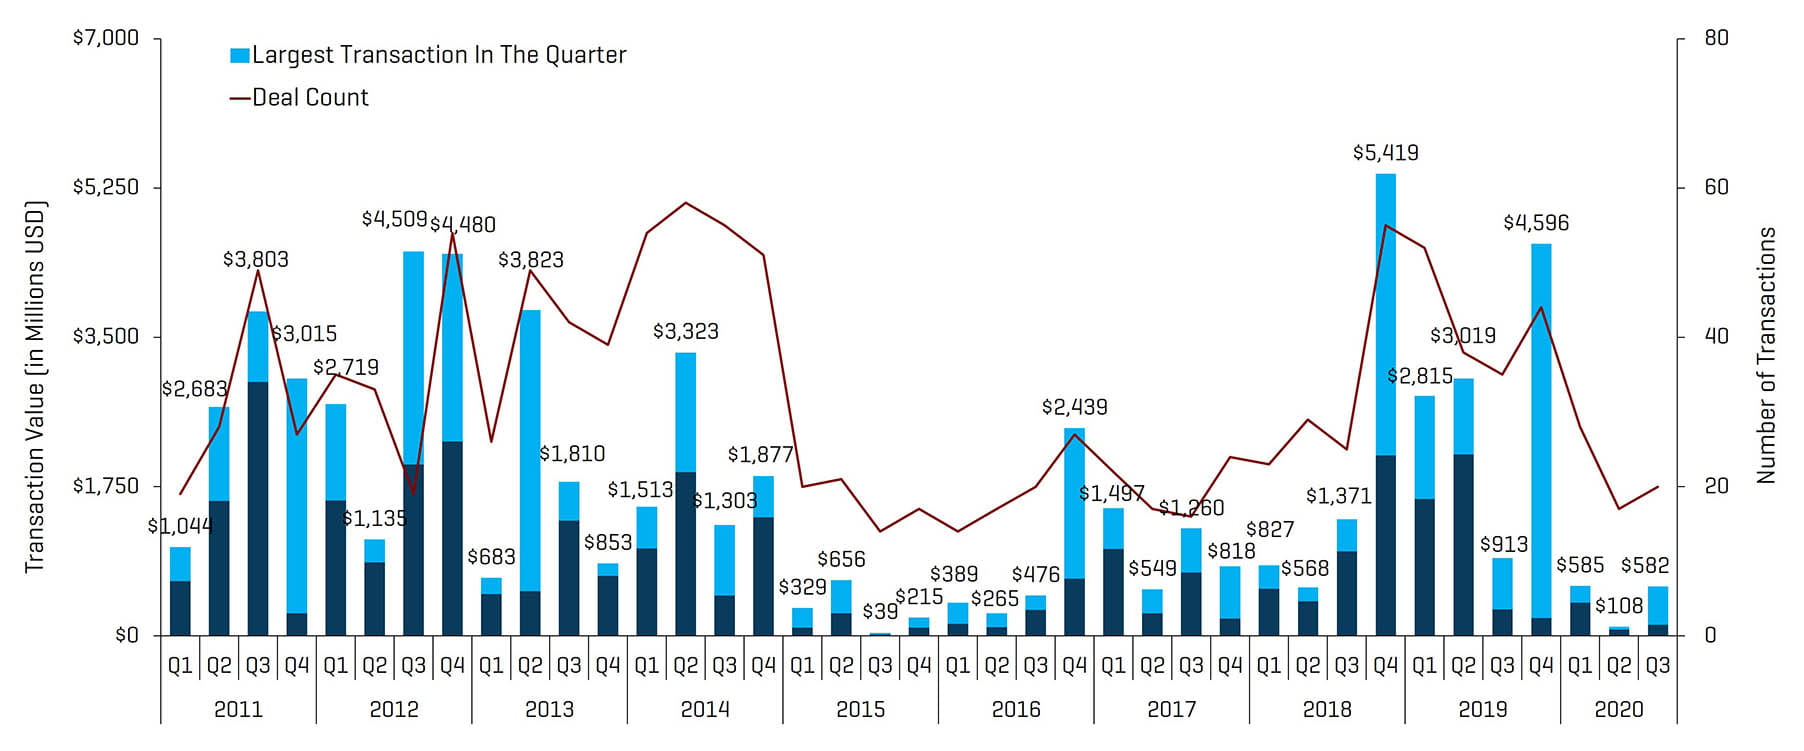
Energy service and equipment M&A activity increased by transaction count and value in the third quarter of 2020, totaling 20 transactions and $582.0 million, up from 17 transactions and $107.9 million in the second quarter of 2020. Although COVID-19 headwinds have mostly prevented a material return of volume or valuation of M&A transactions, Stout has observed that the recent uptick in deal flow is the result of buyers and sellers utilizing/accepting increased and “creative” offer structuring. The general lack of availability of acquisition financing has continued to drag the cash component of M&A valuations, in particular for asset light / cash flow-based borrowers. The outlook for the fourth quarter of 2020 M&A and financing activity in the Energy sector is likely to remain subdued until demand meaningfully recovers. Mid to late 2021 should see increased M&A activity as pandemic concerns gradually subside and business accelerates.
NAM Oilfield Services and Equipment Transactions
Source: 1Derrick, S&P Capital IQ, and proprietary information
Note: Q3 2015 excludes the Schlumberger/Cameron transaction value of $14.8 billion and Q4 2016 excludes the Baker Hughes/GE transaction value of $32.0 billion for scaling
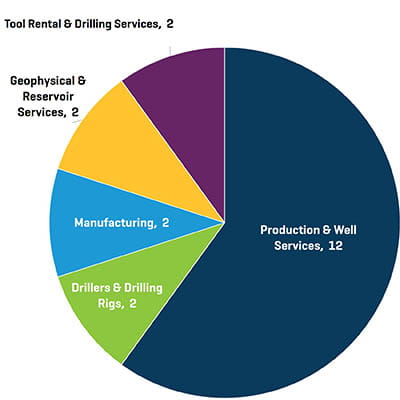
Q3 2020 NAM Energy Service and Equipment Transaction Count By Sector
Source: 1Derrick, S&P Capital IQ, and proprietary information
Transactions in the third quarter of 2020 increased in quantity and value. The increase in the total number of transactions quarter-over-quarter was driven by activity from Production & Well Services businesses (increasing from 8 to 12 transactions).
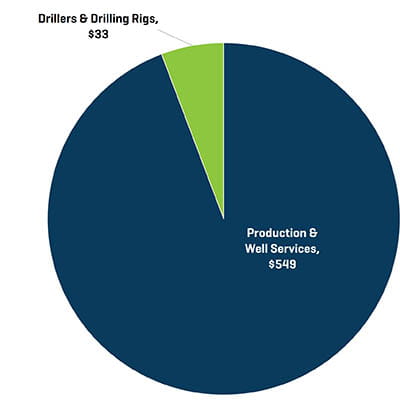
Q3 2020 NAM Energy Service and Equipment Transaction Value By Sector [Millions USD]
Source: 1Derrick, S&P Capital IQ, and proprietary information
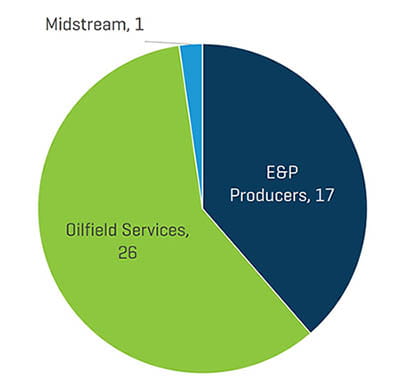
Q3 2020 NAM Energy Service and Equipment Transaction Count By Buyer Profile
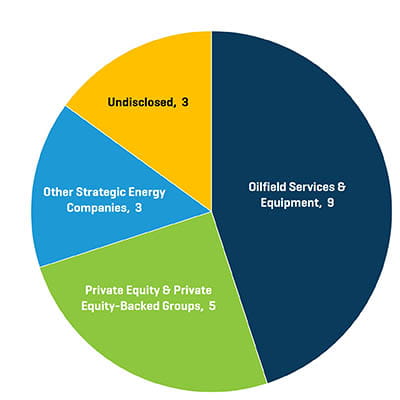
Source: 1Derrick, S&P Capital IQ, and proprietary information
Q3 2020 NAM Energy Service and Equipment Transaction Value By Buyer Profile [Millions USD]
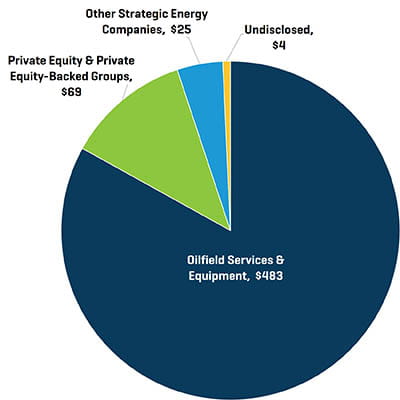
Source: 1Derrick, S&P Capital IQ, and proprietary information
Strategic acquirers were the most active acquirers of Energy Service & Equipment businesses during the third quarter of 2020, representing 83% of all transactions. PE and PE-backed groups are likely to remain inactive as financing is virtually non-existent and groups focus on cash flow generation and await reduced volatility.