English


The third quarter of 2021 ended with commodity prices continuing their upward movement. While U.S. crude oil prices modestly increased 2.1% during the quarter to $75.03 per barrel, this does not reflect the wide swings during the quarter, including a +20% increase in WTI prices from mid-August as steadily increasing demand and concerns about future supply created a bullish trend for oil. The drilling rig count rose by 51 rigs (per Baker Hughes) during the third quarter of 2021, which represented another meaningful quarterly rig count expansion (once again driven by private Oil & Gas companies) continuing the trend that began in August 2020. Completion activity also increased with the number of active frac spreads expanding from approximately 200 spreads in June 2021 to more than 230 spreads by the end of September 2021 (per Primary Vision). Natural gas prices also surged during the quarter, rising from $3.65 at the end of the second quarter to $5.87 by the end of this quarter (representing a 60.7% increase). The natural gas pricing move was driven by a meaningful increase in exports (via pipeline and LNG shipments) and recovering demand from the pandemic. In particular, Asian and European LNG prices have skyrocketed to record levels due to low storage levels, weak alternative power generation (primarily wind in the North Sea), and concerns about supply shortages heading into the winter heating season. Since U.S. LNG exports have expanded at a faster pace than U.S. natural gas production, natural gas injections continue to linger below their five-year averages, which is expected to lead to higher natural gas prices during the upcoming winter season. The U.S. Energy Information Administration ("EIA") estimates the price will average $5.67 per MMBtu between October 2021 and March 2022.
U.S. crude oil production averaged 11.0 million barrels per day (“MMB/D”) in the third quarter, approximately 0.3 MMB/D less than the second quarter and is expected to average 11.1 MMB/D per the (“EIA”). While the Biden Administration pursued an aggressive environmental agenda earlier in the year, concerns about rising gasoline/diesel prices and elevated heating bills (i.e., from natural gas and heating oil) has forced the Administration to reach out to domestic Oil & Gas companies and seek increases in supply. However, continued uncertainty regarding the future regulatory framework and relatively tepid investor and cautious lending interest will likely mute production growth.
Similar to previous quarters, recent M&A activity within the energy service and equipment segment has been largely focused on production and well services.
Key Q3 Takeaways:
- WTI prices rose incrementally during the third quarter, closing up 2.1%
- Henry Hub prices dramatically increased during the quarter (up nearly 60.7%)
- North American (“NAM”) energy transaction activity increased incrementally from second quarter
- Public market energy company valuations have moved lower through Q3 2021
Crude Oil and Natural Gas Prices Increased Again During Quarter
WTI crude front month oil prices closed the third quarter 2.1% higher than the second quarter, increasing from $73.47 per barrel to $75.03. Research analysts have forecasted median prices of $68.54 and $67.00 for the fourth quarter of 2021 and first quarter of 2022, respectively. U.S. crude production is expected to remain between 11.0 and 11.3 MMB/D through the fourth quarter.
Natural gas prices are expected to average $5.95 per MMBtu through the end of 2021. The EIA is forecasting natural gas production to increase 0.4% from October to December 2021 to 101.8 BCF per day.
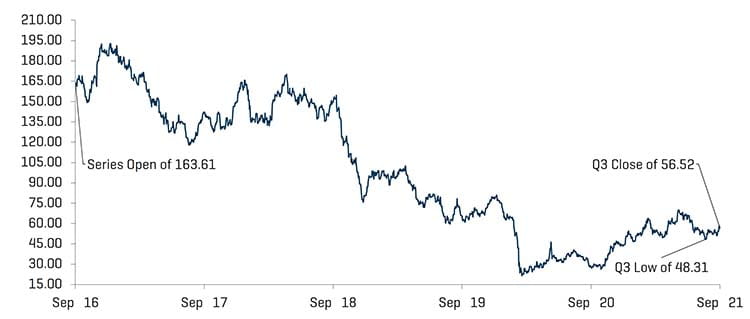
Crude Oil [WTI] Prices and Natural Gas [Henry Hub] Prices
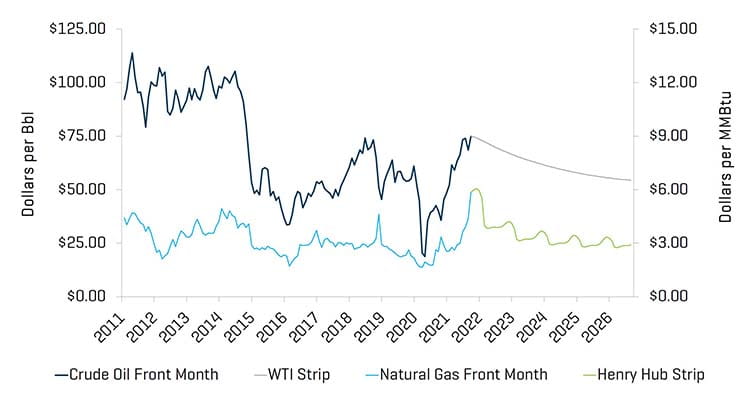
Source: Bloomberg, as of September 30, 2021
Research Analyst Crude Oil [WTI] Price Estimates
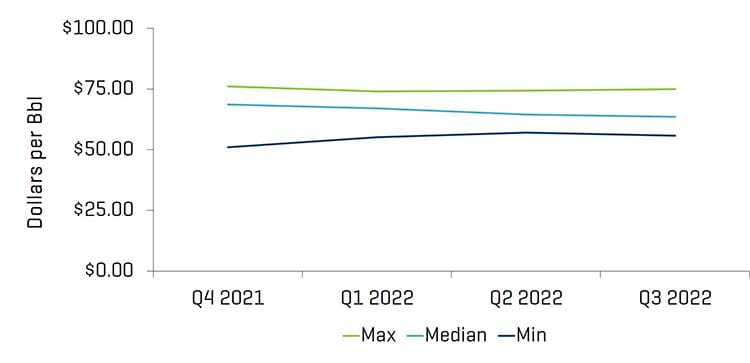
Source: Bloomberg, as of September 30, 2021
Total U.S. rig count (including offshore rigs) increased by 51 rigs, from 470 at the end of the second quarter to 521 rigs by the end of the third quarter (per Baker Hughes). Most regions saw increases in rig counts, with the Permian Basin (again) witnessing the largest gain, increasing from 236 to 260.
Historical U.S. Land Rig Count
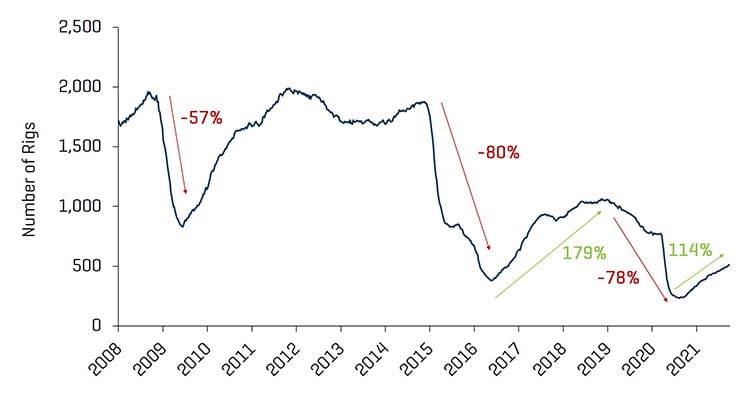
Source: Baker Hughes as of September 30, 2021
U.S Rig Count and Crude Oil [WTI] Prices
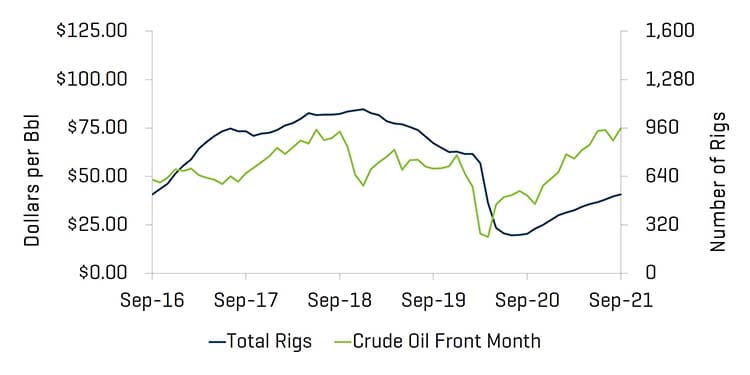
Source: Bloomberg, as of September 30, 2021 and Baker Hughes
Valuation Levels Decrease as the Crude Oil Supplies Rise and Well Drilling Declines
Overall, public valuations for energy service companies decreased during the quarter (as measured by the OSX), decreasing 14.4%. Overall, the sector underperformed the U.S. market, which was relatively stagnant (down 0.3% during the quarter).
Equity Index Performance - OSX
Source: S&P Capital IQ, Inc. as of September 30,2021
Equity Index Performance
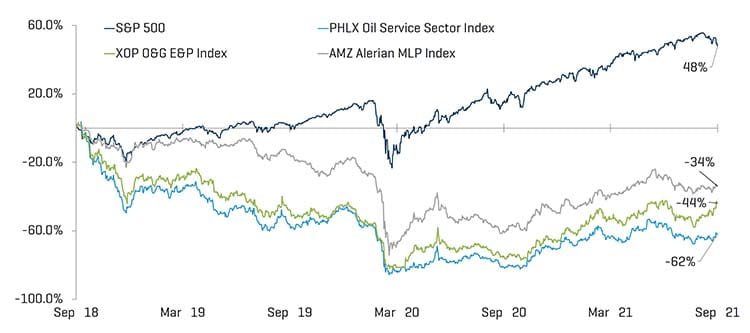
Source: S&P Capital IQ, Inc. as of September 30, 2021
RECENT M&A TRENDS
M&A Activity Witnessed Modest Improvement in Third Quarter of 2021 Though Still Weak
Energy service and equipment M&A activity increased by deal count and value in the third quarter of 2021, totaling 33 transactions and $750 million, up from 21 transactions and $125 million in the second quarter. The outlook for the remainder of 2021 and early 2022 M&A and financing activity in the Energy sector will likely improve as oil and natural gas demand continues to grow and substantially higher energy prices improve cash flow and balance sheets. Investors, as well as energy companies, remain cautious and continue to be focused on cash flow generation and potential distributions to investors (versus breakneck growth). In addition, many upstream producers have hedged production at lower prices, blunting some of the “upside” benefit of higher prices.
NAM Oilfield Services and Equipment Transactions
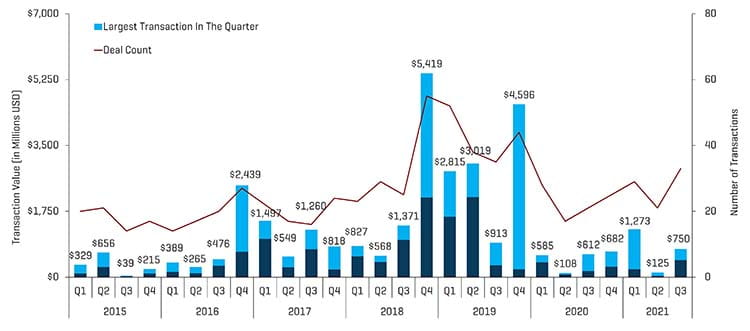
Source: 1Derrick, S&P Capital IQ, and proprietary information
Note: Q3 2015 excludes the Schlumberger/Cameron transaction value of $14.8 billion and Q4 2016 excludes the Baker Hughes/GE transaction value of $32.0 billion for scaling
Q3 2021 NAM Energy Services and Equipment Transaction Count By Sector
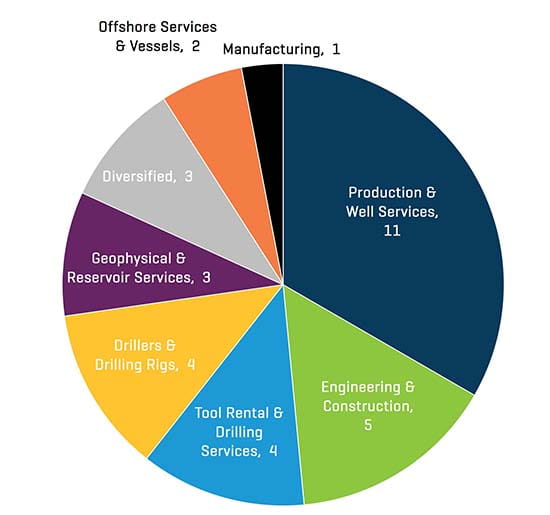
Source: 1Derrick, S&P Capital IQ, and proprietary information
Transactions in the third quarter of 2021 increased in quantity and in value. The majority of transactions in the third quarter were Production & Well Services businesses (11 transactions), which increased compared to the second quarter (8 transactions). However, there was greater diversity in overall numbers (nearly 2/3 of transactions were non-Production & Well Services).
Q3 2021 NAM Energy Services and Equipment Transaction Count by Buyer Profile
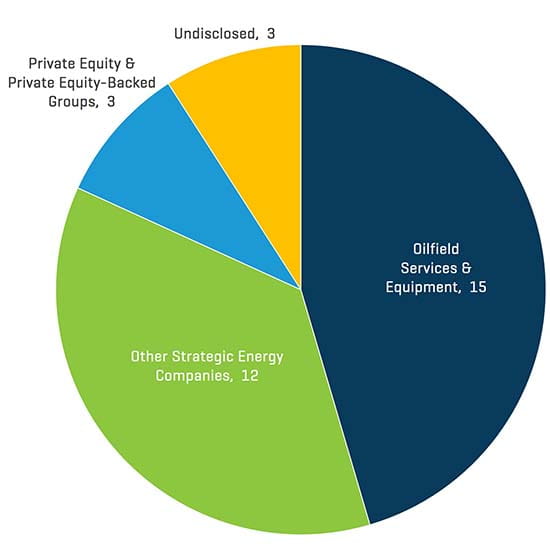
Source: 1Derrick, S&P Capital IQ, and proprietary information
Q3 2021 NAM Energy Service and Equipment Transaction Value by Buyer [Millions USD]
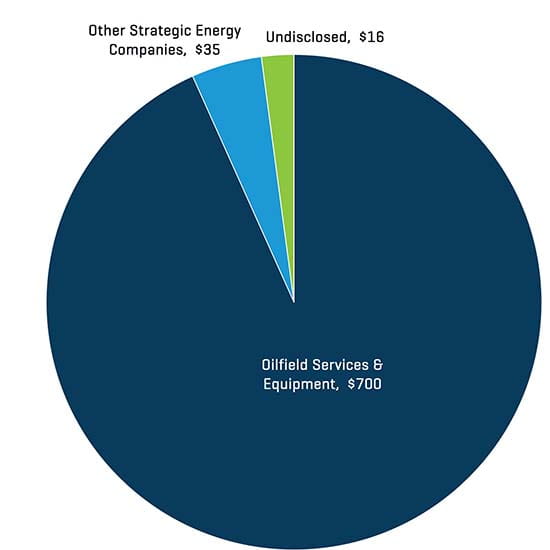
Source: 1Derrick, S&P Capital IQ, and proprietary information
Strategic acquirers continued to be more active than private equity and private equity-backed companies during the third quarter of 2021, representing 59.5% and 55.0% of all transactions by count and value, respectively. Overall, Oilfield Services & Equipment Companies accounted for the majority of M&A activity during the quarter (15 transactions).