English


The year’s initial quarter demonstrated continued improvement for many energy sector benchmarks. U.S. crude oil prices increased to $59.16 per barrel by March 31, a 22% gain from the end of 2020. WTI prices climbed steadily during the quarter, reaching more than $65 per barrel by early March, before settling into a trading range of high $50s to low $60s per barrel in the last few weeks of the quarter. Early optimism regarding economic recovery from the pandemic has been tempered with regional virus setbacks. The drilling rig count materially expanded during the quarter, continuing a positive trend that began in late summer 2020. The rig count increased 19% or by 66 rigs during the quarter (per Baker Hughes), which represented another strong quarterly rig count expansion (following stellar fourth-quarter 2020 rig count growth). Completion activity also substantially increased with the number of active frac spreads moving from approximately 130-135 spreads (fourth quarter of 2020) to more than 200 spreads in March 2021 (per Primary Vision). This period even included a wild stretch in mid-February when drilling and completion activity effectively stopped for seven to 10 days in Texas, Oklahoma, and other surrounding states due to historically cold weather. Natural gas was largely range bound during the period, closing the quarter at a similar level ($2.54 in the fourth quarter of 2020 compared with $2.61 in the first quarter of 2021), though spot prices in certain areas briefly exceeded $20.00 in mid-February due to the deep freeze in Texas.
According to the U.S. Energy Information Administration (EIA) U.S. crude oil production decreased from more than 11.1 million barrels per day in January 2021 to 10.8 million barrels per day in March 2021 (the most recent data available). The EIA anticipates U.S. crude production to modestly increase in the second quarter of 2021 due to lower 48 states’ increasing demand for hydrocarbon products resulting from accelerating COVID-19 vaccinations, which is anticipated to drive the global energy industry. After a flurry of Biden Administration executive orders at the beginning of his term, recent activity has been more muted as the focus shifted to COVID-19 relief and other priorities. The $2.3 trillion infrastructure plan proposed by the Biden Administration has some interesting components related to electric vehicles and mass transit which could have a long-term impact on U.S. hydrocarbon demand, but the timing, structure, and passage of this legislation is not certain.
Overall, bankruptcies decreased compared with the fourth quarter of 2020 as COVID-19’s impact subsides and oil prices continue to increase (yielding greater cash flow); however, many industry participants face upcoming debt maturities. Recent M&A activity within the energy service and equipment segment has been largely focused on production and well services.
Key Q1 Takeaways
- WTI prices rose steadily during the first quarter, closing up 22%
- Henry Hub prices opened and closed the volatile quarter around the same level
- North American (NAM) energy transaction activity remained at lower levels as companies remain inwardly focused
- The number of first quarter bankruptcies in the sector totaled 16, a material drop from prior quarters
- Public market energy company valuations have moved materially higher through the first quarter of 2021, tracking improved crude oil prices
Crude Oil and Natural Gas Prices Diverge During Quarter
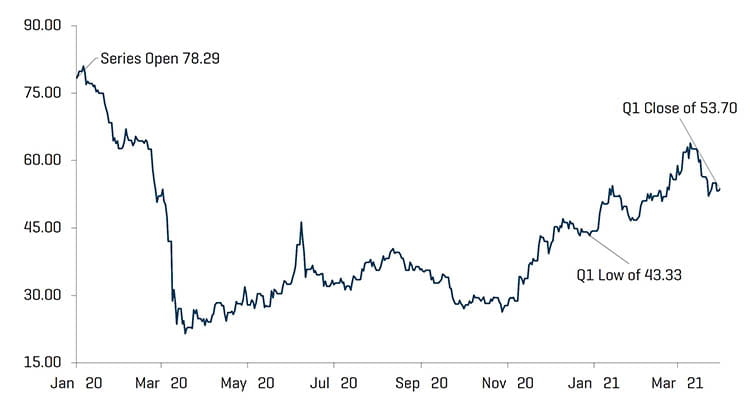
WTI crude front month oil prices closed the first quarter 22% higher than the fourth quarter, increasing from $48.52 per barrel to $59.16. Research analysts have forecasted median prices of $58.00 for both the second and third quarters of 2021. U.S. crude production is expected to remain between 10.3 million and 11.1 million barrels per day through 2021.
In the middle of February, natural gas prices experienced significantly increased daily price volatility due to the extreme weather in Texas, Oklahoma, and surrounding states. However, during the broader quarter, the net change in prices was near zero.
Crude Oil [WTI] Prices and Natural Gas [Henry Hub] Prices
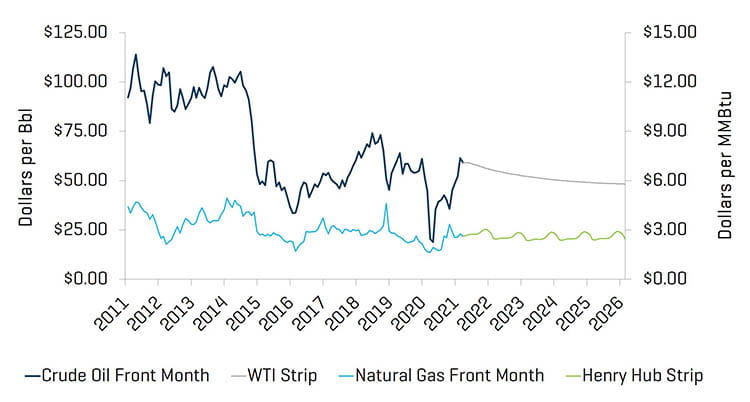
Source: Bloomberg, as of March 31, 2021
Research Analyst Crude Oil [WTI] Price Estimates
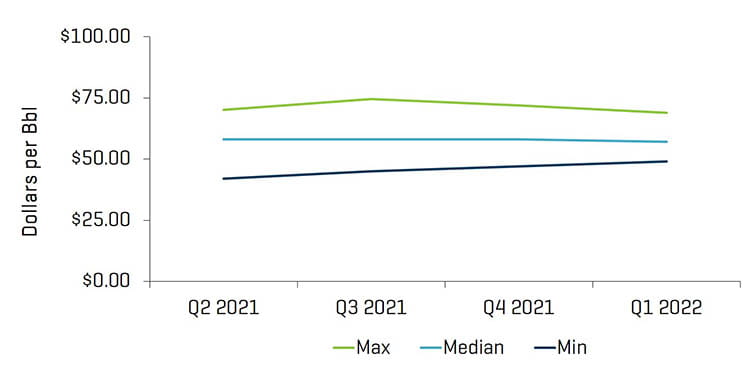
Source: Bloomberg, as of March 31, 2021
Note: Excludes estimates prior to October 13, 2020
Total U.S. rig count (including offshore rigs) increased by 66 rigs, from 351 at the end of the fourth quarter to 417 rigs by the end of the first quarter. Most regions saw increases in rig counts, most notably the Permian (increasing from 175 to 221).
Historical U.S. Land Rig Count
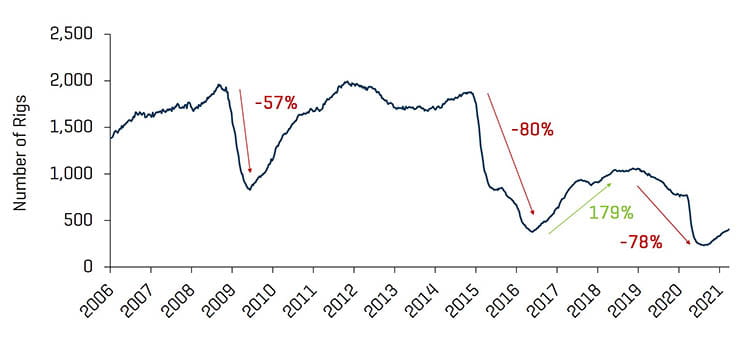
Source: Baker Hughes
Increase in U.S. Rig Count Since 2020 Trough
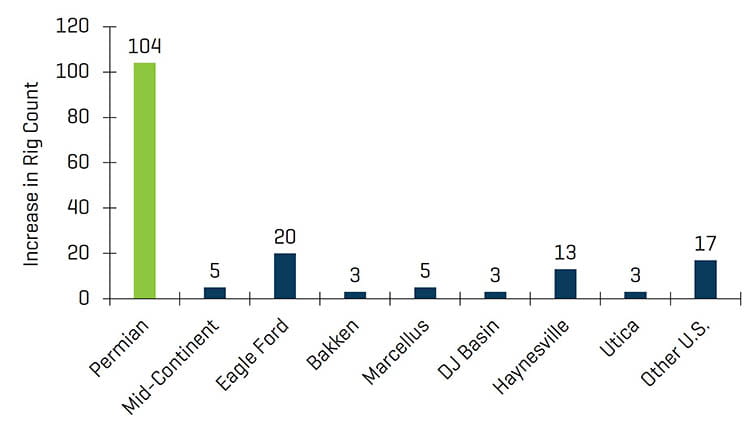
Source: Baker Hughes
U.S. Rig Count and Crude Oil [WTI] Prices
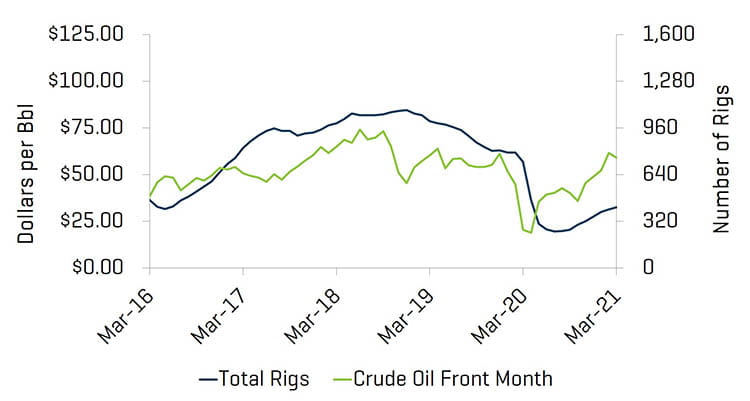
Source: Bloomberg, as of March 31, 2021 and Baker Hughes
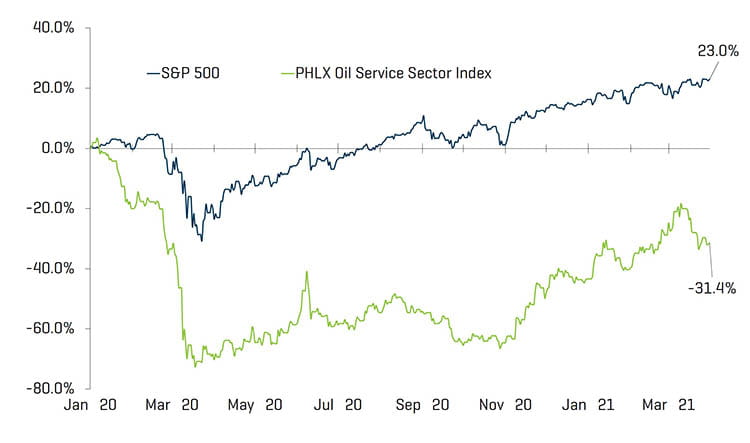
Valuation Levels Improve as Vaccines and Forecast Clarity Offer Hope
Overall, public valuations for energy service companies increased materially during the quarter, increasing 21.1%. Sector performance exceeded the overall U.S. market (up 5.8% during the quarter), as the impact of COVID-19 on global energy demand is improving.
Equity Index Performance - OSX
Source: S&P Capital IQ, Inc.
Equity Index Performance
Source: S&P Capital IQ, Inc.
As quarantine restrictions eased and prices have risen, the first quarter saw a decrease quarter over quarter in the number of bankruptcies within the energy industry. Exploration and Production companies represented the majority of filings during the quarter.
NORTH AMERICAN PRODUCER, MIDSTREAM, & OFS BANKRUPTCIES
Source: Haynes and Boone, LLP
Q1 2021 Energy Company Bankruptcies by Function
Source: Haynes and Boone, LLP
RECENT M&A TRENDS
M&A Activity Witnessed Modest Improvement Though Still Weak
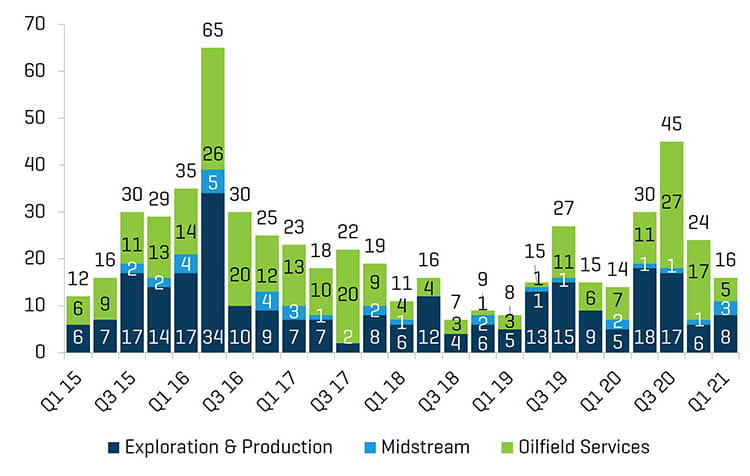
Energy service and equipment M&A activity increased by deal count and value in the first quarter of 2021, totaling 26 transactions and $1.3 billion, up from 25 transactions and $682 million in the fourth quarter of 2020. The outlook for the remainder of 2021 M&A and financing activity in the energy sector is likely to improve and accelerate as the global economy improves, oil demand recovers, and financing becomes more readily available.
NAM Oilfield Services and Equipment Transactions
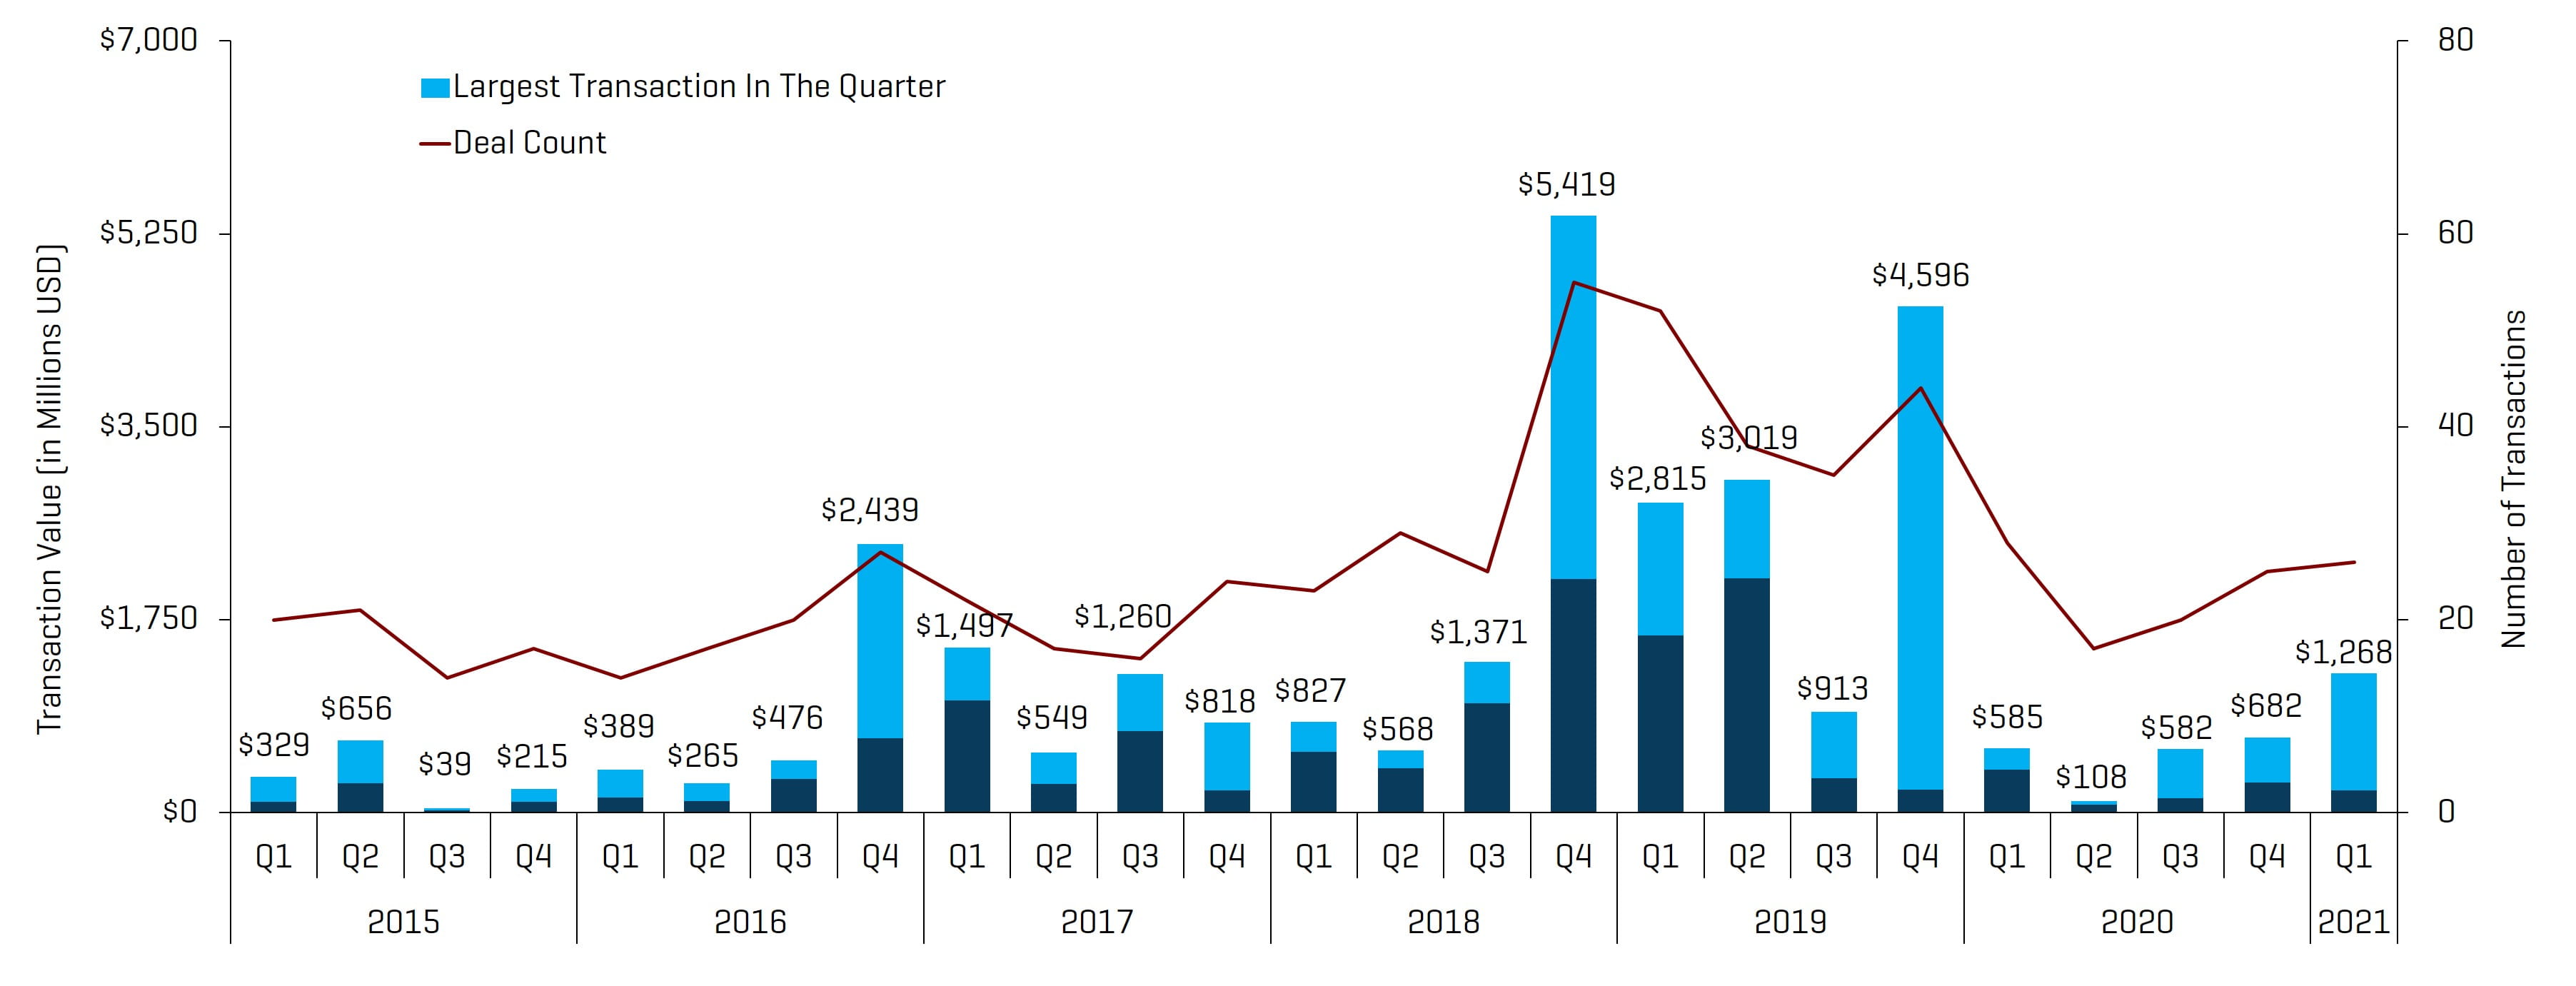
Source: 1Derrick, S&P Capital IQ, and proprietary information
Note: Q3 2015 excludes the Schlumberger/Cameron transaction value of $12.8 billion and Q4 2016 excludes the baker Hughes/GE transaction value of $32.0 billion for scaling
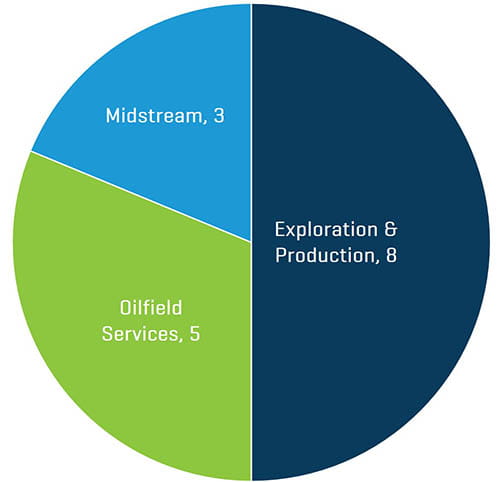
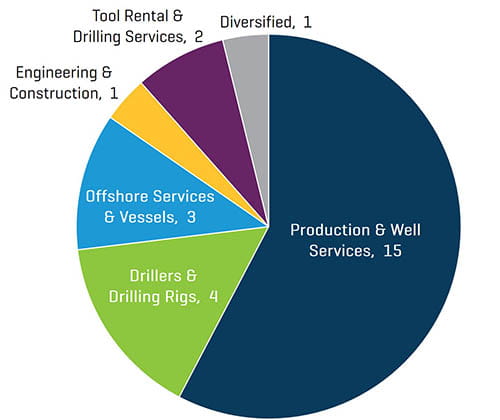
Q1 2021 NAM Energy Service and Equipment Transaction Count by Sector
Source: 1Derrick, S&P Capital IQ, and proprietary information
Transactions in the first quarter of 2021 increased in quantity and significantly increased in value. The majority of transactions in the first quarter were Production and Well Services businesses (15), which increased compared with the fourth quarter (10 total). Deal value in the first quarter was primarily driven by Tervita's merger with SECURE Energy Services (Production & Well Services).
Q1 2021 NAM Energy Service and Equipment Transaction Count by Buyer Profile
Source: 1Derrick, S&P Capital IQ, and proprietary information
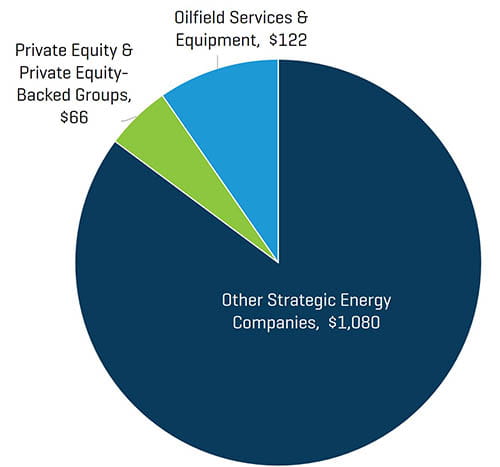
Q1 2021 NAM Energy Service and Equipment Transaction Value by Buyer Profile [Millions USD]
Source: 1Derrick, S&P Capital IQ, and proprietary information
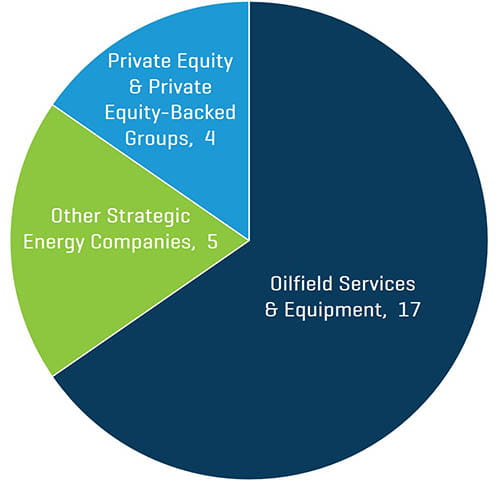
Strategic acquirers were significantly more active than private equity and private equity-backed companies during the first quarter of 2021, representing 85% and 95% of all transactions by count and value, respectively. Overall, Oilfield Services and Equipment firms accounted for the majority of M&A activity during the quarter (17 transactions).