English


The second quarter of 2021 revealed continued momentum for energy-sector benchmarks. U.S. crude oil prices increased 24.2% during the quarter to $73.47 per barrel by June 30th. WTI prices rose steadily through the quarter as strong economic activity and increasing travel drove hydrocarbon demand. The drilling rig count rose by 53 rigs (per Baker Hughes) during the second quarter of 2021, which represented another solid quarterly rig count expansion (driven primarily by private oil & gas companies) continuing the trend that began in Q3 2020. Completion activity continued to increase with the number of active frac spreads expanding from approximately 200 spreads in March 2021 to more than 230 spreads by the end of June 2021 (per Primary Vision). Natural gas prices also accelerated during the quarter, rising from $2.52 at the end of the first quarter to $3.65 by June 30th (representing a 44.8% increase). The natural gas pricing move has been driven by warmer weather, a meaningful increase in exports (via pipeline and LNG shipments), and recovering demand from the pandemic. Natural gas injections are well below their five-year averages, highlighting the current consumption and portending potentially higher prices during the 2021/2022 winter season.
U.S. crude oil production was roughly flat from March 2021 levels of 11.2 million barrels per day in April and May 2021 per the U.S. Energy Information Administration (“EIA”). The EIA anticipates U.S. crude production to remain consistent with these levels in Q3 2021 before increasing modestly in Q4 2021. The Biden Administration continues to press an aggressive environmental agenda including signing a bill repealing a Trump Administration rule regarding methane emissions. The bill is focused on capturing methane leaks from oil and gas wells which may hinder domestic activity and/or raise costs on wells to manage these requirements.
Overall, bankruptcies decreased compared to Q4 2021 as COVID-19 impacts continues to subside and oil prices further increase (yielding greater cash flow). Similar to previous quarters, recent M&A activity within the energy service and equipment segment has been largely focused on production and well services.
Key Q2 Takeaways:
- WTI prices rose rapidly during the second quarter, closing up 24.2%
- Henry Hub prices also rose steadily during the quarter
- North American (“NAM”) energy transaction activity remained at lower levels as companies remain inwardly focused
- The number of second quarter bankruptcies in the sector totaled 12, a slight drop from 16 in the first quarter
- Public market energy company valuations have moved higher through Q2 2021
Crude Oil and Natural Gas Prices Materially Increased During Quarter
WTI crude front month oil prices closed the second quarter 24.2% higher than the first quarter, increasing from $59.16 per barrel to $73.47. Research analysts have forecasted median prices of $67.00 and $66.51 for the third and fourth quarters of 2021, respectively. U.S. crude production is expected to remain between 11.2 and 11.4 million barrels per day through 2021.
Natural gas prices are expected to average $3.73 per MMBtu through the end of 2021. The EIA is forecasting natural gas production to remain relatively flat, increasing 0.6% from June to December 2021 to 101.1 BCF per day.
CRUDE OIL [WTI] PRICES AND NATURAL GAS [HENRY HUB] PRICES
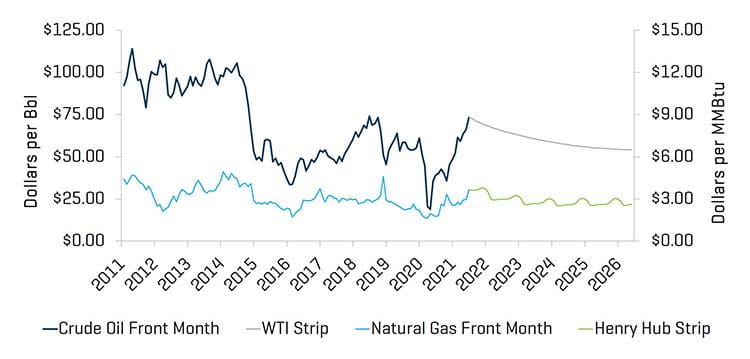
Source: Bloomberg; as of June 30, 2021
RESEARCH ANALYST CRUDE OIL [WTI] PRICE ESTIMATES
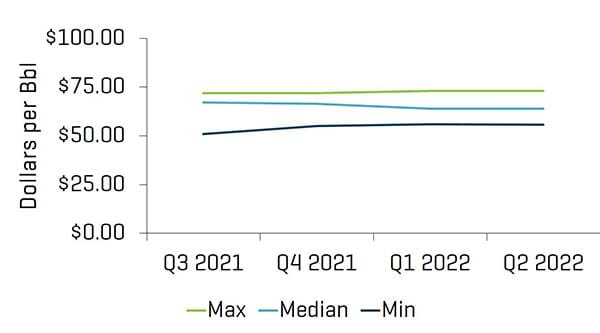
Source: Bloomberg; as of June 30, 2021
Total U.S. rig count (including offshore rigs) increased by 53 rigs, from 417 at the end of the first quarter to 470 rigs by the end of the second quarter. Most regions saw increases in rig counts, with the Permian witnessing the largest gain (increasing from 221 to 236).
HISTORICAL U.S. LAND RIG COUNT
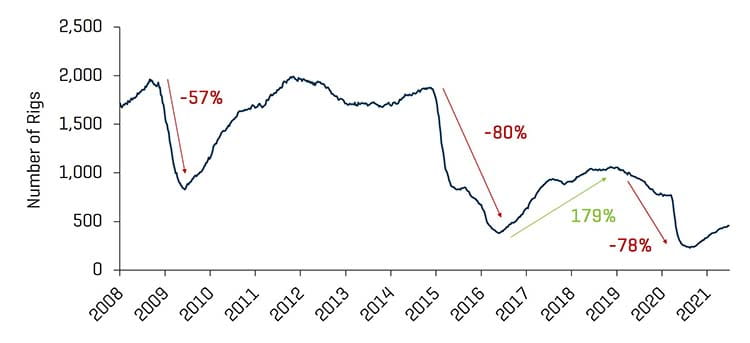
Source: Baker Hughes
U.S.RIG COUNT AND CRUDE OIL [WTI] PRICES
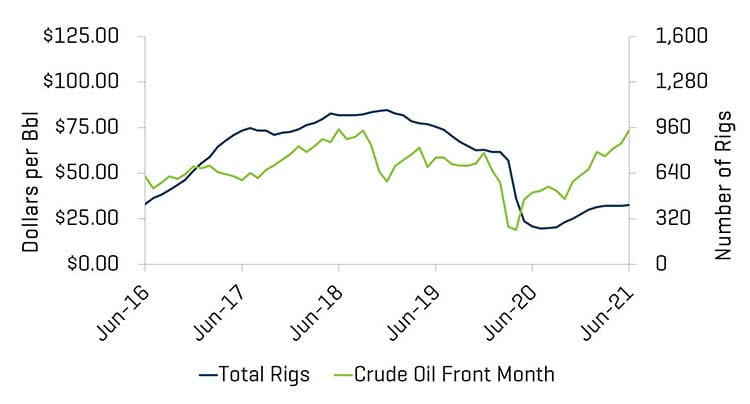
Source: Bloomberg, as of June 30, 2021 and Baker Hughes
Valuation Levels Improve as the Economy Accelerates
Overall, public valuations for energy service companies increased during the quarter (as measured by the OSX), rising 18.7%. Sector performance exceeded the overall U.S. market (which was up 8.2% during the quarter), as the economy materially improved driving current and anticipated energy demand.
EQUITY INDEX PERFORMANCE - OSX
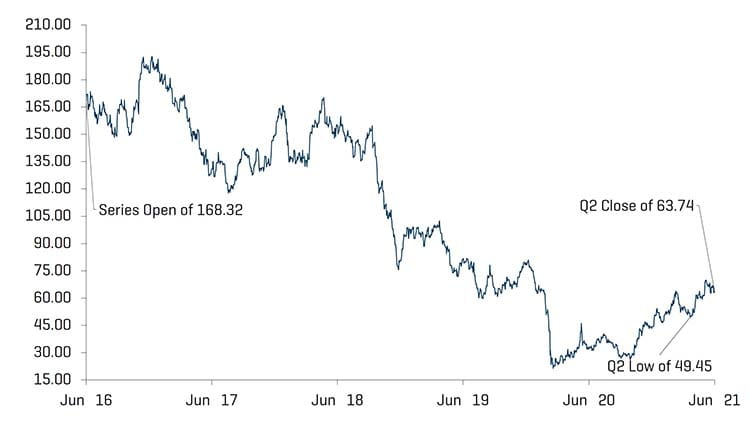
Source: S&P CapitalIQ, Inc.
EQUITY INDEX PERFORMANCE
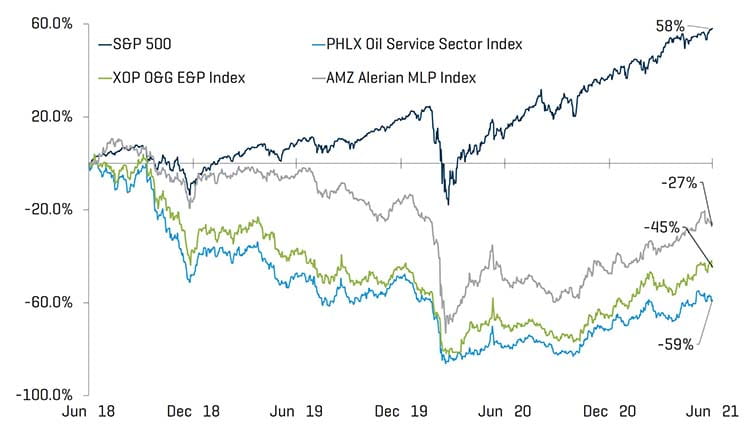
Source: S&P CapitalIQ, Inc.
The second quarter experienced a quarter over quarter decrease in the number of bankruptcies in the energy industry, largely as a result of quarantine restrictions easing, and improved hydrocarbon demand and pricing. The number of filings is now roughly in-line with pre-pandemic levels. Oilfield services companies represented the majority of filings during the quarter (8 total).
NORTH AMERICAN E&P, MIDSTREAM, & OFS BANKRUPTCIES
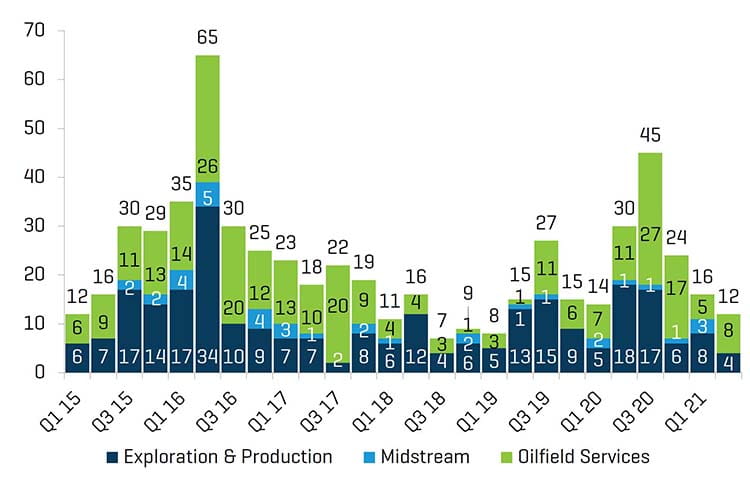
Source: Haynes & Boone, LLP
Q2 2021 ENERGY COMPANY BANKRUPTCIES BY FUNCTION
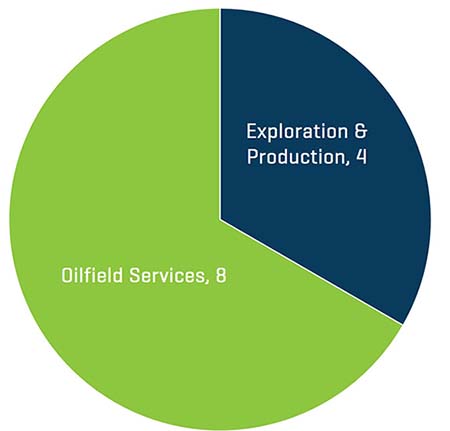
Source: Haynes & Boone, LLP
RECENT M&A TRENDS
M&A Activity Remains Weak
Energy service and equipment M&A activity decreased by deal count and value in the second quarter of 2021, totaling 21 transactions and $124.9 million, down from 29 transactions and $1.3 billion in the first quarter. The outlook for the remainder of 2021 M&A and financing activity in the Energy sector will likely improve as oil demand continues to recover and higher energy prices improve cash flow and balance sheets. Investors as well as energy companies continue to be cautious, however, and appear to be focused on cash flow generation and improving balance sheets.
NAM OILFIELD SERVICES AND EQUIPMENT TRANSACTIONS
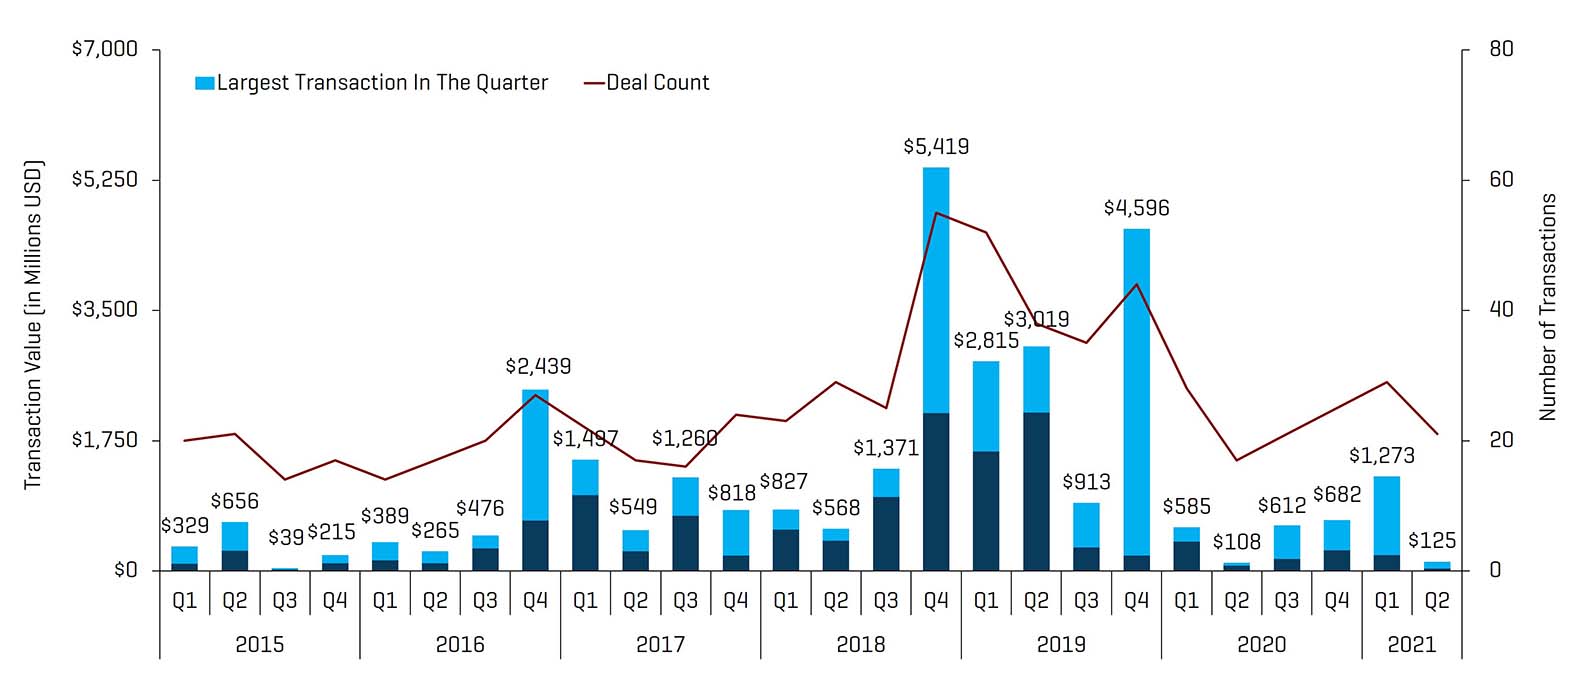
Source: 1Derrick, S&P Capital IQ, and proprietary information.
Note: Q3 2015 excludes the Schlumberger/Cameron transaction value of $14.8 billion and Q4 2016 excludes the Baker Hughes/GE transaction value of $32.0
Q2 2021 NAM ENERGY SERVICES AND EQUIPMENT TRANSACTION COUNT BY SECTOR
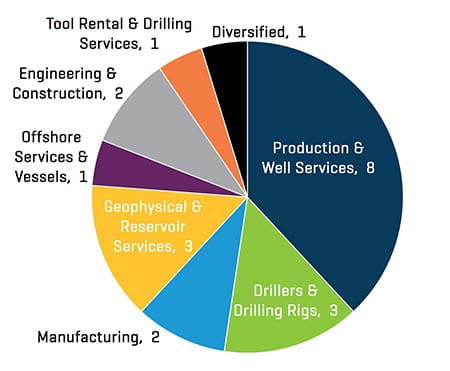
Source: 1Derrick, S&P Capital IQ, and proprietary information.
Transactions in the second quarter of 2021 decreased in quantity and decreased in value. The majority of transactions in the second quarter were Production & Well Services businesses (8 transactions), which decreased compared to the first quarter (17 transactions).
Q2 2021 NAM ENERGY SERVICE AND EQUIPMENT TRANSACTION COUNT BY BUYER PROFILE
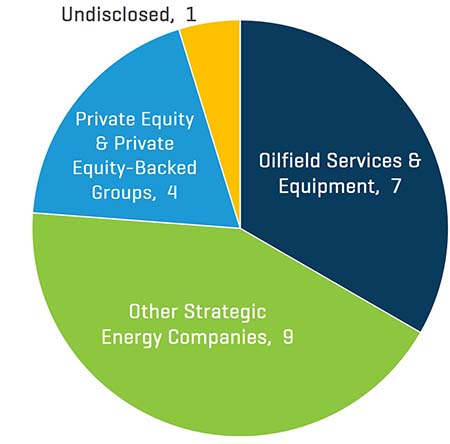
Source: 1Derrick, S&P Capital IQ, and proprietary information.
Q2 2021 NAM ENERGY SERVICE AND EQUIPMENT TRANSACTION VALUE BY BUYER PROFILE [MILLIONS USD]
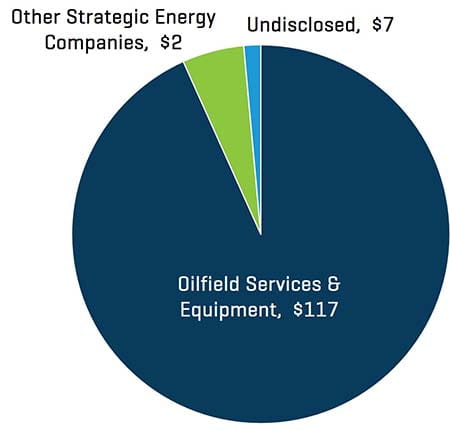
Source: 1Derrick, S&P Capital IQ, and proprietary information.
Strategic acquirers continued to be more active than private equity and private equity-backed companies during the second quarter of 2021, representing 76.2% and 94.7% of all transactions by count and value, respectively. Overall, Other Strategic Energy Companies firms accounted for the majority of M&A activity during the quarter (9 transactions).