English


Industry Overview
As of this writing, the S&P 500 has retraced its gains since the end of the 2018 third quarter. It is now trading where we started the year due to concerns about rising interest rates, trade-war rhetoric and, on some level, earnings reports. There is less visibility on the tax cut effect on sustained growth, but annualizing the cuts raises questions in our minds.
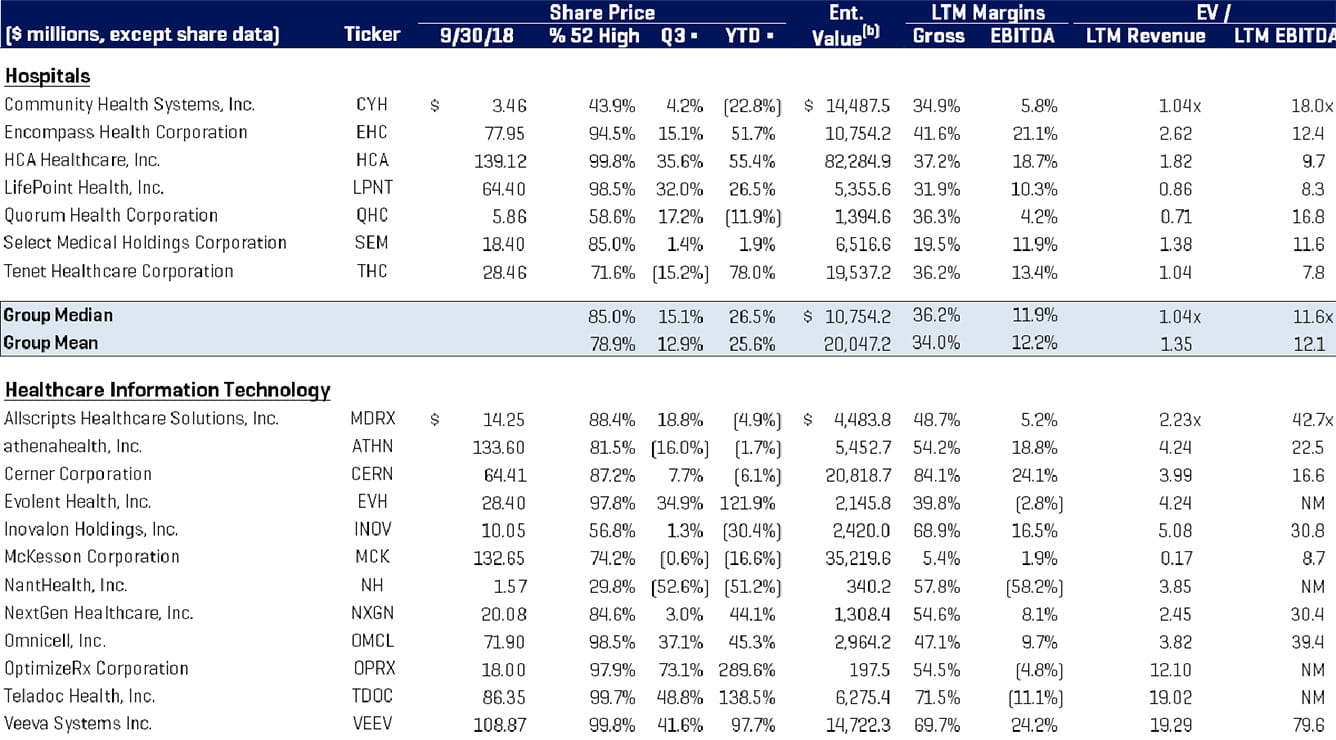
During the third quarter and year to date through September 28 (last trading day of the quarter), however, the S&P 500 was up 7.2% and 8.2%, respectively. Healthcare stocks that we track continued to outperform with a median stock price increase for the quarter and year to date of 9.0% and 12.4%, respectively.
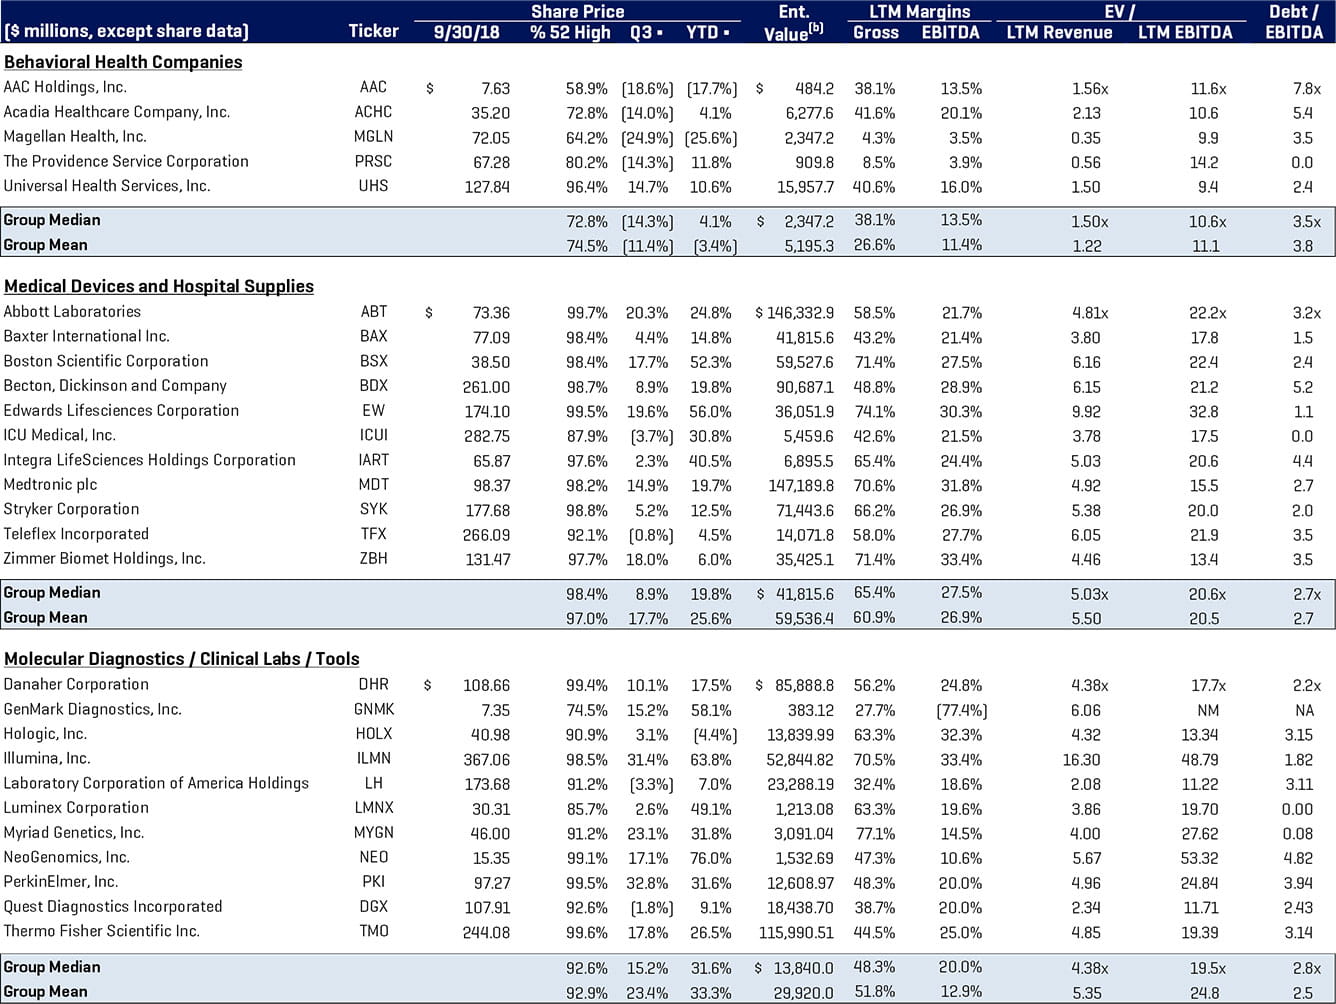
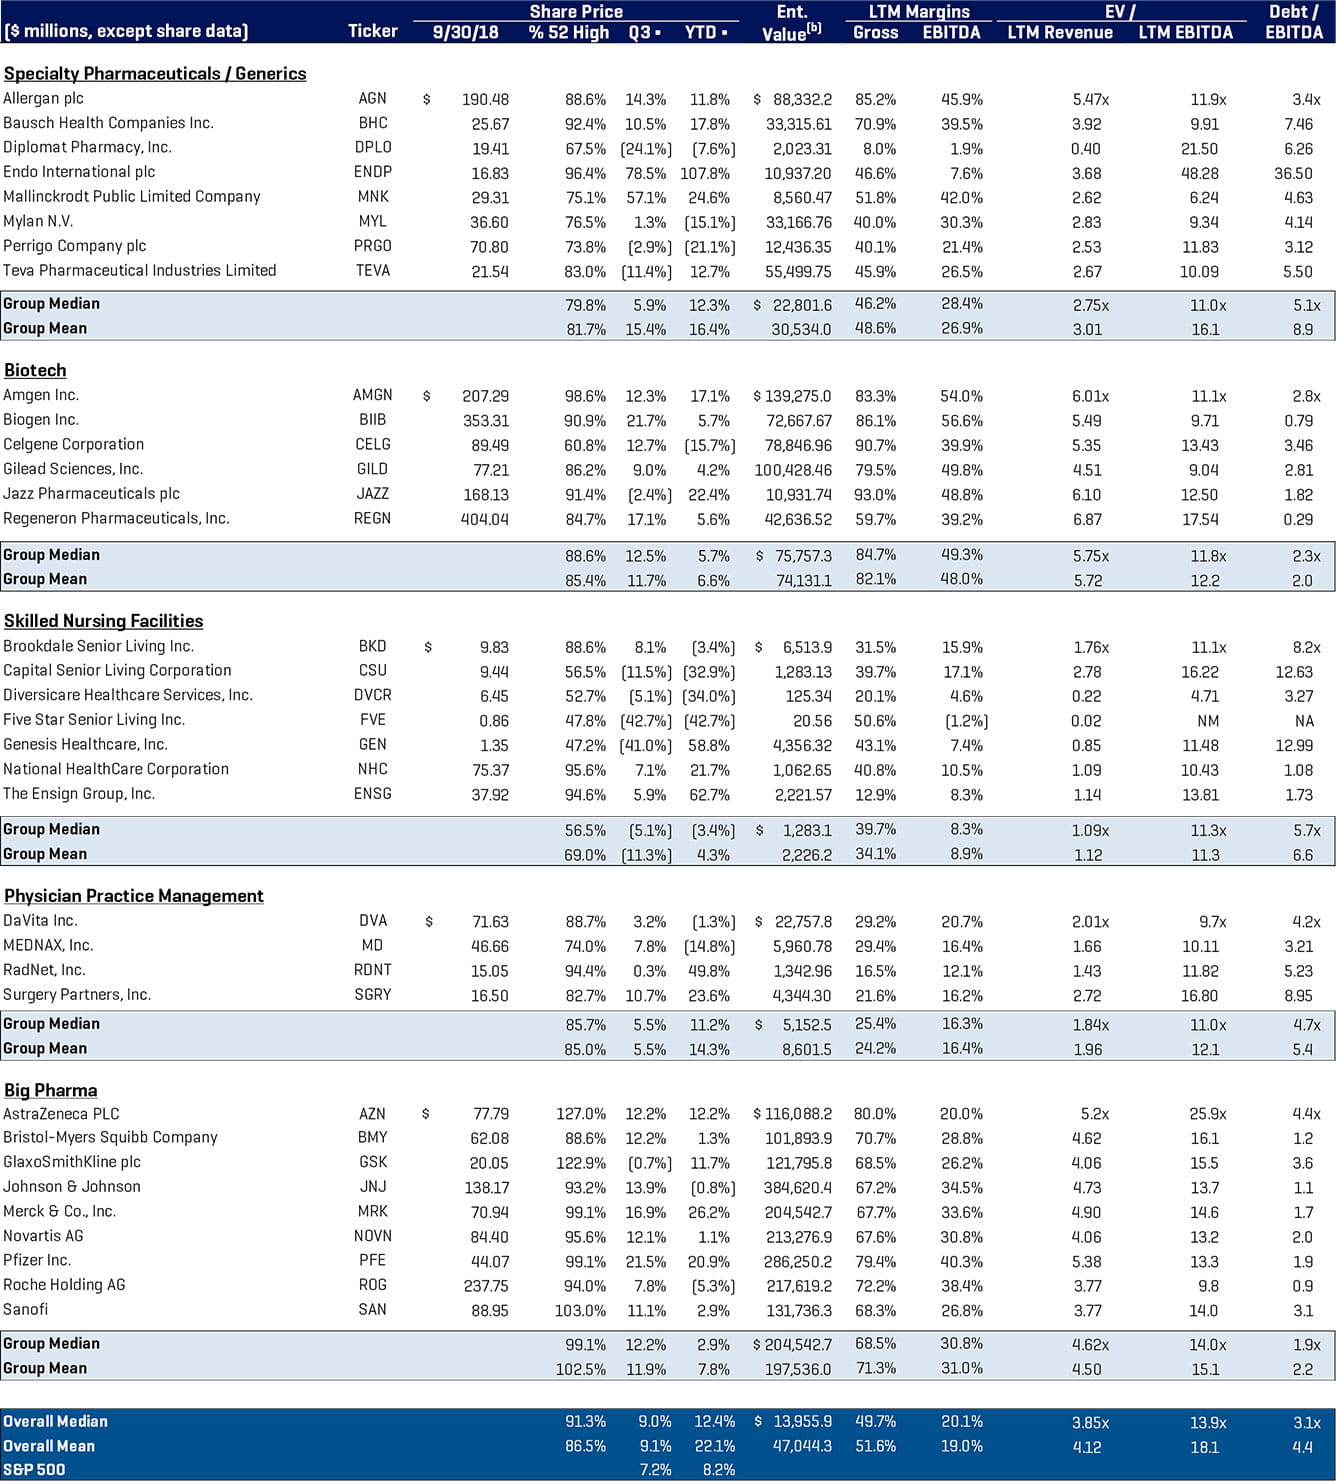
In the third quarter in particular, hospitals, healthcare information technology, molecular diagnostics and tools, biotech, and big pharma all outperformed, and segment medians were up 15.1%, 13.2%, 15.2%, 12.5%, and 12.2%, respectively. In fact, the only declining segments were behavioral health and skilled nursing facilities, whose group medians dropped 14.3% and 5.1%, respectively, for some of the reasons we discussed above. Biotech and big pharma had a nice rally in the quarter after underperforming in the first half on continued new drug development news in areas like immune-oncology and probably some diminished concern about the magnitude of drug price reforms and pipeline.
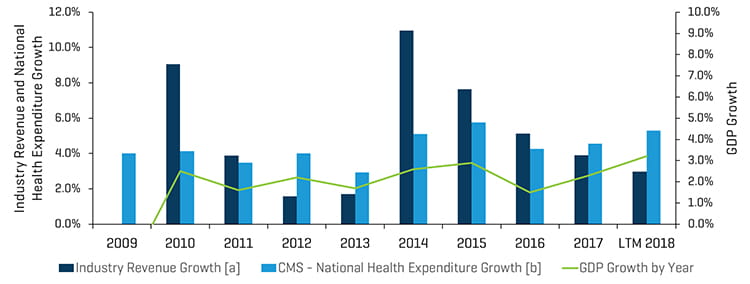
Historical Revenue Growth of Segments Monitored by Stout vs. Annual Health Expenditures and GDP Growth
Notes:
[a] For each period, total revenue figures are derived from the sum of all comparable companies listed in the appendix (Healthcare Public Company Analysis).
[b] CMS tracks National Health Expenditure Accounts (NHEA), which are the official estimates of total health care spending in the United States annually.
Source: www.cms.gov, Historical and Projected NHEA tables.
M&A Market Update
M&A Market Key Takeaways:
- Decreased aggregate deal value versus previous 2018 quarters and same quarter last year
- Highest deal volume quarter (383 transactions) since the first quarter of 2017 (402 transactions)
- Attractive valuation multiples due to continued demand from motivated PE and strategic buyers
- PE-backed physician practice management roll-ups strong as add-on acquisitions continue
- Behavioral health segment continues to lag amid a changing industry model
- Physician practice management, medical devices, and pharma / biotech lead deal volume
M&A Market Outlook
The number of healthcare M&A transactions announced and/or closed in the third quarter of 2018 was consistent with the high level of activity that has been prevailing since 2013 and prior. There were 383 transactions announced and/or closed in the quarter versus 369 in the year earlier quarter. Interestingly, third-quarter deal volume represents the highest level since the first quarter of 2017 (402 transactions). We would note that there were 59 physician practice management (PPM) deals in the 2018 third quarter versus 36 in the 2017 third quarter, so smaller add-on acquisitions for PE groups probably impacted overall deal value. There has also already been an enormous amount of consolidation among the largest industry players in most healthcare sub-sectors over the last several years.
The third quarter of 2018 experienced a significant decrease in M&A aggregate deal value compared with 2018’s previous two quarters and the comparable year earlier quarter. Aggregate deal value of $22 billion in the quarter dipped compared with $32 billion in the same period last year.
Despite the trend toward smaller deals in the quarter, there were several transactions with deal values greater than $1 billion. Motivated private equity and strategic buyers continue to drive demand and steep competition for transactions, and consequently, multiples across all segments remain high. Physician practice management, medical devices, and pharma/ biotech transactions led deal volume for the third quarter, with skilled nursing and healthcare information technology following closely behind.
Activity in the behavioral health segment (substance use disorders) has remained muted as the industry model is undergoing change that we have talked about in some of our recent publications, such as a movement to in-network, lower per diem rates, reduced payments of urinalysis, shorter lengths of stay and changing methodologies for customer acquisition. We see activity here picking up dramatically as these issues get sorted out, analytics and benchmarks are established for outcomes analysis, and the industry returns to normalized growth. Recent acquisition interest from PE seems to be focused on outpatient models.
Not surprisingly, hospitals are being impacted by the ongoing exodus of patients from the acute care setting and this segment, like behavioral health, has experienced M&A EBITDA multiple contraction. Hospitals, behavioral health, and specialty pharma are the segments commanding the lowest transaction multiples (9x-10x), and each of these areas are facing industry disruption and negative industry trends whether it be loss of customers to alternative settings or price/reimbursement contraction.
Medical devices, molecular diagnostics, and healthcare information technology all carry transaction multiples in the 18x-22x EBITDA range due to the industry growth, high margins, and proprietary nature (limited competition and patent protection, for example) of their businesses. While there were not a lot of large transactions during the quarter, there were a number of mid-sized deals in the medical devices segment. In total there were 53 medical device deals in the third quarter of 2018, flat versus the year earlier quarter. We would note that Platinum Equity closed the acquisition of Johnson & Johnson’s Lifescan Division just after the quarter close on October 1, 2018, for $2.1 billion, a seemingly attractive valuation given that the business generates $1.5 billion in revenue. We would note, however, that the emergence of Dexcom’s continuous glucose monitoring and Abbott’s Flash Libre devices represents a significant competitive threat to the traditional blood glucose meter and strip market as monitoring moves towards real time continuous methods. Many of the medical device deals in the quarter were small to mid-sized add-ons for companies like AngioDynamics, Becton Dickinson, Boston Scientific, Globus Medical, Hologic, Stryker, Thermo Fischer Scientific, and Wright Medical.
We believe we saw evidence this quarter that our thesis on physician practice management add-ons boosting total deal volume is playing out, and we expect that to continue with exciting opportunities in ophthalmology, dermatology, radiology, ortho-spine, urology, GI and other sub-specialties being rolled-up. We encourage physician groups to take advantage of this trend early as, at some point, the landscape will rationalize as PE-backed platforms begin to dominate state by state and then regionally, making it more difficult for new entrants to compete for business or deals. This will take time and multiples will likely remain high for another two years minimum, but it is a serious consideration. As mentioned previously, there were 59 acquisitions of physician practice management companies reported in the quarter, versus 36 in the year earlier quarter, with the preponderance of those deals being in ophthalmology, dermatology and dental as PE-backed groups like Epiphany Dermatology, Pinnacle Dermatology, Schweiger Dermatology, American Vision Partners, Envision Physician Services, Eye Health America, Eyecare Services Partners, and Western Dental Services continued to pursue add-ons. This high level of add-on activity certainly contributed to the large number of deals in healthcare overall, and we expect this to continue as a growing number of platforms emerge in these sub-specialties.
Q3 2018 M&A Transactions: Volume and Value
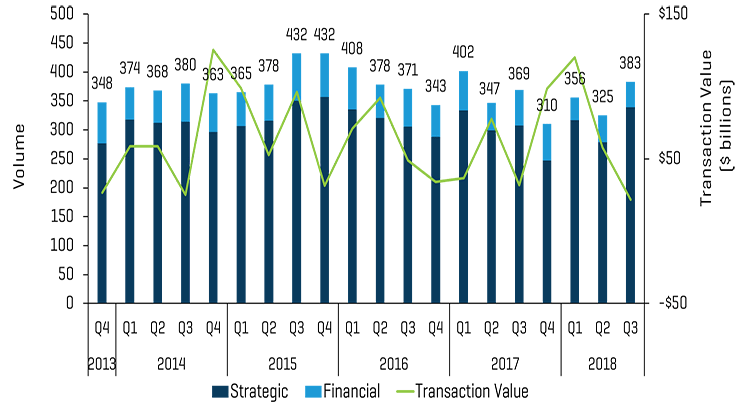
Source: Source: S&P Capital IQ and Stout Industry Research
Historical M&A Transactions: Announced Vs. Closed
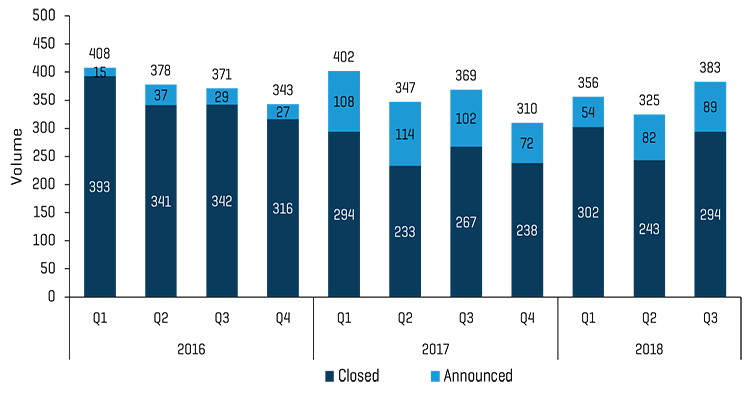
Source: S&P Capital IQ and Stout Industry Research
Q3 2018 M&A Transactions by Segment
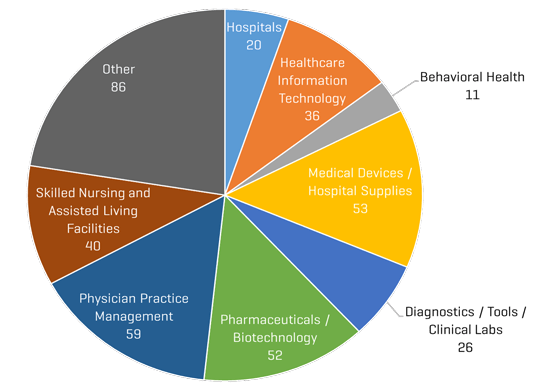
Source: S&P Capital IQ and Stout Industry Research
Q3 2017 M&A Transactions by Segment
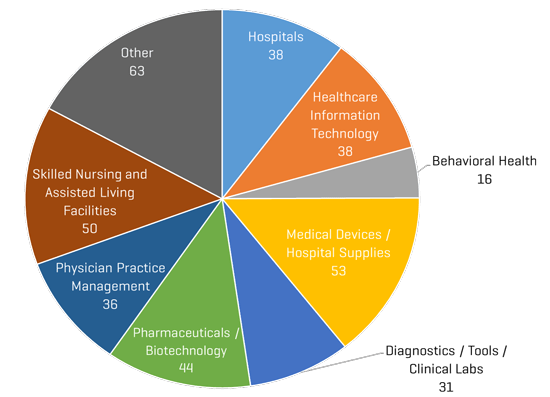
Source: S&P Capital IQ and Stout Industry Research
Public Comparable Companies: Historical EBITDA Multiples
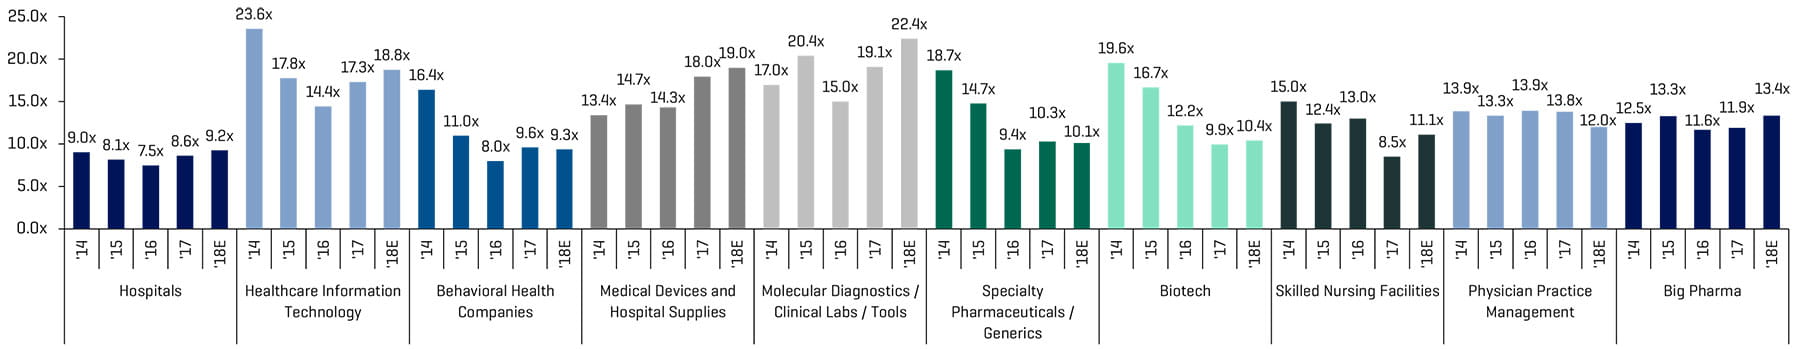
Source: S&P Capital IQ; Multiples calculated from comparable companies universe that Stout tracks
Notable M&A Transactions
Apollo Global Management-owned RCCH HealthCare Partners, an owner-operator of hospitals and clinics, announced its merger with LifePoint Health, Inc. (NASDAQ:LPNT), another hospital owner-operator, for approximately $5.6 billion, including $2.9 billion in net debt and minority interest.
Federal Street Acquisition Corp. (NASDAQ:FSAC), a special purpose acquisition company sponsored by an affiliate of Thomas H. Lee Partners, announced its merger with Universal Hospital Services, Inc., a leading, nationwide provider of healthcare technology management and service solutions and a portfolio company of Irving Place Capital Management. The purchase price for the acquisition implies an enterprise value for the combined company of approximately $1.7 billion.
K2M Group Holdings (NASDAQ:KTWO), a global leader of complex spine and minimally invasive solutions, announced a definitive agreement to be acquired by Stryker Corporation (NYSE:SYK), a leading medical technology company, for a transaction value of approximately $1.4 billion.
Alexion Pharmaceuticals, Inc. (NASDAQ:ALXN), a global biopharmaceutical company focused on rare diseases, announced its acquisition of Syntimmune, Inc., a clinical-stage biotechnology company that develops differentiated drug candidates for a wide range of autoimmune diseases, for a transaction value of approximately $1.2 billion ($400 million upfront cash payment with the future possibility of supplementary milestone-based payments of up to $800 million).
Technology retail and services giant Best Buy Co., Inc. (NYSE:BBY), announced a definitive agreement to acquire GTCR-owned GreatCall, Inc., a leading provider of connected health and personal emergency response services for active aging, for approximately $800 million in cash.
Global Payments Inc. (NYSE:GPN), a leading worldwide provider of payment technology and software solutions, announced a definitive agreement to acquire Marlin Equity Partners-backed AdvancedMD, Inc., a cloud-based software as a service (SaaS) provider to small-to-medium sized ambulatory physician practices in the United States. Global Payments is expected to pay approximately $700 million in cash for AdvancedMD.
Boston Scientific Corporation (NYSE:BSX), a global medical technology leader, announced its definitive agreement to acquire Augmenix, Inc., a privately-held developer of hydrogel technology products that decrease unintended radiation damage to normal organs during radiation therapy, for a transaction value of approximately $600 million ($500 million upfront cash payment with the future possibility of supplementary milestone-based payments of up to $100 million).
Agilent Technologies, Inc. (NYSE:A), a global leader in life sciences, diagnostics, and applied chemical markets, announced its definitive agreement to acquire ACEA Biosciences, Inc., a privately-owned developer of cutting-edge cell analysis instruments for life science research and clinical diagnostics, for approximately $250 million in cash.
Q3 2018 Largest M&A Transactions
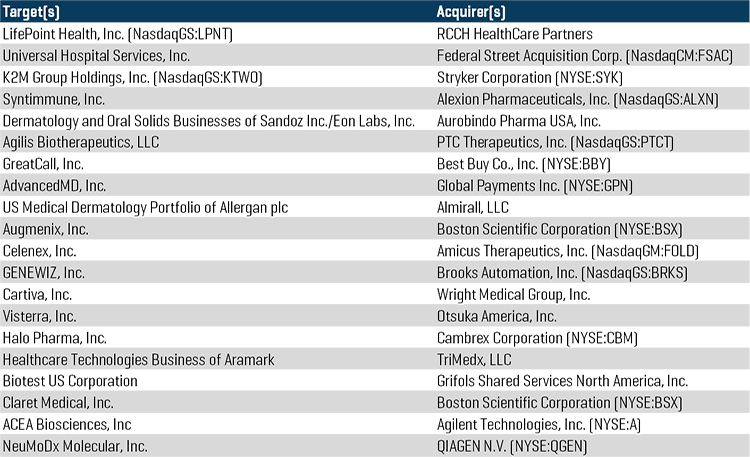
Source: S&P Capital IQ
Healthcare Public Company Analysis