English


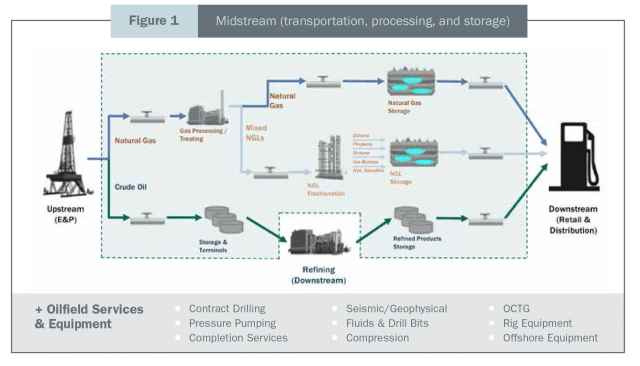
The oil and gas industry's value chain is classified into three distinct segments or sectors:
- Upstream (also known as exploration and production, or "E&P")
- Midstream
- Downstream
The oilfield services segment can also be considered a distinct segment, which serves the upstream oil and gas companies.
Three standard valuation approaches — the Income Approach, the Market Approach and the Asset Approach — typically are applied in valuing companies in the oil and gas industry. The first step in choosing the appropriate valuation approach is to understand the sector of the value chain in which the subject company operates. For each sector, certain considerations must be taken into account.
Upstream
The upstream sector, commonly referred to as the E&P sector, participates in the search for and the recovery and production of crude oil and natural gas. Activities within the upstream sector include searching for potential underground or underwater oil and gas fields, drilling exploratory wells, and drilling and operating wells that recover and bring to the surface crude oil, natural gas and related liquids. Examples of global E&P companies include Exxon Mobil Corporation, Royal Dutch Shell plc, and BP plc.
Midstream
The midstream sector starts at the gathering system, which collects oil and gas from the wellheads. Gathering systems range in size from small systems that process gas close to the wellhead, to large systems consisting of thousands of miles of pipes that collect from hundreds of wells. At the processing plant, various products (for example, natural gas liquids like ethane and butane) are separated from the oil and gas. Examples of large midstream companies include Enterprise Products Partners L.P., Kinder Morgan Inc., and TransCanada Corporation.
Downstream
Companies in the downstream sector are involved in refining crude oil and in selling and distributing natural gas and crude oil derived products such as liquefied petroleum gas, gasoline/petrol, jet fuel, diesel oil, other fuel oils, asphalt, and petroleum coke. The downstream sector includes refineries, petrochemical plants, petroleum product distribution companies, retail outlets, and natural gas distribution companies. Examples of large downstream companies include Valero Energy Corporation, Sunoco Inc., and Citgo Petroleum Corporation.
Oilfield Services
Oilfield services companies are important industry players that provide support services — drilling, cementing, surveying, treating (e.g., with acids or chemicals), and perforating — to upstream oil and gas producers on a fee or contract basis. An increasingly popular way in recent years for companies to extract oil and gas from shale formations, such as the Permian Basin in West Texas, the Bakken Formation in North Dakota, and the Eagle Ford in South Texas, is hydraulic fracturing, or “fracking”. Creating fractures in formations that allow oil and gas to be released. Examples of large oilfield services companies include Halliburton Company, Schlumberger Limited, and National Oilwell Varco.
Upstream Valuation Considerations
E&P companies’ primary assets are their oil and gas reserves — that is, hydrocarbons below the surface that have not yet been produced and are economically viable to extract. Reserves can be classified into two main categories: proved and unproved reserves. Proved reserves are quantities (volumes) of oil or natural gas that are recoverable in future years from known reservoirs under existing economic and operating conditions. Within the category of unproved reserves, probable reserves (referred to as 2P reserves when aggregated with proved reserves) have a 50% probability that reserve quantities will be higher than estimated and a 50% probability that the reserves quantities will be lower than estimated, in accordance with the engineering definition of the American Petroleum Institute. Possible reserves (referred to as 3P reserves when aggregated with proved and probable reserves) have a 10% probability that reserves quantities are higher than estimated and a 90% probability that reserves quantities will be lower than estimated.
Reserve Reports and Reserve Valuation: The value of an E&P company may be estimated by calculating the fair value of its reserves and then aggregating this with the value of other net assets on its balance sheet, assuming those net assets have been assigned market value. Reserve reports, generally prepared independently by petroleum (or reserve) engineers, are used for this purpose. These reports provide the gross quantities expected from wells, net such quantities to the subject company’s ownership interest, and estimate future prices, operating expenses and capital expenditures. Essentially, a reserve report is a discounted cash flow (“DCF”) model for a company’s reserves, on a pre-income tax basis, and it typically includes the present value of the projected income based on various benchmark rates, frequently ranging from 10% to 25%.
Below is a list of key items to consider in reviewing a reserve report and its underlying assumptions:
- What price deck (commodity price forecast) was used for the reserve report? (Note that engineers do not typically build the effect of hedges or other derivatives into their DCF model. The projections may be aggressive if the NYMEX strip pricing is significantly lower than the oil and gas prices used in the reserve report.)
- How do the projected volumes compare with historical production volumes? If they are materially different, determine why this is the case.
- Are proved undeveloped reserves (“PUDs”) included in the analysis? Are probable and possible reserves included in the projections? What drilling and capital expenditure assumptions were used in developing the projections associated with the PUDs?
- Were plug and abandonment costs considered? Liabilities related to plug and abandonment costs are also referred to as asset retirement obligations.
Valuing E&P Companies: E&P companies are commodity businesses that have limited control over the prices they receive. They may vary their production and capital expenditures based on current and future price expectations, and they can hedge their production by using the futures market. As discussed earlier, the DCF method under the Income Approach is one of the primary approaches used to value an E&P company’s oil and gas reserves. The value of the reserves is incorporated into the Asset Approach and the E&P firm’s balance sheet is marked to market using the Net Asset Value Method.
The Market Approach may also be an appropriate method of valuing an E&P company, depending on the availability of comparable publicly traded companies or M&A transactions (at either the asset level or the entity level). When analyzing historical or projected financial metrics to use in the Market Approach, consideration should be given to some unique aspects related to the accounting of E&P companies. Financial statements of E&P companies prepared in accordance with generally accepted accounting principles (“GAAP”) may use either successful efforts or full-cost accounting for oil and gas reserves. These accounting methods differ in their treatment of specific operating expenses — namely, exploration costs related to carrying and retaining undeveloped properties, collecting and analyzing geophysical and seismic data, and drilling exploratory wells. Rather than considering EBITDA (earnings before interest, taxes, depreciation and amortization) as a primary pricing metric for E&P companies, analysts usually consider EBITDAX, which is a company’s EBITDA before exploration costs for successful efforts. For full-cost firms, exploration costs are embedded in depreciation and depletion, so EBITDAX equalizes both accounting types.
The first step in employing the Market Approach is the selection of appropriate guideline companies. Some of the important screening criteria are the following:
- Size (in market capitalization or reserve volumes)
- Gas/oil mix (the percentage of reserves or production represented by natural gas versus oil)
- Reserve life (proved reserves divided by the previous year’s or current year’s production; also known as the reserves-to-production, or “R/P,” ratio)
- The ratio of PUDs to total proved reserves (an indicator of how much of the reserve base is currently generating EBITDAX)
- Areas/basins of operation (e.g., onshore versus offshore activities; specific geographies or shale plays)
Once guideline companies have been selected, the following pricing metrics may be considered:
- Enterprise Value (“EV”) / proved reserve quantities (i.e., EV / barrels of oil equivalent, or “BOE”)
- EV / daily production
- EV / EBITDAX
Due to the frequency of reserve acquisitions and divestitures among the publicly traded E&P companies, which could distort valuation indications, a forward- or current-year indication of reserves, production, and EBITDAX should be used. The development of forward- or current-year metrics, however, often requires a time-consuming review of press releases and other sources of information.
Midstream Valuation Considerations
Conventional variations of the Income and Market approaches (e.g., DCF and EBITDA-based multiples) may be appropriate in valuing midstream E&P companies, which are frequently incorporated as master limited partnerships (“MLPs”).
An MLP is a limited partnership that is publicly traded on a stock exchange qualifying under Section 7704 of the Internal Revenue Code. It combines the tax benefits of a limited partnership with the liquidity of publicly traded securities. MLPs traditionally pay out almost all available cash flow on a regular basis. They generally offer higher yields, stemming from their legal and tax structures as well as from the underlying companies’ operating business. Most publicly traded companies are structured as C corporations that pay entity-level corporate taxes, but MLPs pass through their taxable income to their unit holders rather than incur taxes at the entity level. As a result — and in contrast to C corporations, which must pay corporate income taxes, and whose shareholders are subject to taxes on any dividends received — MLPs avoid double taxation and offer higher distributions and yields to investors. Traditionally, MLPs have provided distribution growth by increasing the volume of products processed on existing assets, reducing costs through improved operations and scale, making accretive acquisitions, developing new assets, and capitalizing on new trends.
To obtain the tax benefits of a pass-through entity, MLPs must receive their income from qualifying sources, such as the exploration, mining, extraction, transportation, storage, distribution, and refining of oil and gas, and the production of alternative fuels such as biodiesel. To qualify for MLP status, a partnership must generate at least 90% of its income from what the Internal Revenue Service deems “qualifying” sources. The vast majority of MLPs are pipeline businesses, which generally earn stable income from the transport of oil, gasoline or natural gas. More specifically, energy MLPs are defined as those that own energy infrastructure — including pipelines, storage, terminals, or processing plants for natural gas, gasoline or oil — in the United States. MLPs frequently acquire assets used in the midstream segment, and their access to capital markets and low costs of capital on a pretax basis create a compelling valuation proposition in the transaction markets. Energy MLPs’ available yields make them an actively sought-out investment option in a low interest rate environment.
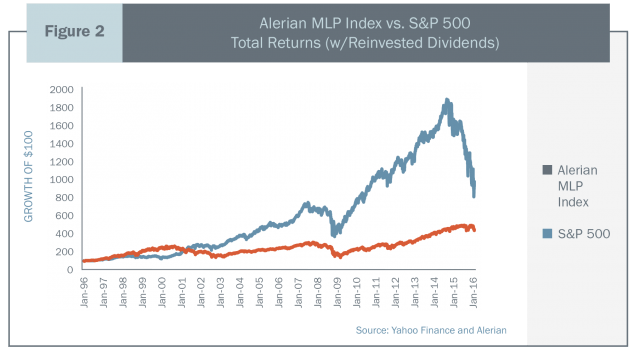
As such, in evaluating valuations for midstream companies, consideration should be given to yield data and trends for the subject company. Amid the current downturn in oil and gas commodity prices and the decline of the industry overall, midstream public companies’ yields have increased, but these higher yields are due primarily to lower valuations rather than to growth in distributions.
Downstream and Oilfield Services Valuation Considerations
Conventional variations of the Income and Market approaches (e.g., DCF and EBITDA-based multiples) may be appropriate in valuing downstream companies. Although lower oil and gas commodity prices adversely impact the valuation of E&P companies, the valuation of downstream companies, such as refiners, often benefits from lower prices of the commodity feedstock. The crude oil that E&P companies produce serves as a primary feedstock for downstream companies, and lower feedstock prices may result in higher crack spreads for downstream companies. Crack spread is the differential between the price of crude oil and the price of petroleum products extracted from it — that is, the profit margin a refinery can expect when it “cracks” crude oil. As a result, in the current oil and gas industry environment, downstream companies are expected to benefit from higher crack spreads in the near term, thus increasing their valuations. Another important factor affecting the crack spread is the relative proportion of various petroleum products produced by a refinery. The mix of refined products is also affected by the blend of crude oil feedstock processed by a refinery. Heavier crude oils are more difficult to refine into lighter products such as gasoline.
As with downstream companies, conventional variations of the Income and Market approaches (e.g., DCF and EBITDA-based multiples) may be used to value oilfield services companies. As with E&P companies, lower oil and gas commodity prices decrease oilfield services companies’ valuations. In an environment of lower commodity prices, such as the one we are currently experiencing, E&P companies significantly cut their capital expenditure budgets related to exploring and producing oil and gas. These budget reductions directly impact clients’ demand for an oilfield services company’s products. Although volatility in commodity prices affects oilfield services companies’ valuations in general, certain oilfield services companies may suffer more than others due to reductions in E&P capital expenditure budgets.
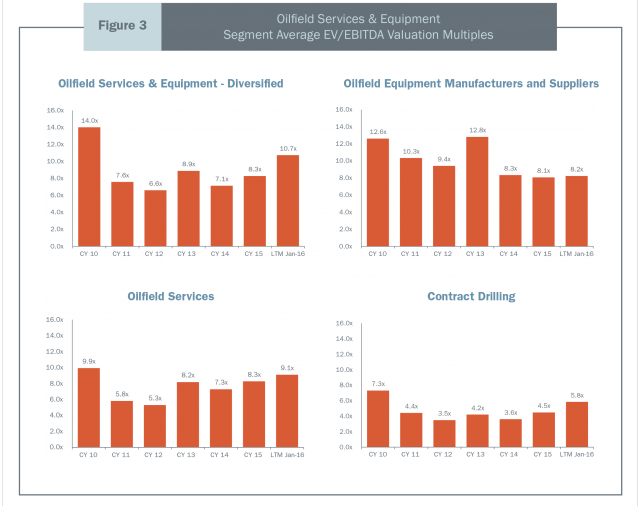
Figure 3 presents the variations in EBITDA valuation multiples for the different types of oilfield services companies.
Summary
Although the three standard valuation approaches — Income, Market and Asset — are applicable for companies in the oil and gas industry, each segment within the industry value chain has its own unique operations and characteristics, making certain approaches and methodologies for the valuation of these businesses more appropriate than others. In addition, modifications to the methodologies and certain commonly applied valuation metrics are required, depending on where in the oil and gas industry value chain the company operates.