English


Executive Summary
This article explains, in practical terms, the limitations of PV-10 as a measure of market values and outlines the key adjustments that legal and accounting professionals, as well as investors, must consider.
While PV-10 values derived from reserve reports in the upstream hydrocarbon space serve as a useful regulatory baseline, most market participants concede that PV-10 falls well short of fair value or fair market value indications that investors would expect to accrue within the context of a transaction.
Introduction
PV-10, or “present value at 10%,” is a discounted cash flow (DCF) metric used to estimate the present worth of projected future cash flows from oil and gas reserves. The Securities and Exchange Commission (SEC) mandates that publicly traded oil and gas companies disclose PV-10 values in their annual Form 10-K filings. This standardization aims to facilitate comparability across companies.
However, PV-10 has limitations that often prevent it from representing the value that investors would expect to receive or pay within the context of a transfer of assets or liabilities or the valuation mark that they would need to compute for determining the value of their privately held securities.
The conventional pricing methodology applied in a standard SEC reserve report utilizes the observed oil, gas, and/or natural gas liquids (NGLs) price on the first business day of each month for the preceding twelve months from the observation or reserve reporting date. The historical pricing assessment is then used to estimate the total volume of barrels of oil equivalent (BOE) that could be economically produced in that pricing scenario.
The SEC reserve report then deducts all observed direct expenses (operating expenses, capitalized expenditures, and asset retirement obligations) and translates these future cash flows into their present value equivalent with a fixed 10% annual discount rate (regardless of the asset’s development risk).
While these parameters can assist with comparability in standard SEC reporting terms, they do not specifically reflect a typical market participant’s direct proxy / assessment for market value.
What Is Reflected in a Reserve Report? (and Why It Matters for Legal and Financial Decisions)
Reserve reports estimate future oil and gas production, costs, severance and ad valorem taxes, and capital expenditures.
Key Components of a Reserve Report
Sources of Funds
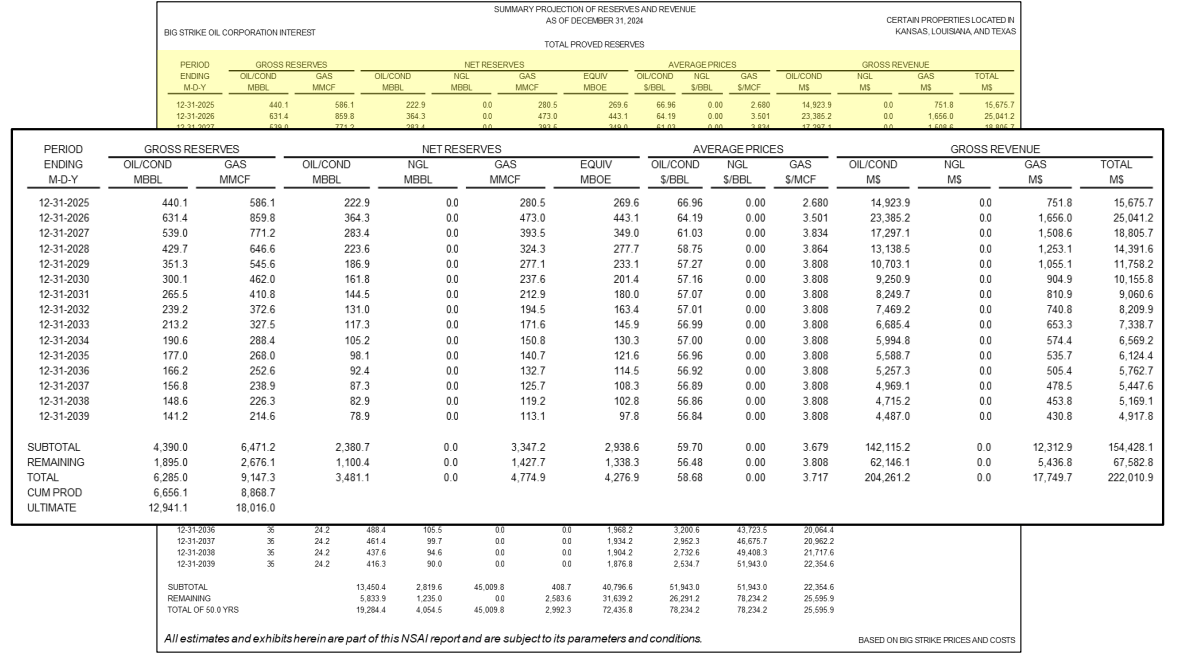
The graphic below, provided by Netherland Sewell & Associates, Inc.,1 shows the expected future sales in a reserve report. Sales are the product of future hydrocarbon volumes multiplied by future prices.
Uses of Funds
Expected uses of funds shown in a reserve report covers both operating expenses and non-income taxes as well as capital expenditures to drill new wells and to deal with the asset retirement obligations at the end of the well’s economic life.
The resulting net cash flows from the assets being considered are shown on both as nominal cash flows in each year, as well as their present values.
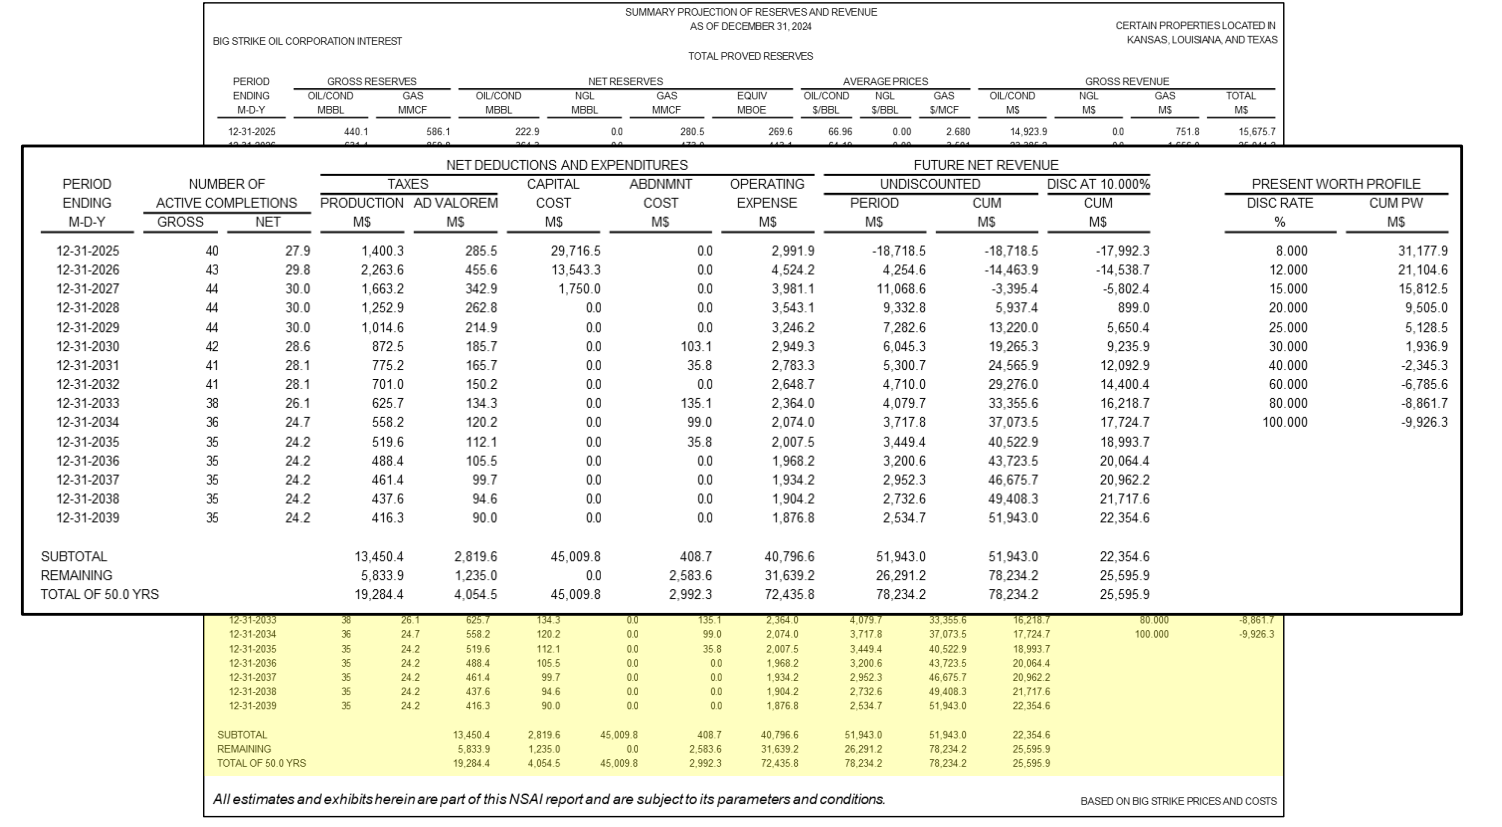
These reserve reports are developed using software programs such as Aries2 and PHDwin.3
What is not reflected in most reserve reports are:
- Federal and state income tax expenses
- Corporate overhead expenses
- The impact of risk on the reserve’s market values
Categories of Reserves
A PV-10 reserve report treats all types of reserves equally, ignoring their relative risks. In contrast, FMV and FV valuations differentiate reserve types based on their relative risks.
Accounting for Risk: Risk-Adjusted Discount Rates

Lower risk categories are for wells that have already been drilled and completed. As shown, proved developed producing reserves (PDP) have the least risk and therefore require a lower discount rate or present value factor. Next shown are proved developed non-producing reserves (PDNP), reflecting wells that have been drilled and completed but are currently shut in and not producing.
Future wells, not yet drilled and completed, make up the next groups. Proved undeveloped reserves (PUDs) hold proven reserves that are expected to be recovered through either newly drilled wells on undrilled acreage or from existing wells requiring a relatively major expenditure for completion. Probable reserves are oil and gas deposits with a higher than 50% chance of being recovered but are less certain than proven reserves.
The last reserve category considered is possible reserves, where the probability of successful extraction is at least 10%, but less than 50%, representing a lower level of certainty than probable reserves or proven reserves.
Market Value and PV-10
How Is Market Value Defined and Applied?
Market value, whether fair market value (FMV) for income tax matters or fair value (FV) for financial reporting, reflects real-world investor behaviors.
- Fair Market Value is defined as “the price at which the subject interests would change hands between a willing buyer and a willing seller, neither being under any compulsion to buy or sell and both having reasonable knowledge of relevant facts.”4
- Fair Value is defined as the price that would be received to sell an asset or paid to transfer a liability in an orderly transaction between market participants at the measurement date (ASC 820-10-20). In particular, ASC 820 prescribes that the measurement of the Fair Value of an asset or liability should be based on assumptions that market participants would use when pricing the asset or liability. Fair value is also defined in ASC 718 as the amount at which an asset (or liability) could be bought (or incurred) or sold (or settled) in a current transaction between willing parties, that is, other than in a forced or liquidation sale (ASC 718-10-20).
Under both definitions above, market value reflects an exit value, as of a known date, reflecting market inputs at that time.
Differences Between Market Value and SEC PV-10 Assumptions
Price assumptions under PV-10 reporting requirements are backward-looking, based on historical pricing. In contrast, FMV/FV uses forward-looking inputs like NYMEX futures prices (the “NYMEX Strip”) adjusted for differentials between the net prices received by the operator and the reference futures contract (West Texas Intermediate for oil and Henry Hub for natural gas).
Oil Prices Considered

As shown in the graphic above, a valuation based on historical prices as of year-end 2024 would result in a higher indicated reserve value as compared to consideration of forward-looking futures prices.
Discount rates also diverge: PV-10 fixes the rate at 10% while FMV/FV considers the weighted average cost of capital or risk-adjusted discount rates (RADRs) informed by SPEE5 surveys and other market factors.
Key Considerations for Calculating Market Value
Asset Retirement Obligations / Plugging and Abandonment Costs
The final cash flow considered for a producing well over its economic life is the cost to retire that well. In the oil industry, these costs are referred to as “plugging and abandonment,” while for financial reporting purposes these are referred to as Asset Retirement Obligations (ARO’s).
When reviewing a reserve report prepared by an engineering company, it is important to understand whether these costs have been included in the concluded reserve report’s cash flows already, or whether they need to be added for a market valuation.
Income Taxes
PV-10 values are presented before considering the effects of income taxes. FMV and FV analyses may use either pre-tax or after-tax cash flows, but this option impacts the selection of an appropriate discount rate. Income taxes can materially affect cash flows and resulting valuations.
In general, pre-tax cash flows are discounted with a pre-tax discount rate, while after-tax cash flows are discounted at an after-tax discount rate.
Operating vs. Non-Operating Working Interests
FMV and FV also distinguish between operating and non-operating working interests. Working interests for an operator reflect both the operator’s control and financing risks. Non-operating interests, which bear greater uncertainty and have a lack of control, are often valued using higher discount rates than would be required for an operator’s working interest. This lack of control is particularly important in undeveloped reserve values for a non-operating owner, as the operator controls both the pace of development and capital expenditures required to develop the reserves.
Market Approaches as Corroboration
Market-based approaches are also considered in a market valuation, usually to support the reasonableness of the DCF model’s results. There are two general sources for market multiples:
- Guideline Public Company multiples based on publicly traded stocks and their reported earnings
- Guideline Transaction Multiples from asset transactions.
These two forms of the market approach can be used to validate or challenge income-based estimates.
Conclusion and Practical Takeaways
PV-10 provides a useful regulatory benchmark but should not be relied upon to represent market value in transactions, litigation, or tax filings without adjustments. Independent Fair Market Value or Fair Value analyses, using market-aligned assumptions and risk-based adjustments, are essential for informed investment, legal, or financial decisions. Appendix 1 of this article shows a summary table of the key elements.
The selected valuation standard depends on the audience or use of the valuation: fair value is appropriate for financial reporting, while fair market value is required for gift and estate tax filings, as well as for many courts of law.
Appendix 1: Summary Table
The table below presents the key elements discussed in this article, critical for an understanding of the differences between PV-10 reserve reports created by petroleum engineers, and other value standards required for tax reporting, financial reporting and litigation matters:
|
Valuation Element |
PV-10 value |
Fair Market Value (FMV) |
Fair Value (FV) for Financial Reporting |
|---|---|---|---|
|
PV- 10 (Present Value at 10%) |
Fixed 10% discount rate, pre-tax, with historical prices; serves as a regulatory baseline | Serves as a reference / starting point requiring further adjustments | Serves as a reference / starting point requiring further adjustments |
|
Fair Market Value (FMV) / Fair Value (FV) |
PV-10 is not a proxy for FMV or FV, which require further adjustments to conclude market values | Central taxing concept; defined as the price between willing buyer and seller, using market-based assumptions | Central financial reporting concept; defined by ASC 820 as the exit price in an orderly transaction at a measurement date |
|
Reserve Categories (PDP, PDNP, PUD, Probable, Possible) |
Treats all reserve categories equally, ignores relative risk | Differentiates by risk; applies higher discount rates to riskier categories | Differentiates by risk; applies risk-adjusted discount rates based on reserve certainty |
|
Discount Rate (10% vs. Risk-Adjusted) |
Fixed at 10%, regardless of asset risk | Uses risk-adjusted discount rates, often based on market participant WACC or industry surveys (SPEE) | Uses risk-adjusted discount rates, informed by market data and specific asset risk |
|
Historical vs. Forward-Looking Pricing |
Uses 12-month historical average prices as of reporting date | Uses forward-looking market prices (e.g., NYMEX futures), adjusted for differentials | Uses forward-looking market prices, consistent with market participant assumptions |
|
Asset Retirement Obligations (ARO) |
May or may not be included, important confirm | Explicitly considered; included as a liability in cash flow projections | Explicitly considered; included as a liability in cash flow projections |
|
Income Taxes |
Excludes income taxes; pre-tax cash flows are presented | May use pre-tax or after-tax cash flows, but discount rate must be consistent | May use pre-tax or after-tax cash flows; discount rate selection aligns with tax treatment |
|
Operating vs. Non-Operating Interests |
No distinction; does not adjust for control or risk differences | Distinguishes between operating (lower risk) and non-operating (higher risk) interests | Distinguishes between operating and non-operating interests; applies appropriate risk adjustments |
|
Market Approaches (Multiples, Transactions) |
Not considered; PV-10 is purely an Income Approach, DCF-based | Used to corroborate DCF results; includes guideline public company and transaction multiples | Used to corroborate DCF results; includes market-based multiples and transaction data |
|
Professional Standards (IRS, FASB, SPEE) |
Follows SEC regulatory requirements for public company reporting | Follows IRS and industry standards for FMV (e.g., Rev. Rul. 59-60) | Follows FASB (ASC 820, ASC 718) and industry standards (SPEE) for FV measurement |
Appendix 2: Decline Curve Analysis: A Foundation of Reserve Estimation
In oil and gas reservoir engineering, decline curve analysis (DCA) is a foundational method for forecasting future production and estimating reserves. The technique models how production from a well or reservoir decreases over time, a natural outcome of pressure depletion and fluid dynamics. Among the various models used in DCA, the Arps decline curve equation is the industry standard due to its simplicity, adaptability, and proven accuracy.
Introduced by J.J. Arps in 1945, the Arps equation provides a mathematical relationship between production rate and time. It is expressed as:
q(t) = q₀ / (1 + b·Dᵢ·t)¹⁄ᵇ
Where:
- q(t) is the production rate at time t
- q₀ is the initial production rate
- Dᵢ is the initial decline rate
- b is the decline exponent (or hyperbolic constant)
- t is time
The model results in three types of decline, depending on the value of b:
- Exponential decline (b = 0): Constant percentage decline, typical of mature or tight wells with stable reservoir conditions
- Harmonic decline (b = 1): Often used when decline slows significantly over time
- Hyperbolic decline (0 < b < 1): The most common in unconventional reservoirs, where early-time production declines rapidly before flattening
Decline Curve Examples

The key inputs for the Arps equation, and their significance, are described below:
- Initial Production Rate (q₀): This is the rate at which a well begins producing, typically averaged over the first 30, 60, or 90 days. It sets the baseline for the decline curve.
- Initial Decline Rate (Dᵢ): This represents how quickly production drops from the start. A high Dᵢ suggests rapid depletion or pressure loss, common in shale wells and tight formations.
- Decline Exponent (b): The b-factor controls the shape of the decline curve. Lower values indicate steeper, more immediate declines, while higher values result in more gradual declines. In practice, the b value is calibrated to match actual production data and geological expectations.
Arps equations are a critical concept in reserve estimation, economic forecasting, and asset valuation.
- Source: Netherland, Sewell & Associates, Inc. Training Materials, provided by Eric Stevens, President.
- Aries software is owned by Halliburton.
- PHDWin is owned by TRC Consultants.
- (Treasury Reg. Section 20.2031-1(b) and Treasury Reg. Section 1.611-1(d)(2) as it modifies Section 20.2031-1(b).
- Society of Petroleum Evaluation Engineers.