English



In Taylor Sheridan’s Landman, the roughneck fixer Tommy Norris, played by Billy Bob Thornton, laid out the price range that keeps the oil business healthy:1
“You want oil to live above $60, but below $90. And don’t get me wrong, we’re still printing money at $90, but gas gets up over $3.50 a gallon, it starts to pinch. If it’s $100, every product in America has to readjust its price. Seventy-eight dollars a barrel, that’s about perfect. It brings enough profit to keep exploring, but doesn’t sting as much at the pump, unless, of course, you’re in California. I mean, they tax … it out there. It could be $45 a barrel and it’s still $4 at the pump. I don’t know how [they] do it.”
It is a clever example of screenwriting, and the last four months have given this truism a real-world test. The war between the United States and Iran sent crude well outside that band, and the recent de-escalation has now pulled it back inside.
Crude Prices Have Round-Tripped The War Premium
When the conflict began in late February 2026 and tanker traffic through the Strait of Hormuz collapsed, oil prices were pushed upward by a large geopolitical risk premium. Brent crude rose more than 55% from about $72 a barrel on February 27 to nearly $120/Bbl at its peak, with the international benchmark briefly touching $126/Bbl in late April, its highest in four years.2,3 West Texas Intermediate (WTI) also closed as high as $113 in early April.4 The International Energy Agency called the disruption the largest supply interruption in its history.
As the two sides moved toward a 60-day truce and a signing in Switzerland, the Strait (a natural physical chokepoint) reopened, and the premium deflated quickly. Brent recently slipped back to under $75 and posted one of its sharpest weekly declines in months.5
WTI Crude Has Round-Tripped the War Premium
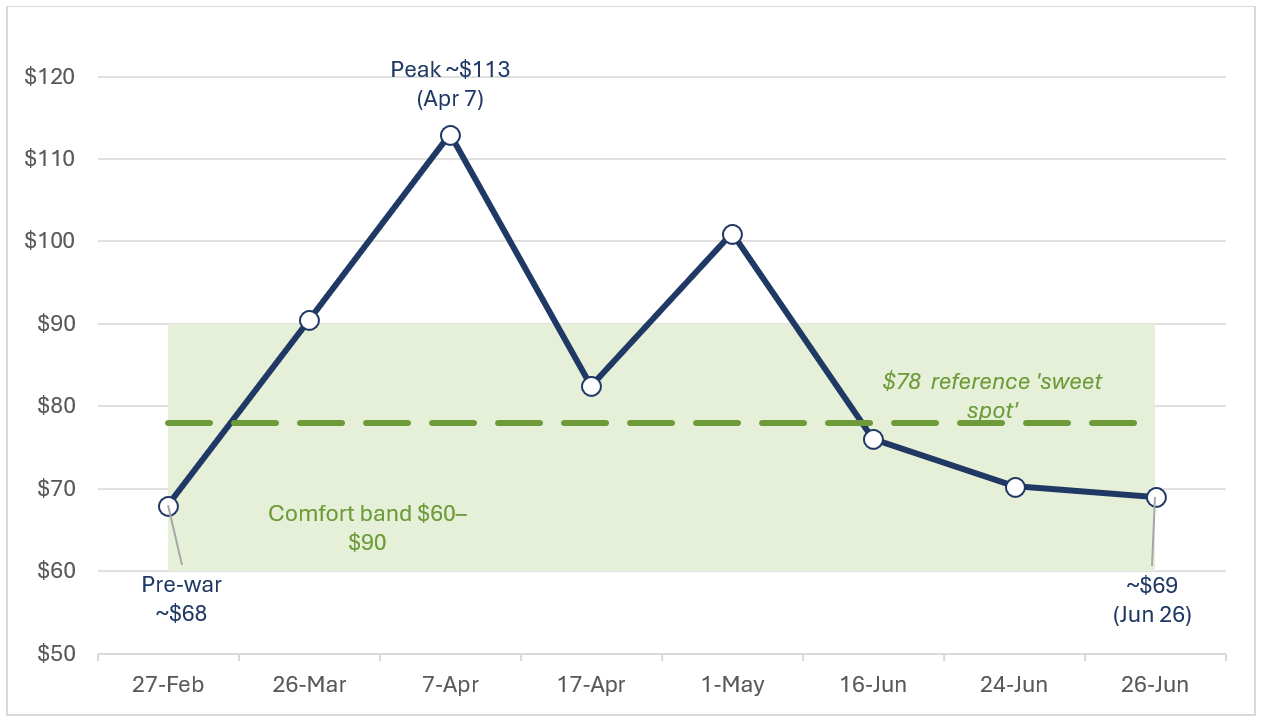
WTI crude, $/barrel, selected 2026 observations. Sources: CNBC, CNN, Trading Economics.
Two forces are pushing oil prices lower. The first is the reopening itself: shipping transits through Hormuz accelerated as vessels openly navigated the waterway, restoring Persian Gulf exports to roughly 75% of their pre-war levels.6 The second is the supply of full tankers that were waiting behind it. Saudi Arabia began loading tankers again at its Ras Tanura terminal in the gulf, Qatar issued its first post-war crude tender offer for its oil, Iraq is seeking a higher OPEC quota to recover wartime lost sales, and the United Arab Emirates, Kuwait, and Qatar are all raising output, limited mainly by a shortage of available tankers.
Given this increased supply, Goldman Sachs cut its fourth-quarter Brent forecast to $80 from $90 and now expects Gulf exports back to pre-war levels by the end of July, a month earlier than its prior view. Other outlooks did not anticipate how fast this would happen: the EIA’s June Short-Term Energy Outlook assumed the strait would stay effectively closed in the near term and put Brent near $105 for June and July.7
Gasoline Prices Are Falling More Slowly
Gasoline prices have followed crude prices down, but with their usual lag. The national average for regular slipped to $3.95 a gallon on June 25 from $4.05 the week before, and first dipped below $4.00 to $3.99 on June 18, the first time under that line since March 30.8,9
Pump Prices Fall Like Feathers
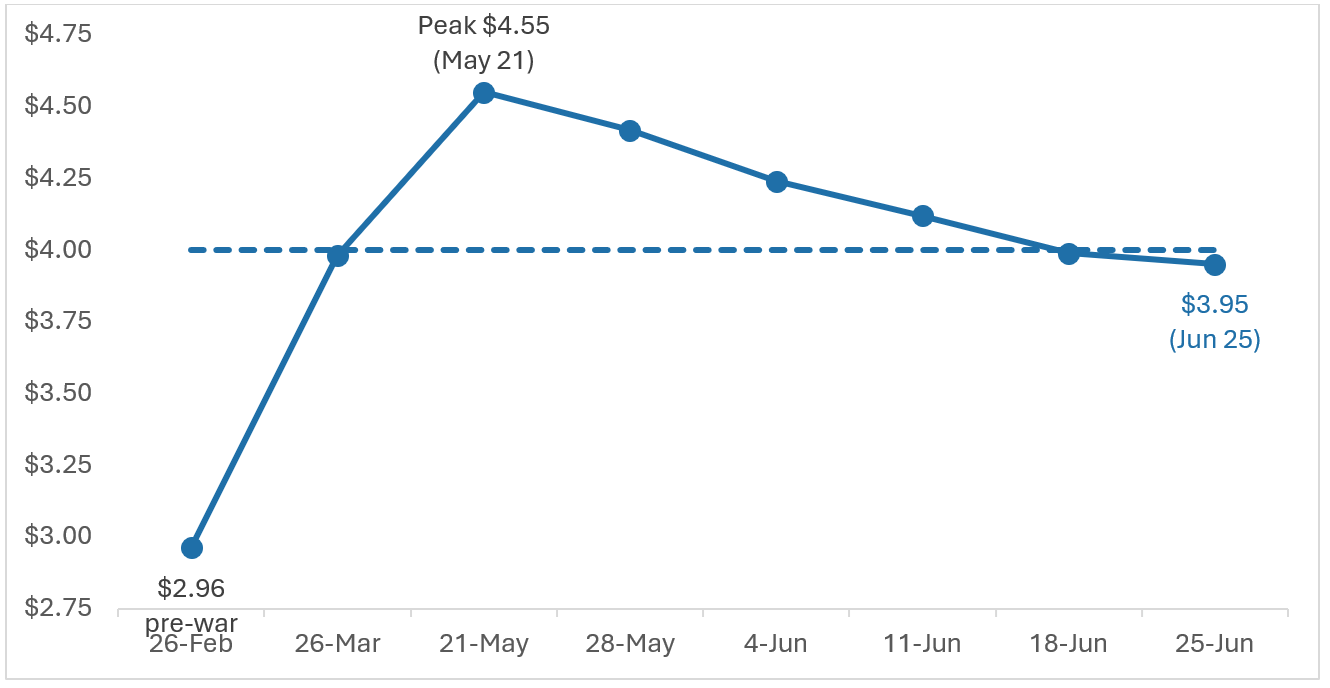
U.S. national average regular gasoline, $/gallon. Sources: AAA and finder.
Three things keep pump prices from falling as fast as crude. First, refineries switch to more expensive summer-grades of gasoline between April and June, adding several cents just as warm-weather driving demand rises.10 Second, the crude-to-pump relationship runs on a delay: as a rough rule, every $10 move in a barrel of crude shows up as about 25 cents at the pump over the following weeks, so the recent collapse in crude has not fully passed through yet.11 Third, inventories are not cooperating; U.S. gasoline stocks rose about 2.1 million barrels to roughly 216 million, against expectations of a drawdown, though they still remain about 5% below the five-year average.12
This asymmetry, commodity prices that rise like rockets and fall like feathers, has drawn recent political attention. President Trump ordered a federal investigation into the slow decline in gasoline prices at the pump, accusing oil companies of gouging consumers.13 Gasoline pricing relief is also uneven by geography: as of mid-June, California averaged $5.71 a gallon and Hawaii $5.58, while Indiana sat at $3.36 and Texas at $3.50 per gallon.14
Tommy Norris’s point about California still holds true.
SPR Helped to Offset the Reduced Supply Through the Strait
The U.S.’s Strategic Petroleum Reserve has been a key shock absorber through this episode. In response to the wartime spike, the Energy Department announced the release of 172 million barrels over roughly 120 days, part of an IEA-coordinated response of about 420 million barrels.15 This draw reduced reserve levels to 331.2 million barrels for the week ending June 19, down from 357.1 million three weeks earlier and the lowest level since 1983, against a peak capacity of 714 million.16,17
The SPR Is Acting as a Shock Absorber
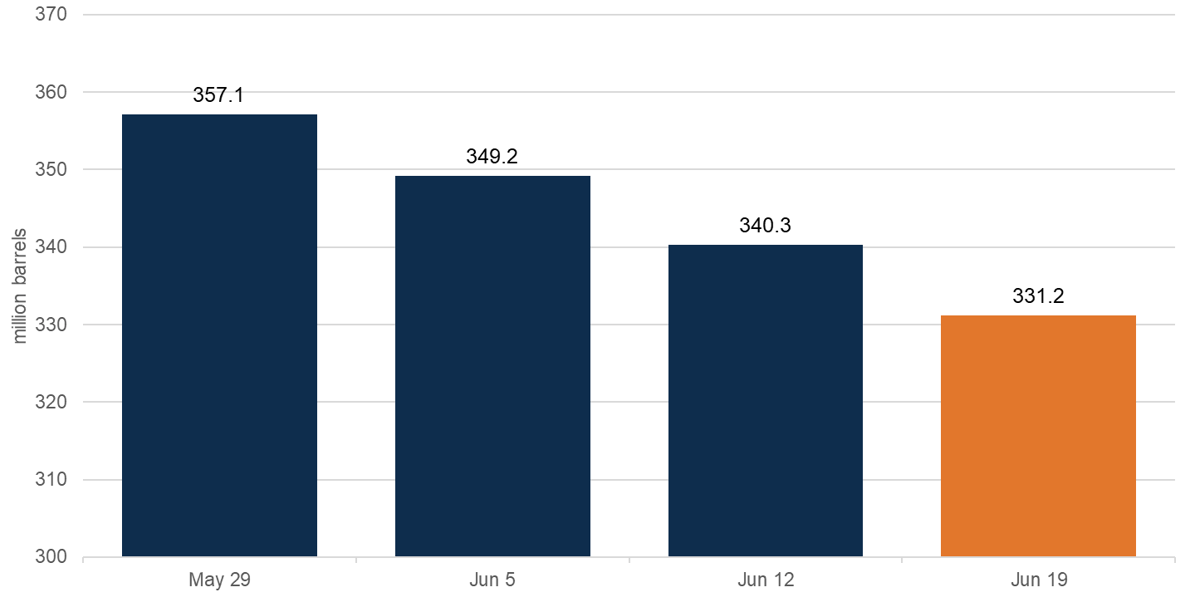
U.S. Strategic Petroleum Reserve, weekly ending crude stocks, million barrels. Source: EIA via Trading Economics.
Analysts argue that buffer is the main reason U.S. drivers never saw $6 gasoline nationally. With a truce now in place, the base case is that the draw pauses and the reserve begins to rebuild. The downside risk in prices is real but conditional: it rests on the durability of the de-escalation. A collapse of the deal would put the premium, and the prospect of $5 gasoline, back on the table. Patrick De Haan of GasBuddy has cautioned that with global commercial and strategic inventories depleted, markets could still turn anxious into July or August if supply normalization stalls.18
Breakeven Costs Support The Floor Price
The other reason the downside looks bounded sits on the cost side. Absent prices high enough to clear their economics, operators simply will not drill new wells, which reduces supply and supports commodity prices. The Dallas Fed’s first-quarter 2026 energy survey put the WTI breakeven to profitably drill a new well at $63 to $70 a barrel in the Permian and about $63 in the Eagle Ford, up 30% to 40% from 2020 levels as input costs and development costs climbed.19,20 Independent estimates of U.S. shale’s marginal cost land near $70.21 At about $69, WTI is sitting right on top of that current cost floor.
That math shapes operator behavior. Survey respondents told the Dallas Fed they expect WTI to average $74 at year-end 2026 and $73 two years out, and many described a wait-and-see stance on new drilling until the conflict’s outcome is clear.22 Drilling activity does respond to price: one operator reported drilling six wells in 2026, versus their plans of zero before crude prices rose.23 But with the median producers needing prices in the mid-$60s to justify a new well, sustained crude much below that level tends to throttle supply and, in time, causes prices to increase. The cost structure is what makes the low end of the comfort band a floor, rather than a trapdoor.
The Bottom Line
The last 30 days told an interesting story. The war premium that pushed Brent crude prices above $110/Bbl and gasoline above $4.50 per gallon has deflated as the Strait of Hormuz has reopened and Gulf supply returned, causing WTI prices to retreat back near their pre-war price of around $69 and the national gasoline pump average price to fall to just under $4.00. However, given recent Iranian actions, the sustainability of this cease-fire is still in question.
Considering Landman character Tommy Norris’s standard, crude prices have landed back inside the band that keeps the oil business working, below his $78 ideal. Whether it stays there depends less on the cost of a barrel than on the durability of peace in the Middle East.
WTI Strip Prices Decrease (Return to June Levels)
Spot prices and futures prices for the West Texas Intermediate (WTI) contract decreased over $5.00 per barrel19 in the near term and decreased by approximately $1.50 over the longer term.20
This movement, which appears modest, actually represents a significant “rebound and return” to reflect month-prior geopolitical risk as the agreed-upon cease-fire, which caused prices to dip into the $70s. Iran’s new attacks on commercial vessels, and the US’ renewed military action and restrictions on Iranian crude exports again raised concerns about dependable tanker traffic through the Strait. WTI rose more than 9% on July 13 and moved back above $80 the following day.
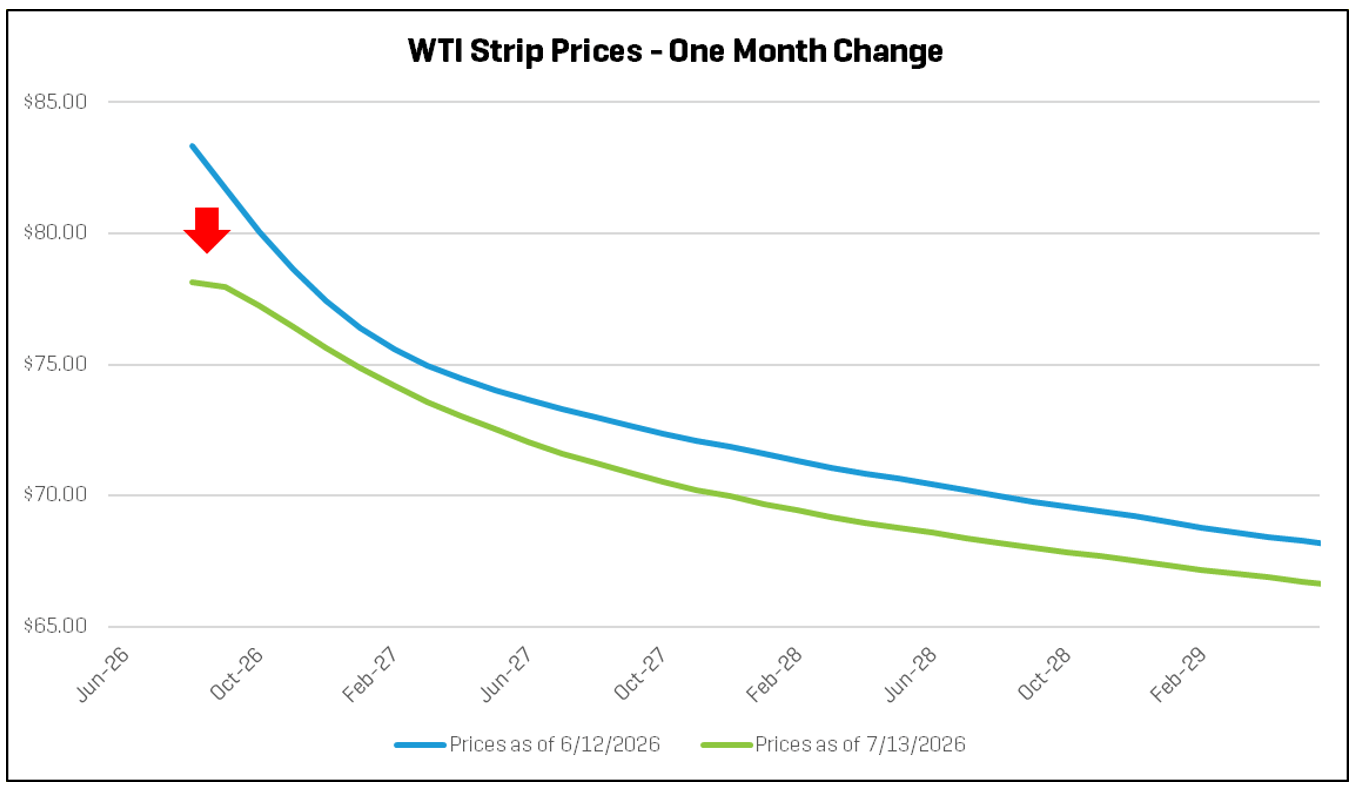
As shown, the oil price curve has maintained a state of “backwardation,” reflecting the market’s expectation of lower future spot prices over the longer term.
Oil Price Outlook
The price distribution below shows the crude oil spot price on July 14, 2026, as well as the predicted crude oil prices based on options and futures markets. Light blue lines are within one standard deviation (σ) of the mean, and dark blue lines are within two standard deviations.
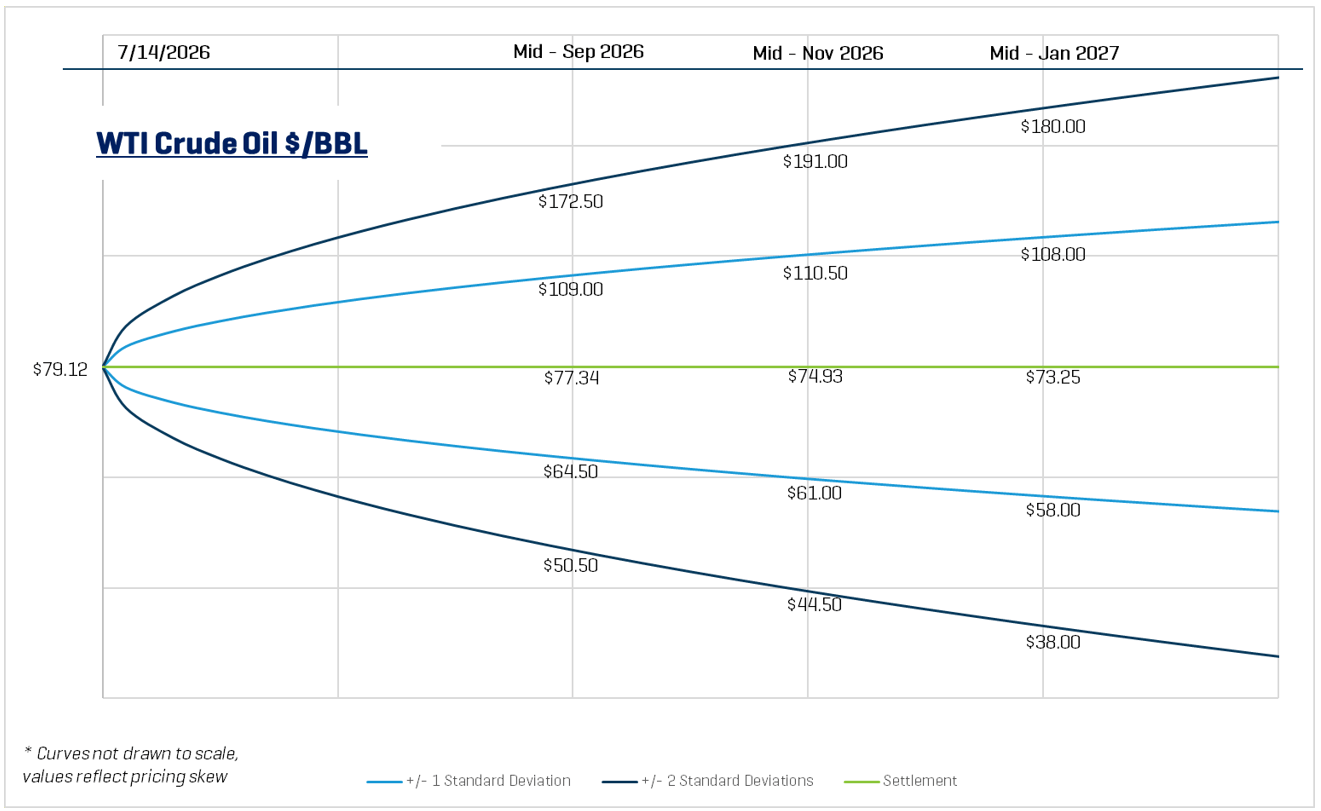
Based on these current prices, the markets indicate there is a 68% chance oil prices will range from $61.00 to $110.50 per barrel in mid-November 2026. Likewise, there is roughly a 95% chance that prices will be between $44.50 and $191.00. By mid-January 2027, the one-standard deviation (1σ) price range is $58.00 to $108.00 per barrel, and the two-standard deviation (2σ) range is $38.00 to $180.00 per barrel.
Insights
Remember that while option prices and models reflect expected probabilities rather than certain outcomes, they still remain a useful tool for assessing market expectations and risk.
For mid-January 2027 pricing as of July 14, 2026, the 1σ range had a spread of $50.00 per barrel, and the 2σ range had a spread of $142.00 per barrel, indicating a general increase in expected spreads compared to recent months.
- Enverus, Power Pulse, Vol. 2, No. 5 (May 20, 2026), “Utility mega-merger of NextEra & Dominion sets energy record,” pp. 1, 9.
- Ibid.
- NextEra Energy, May 18, 2026, investor presentation, “Growth Pipeline Could More Than Double 110 GW Capacity by ’32,” accessed via Enverus docFinder.
- Housley Carr, “We Are the Champions – NextEra Energy/Dominion Combo May Accelerate Gas-Fired Plant Buildout,” RBN Energy (May 20, 2026).
- Carr, “We Are the Champions,” RBN Energy (May 20, 2026).
- Eric Revell, “NextEra bets $66.8B on AI power boom with Dominion Energy acquisition,” Fox Business (May 18, 2026); Christine Mui, “NextEra’s $67 billion Dominion takeover creates world’s largest utility,” Fortune (May 18, 2026).
- Enverus, Power Pulse (May 20, 2026), “Utility mega-merger of NextEra & Dominion,” pp. 1, 9.
- ElectronEconomics, “NextEra’s reported bid for Dominion isn’t a bet on regulated utility earnings. It’s a bid to own the interconnection bottleneck at the centre of the AI power buildout,” Electron Economics (May 16, 2026).
- ElectronEconomics, “NextEra’s reported bid for Dominion isn’t a bet on regulated utility earnings,” Electron Economics (May 16, 2026).
- Lisa Martine Jenkins, “The NextEra-Dominion tie-up is a mega-deal for the AI era,” Latitude Media (May 19, 2026), citing Nick Zenkin, Latitude Intelligence, and Jefferies research notes.
- Carr, “We Are the Champions,” RBN Energy (May 20, 2026).
- Enverus, Power Pulse (May 20, 2026), “Utility mega-merger of NextEra & Dominion,” pp. 1, 9.
- Carr, “We Are the Champions,” RBN Energy (May 20, 2026).
- Carr, “We Are the Champions,” RBN Energy (May 20, 2026).
- Enverus, Power Pulse (May 20, 2026), “Utility mega-merger of NextEra & Dominion,” pp. 1, 9.
- NextEra Energy, May 18, 2026, investor presentation, “Growth Pipeline Could More Than Double 110 GW Capacity by ’32.”
- Versus May 15, 2026.
- Ibid.
- Versus June 12, 2026.
- Ibid.