English


The most complex aspect of oil and gas mineral valuation is assigning value to non-producing mineral interests or the non-producing portion of producing tracts. This task may be required for transactions, disputes, estate and income tax filings, accounting needs, and other situations that require a defensible valuation analysis. Producing wells are valued using an engineering (decline curve) approach or a cash flow multiple reflecting the age of the well. In theory, the market value of any non-producing mineral interest is the present value of the future cash flow expected from the interest, adjusted for risk. In practice, projecting that cash flow is very difficult and nearly impossible in circumstances in which there is limited development activity in the area. Thus, a Market Approach would be the best valuation methodology if comparable transaction data are available, but they rarely are. When the data are not available, many mineral buyers, sellers, and appraisers will use a Multiple of Lease Bonus Method (MLBM). We will discuss the shortcomings of the MLBM method and put forth our own market-based approach to the valuation of miscellaneous non-producing mineral properties located in relatively inactive areas.
EnergyNet Transaction Data
We will start with an analysis of actual sales transactions of non-producing mineral interests. We analyzed transaction data for 87 non-producing mineral properties (lots) sold by EnergyNet from January 2013 to October 2018. EnergyNet is a major player in this marketplace. In 2018, EnergyNet sold over 2,300 separate lots (of all property types, including non-producing minerals) with an aggregate sales value of approximately $2.2 billion.
EnergyNet provided us confidential and anonymized data on over 500 non-producing mineral transactions during this period.[1] To this data set, we added other data points, including drilling permit counts, rig counts by county, and lease bonus information, to create the master database described in this article.
Non-Producing Mineral Transaction Database and Regression Model
We sorted the 87 transactions by selling price per net mineral acre[2] (Price/NMA) from highest to lowest and categorized the data into deciles. For each decile, we calculated a median, as shown in Figure 1. The data points include sales price, net mineral acres sold, Price/NMA, Baseline Lease Bonus,[3] and the other items shown.
Figure 1. Median Measure for Each Decile
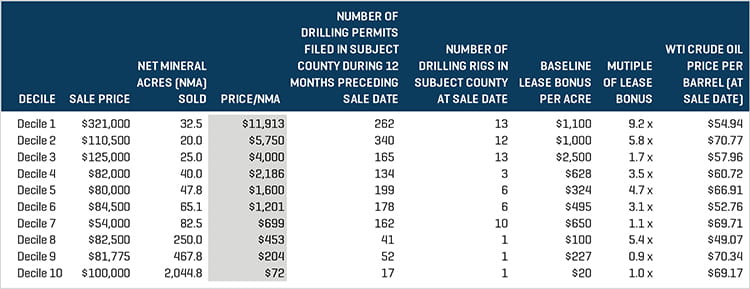
Source: EnergyNet
The data show that Price/NMA is positively correlated with the number of drilling permits, drilling rigs, and the Baseline Lease Bonus in the subject county at the time of sale. Therefore, using multiple variable regression, we attempted to develop an equation that could be used to predict non-producing mineral values based on these inputs. The strength of the model would be that it is based on actual market transaction data – data that have never been available to appraisers in such vast quantities. The weakness of the model would be that it is based on county-wide data rather than data on a more specific area surrounding the subject minerals. After running the regression analysis, we found that the model explains less than half of the Price/NMA.[4] A sample output from the model is shown in Figure 2.
Figure 2. Regression Model Scenarios and Outputs
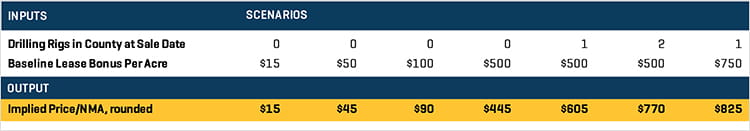
Source: EnergyNet
The predicted values from the model could be high or low relative to true market value, depending on other factors not captured in the regression model. The most important other factor is the specific location of the minerals within the subject county. For example, a map may show that subject minerals lie far from or just outside of a clearly defined permitting and development area, in which case the model’s value likely would need to be adjusted downward. Other factors that influence non-producing mineral value include oil and gas lease terms[5] (such as royalty rate, whether post-production costs are deducted from royalty (gross versus net leases[6]), acreage retention language, and continuous drilling clauses), the technical capability and expected drilling budget of the operator, the status of the minerals (for example, whether the subject minerals are held by production (HBP), or recent permits have been filed directly on or close to the subject tract), size of the mineral tract (see below), outlook for commodity prices (see below), takeaway infrastructure in the area, and political or environmental issues.
Multiple of Lease Bonus Method
One takeaway from the data in Figure 1 is that the Multiple of Lease Bonus[7] (MLB) data point ranges widely and is quite different from the 2.5x to 3.0x range many buyers and sellers expect. MLBM has been in existence for decades and has been regularly used by mineral buyers and sellers to estimate the market value of non-producing minerals. The method involves multiplying a representative lease bonus amount by a rule-of-thumb multiplier of 2.5x to 3.0x to develop the market value of the subject property on a per acre basis.[8] The method makes sense because lease bonus rates capture important information about the value of minerals. For example, when drilling and permitting activity in an area are increasing, lease bonus rates will rise. The conceptual framework for the methodology recognizes that a mineral owner may lease and re-lease (upon expiration of the earlier lease) the subject minerals multiple times over the course of an assumed holding period, earning a lease bonus payment upon each new lease.
The MLBM approach has many weaknesses. First, the 2.5x to 3.0x range was developed on a somewhat arbitrary basis, and lease bonus income is not the sole source of income for minerals. Second, the amount of lease bonus paid by a lessee is often contingent on or interrelated with the royalty rate. For example, if a mineral owner demands a high lease bonus payment, the lessee may lower the royalty rate to offset the cost of the higher bonus. The MLBM would award a relatively higher value to the minerals in this case because of the higher lease bonus but would fail to recognize the offsetting, negative impact of a low royalty rate. Third, as discussed previously, there is the problem of defining a representative or Baseline Lease Bonus rate. Lease bonus data are typically available on a county-wide basis only, and there is often insufficient information to adjust the bonus rate to the specific area of interest. Also, in periods of rapidly increasing leasing activity, it can be difficult to obtain a representative lease bonus rate.
In our master database of 87 transactions, the median MLB of 3.2x seems to support the validity of the 2.5x to 3.0x range. However, the data are highly dispersed and show a different story. Less than 5% of the 87 transactions had an MLB between 2.5x and 3.0x. About 23% of the transactions had an MLB of less than 1.0x. The maximum MLB was 212x, and the minimum was less than 0.1x. The 75th percentile MLB was 8.4x, and the 25th percentile was 1.2x. Figure 1 shows that the median MLB for the four lowest deciles averaged 1.0x, if Decile 8 is excluded. On the other end of the spectrum, the median MLB for the four highest deciles averaged 5.0x.
The market data indicate an MLB that is much lower than the commonly accepted 2.5x to 3.0x range.
Mineral Valuation in High-Value, Rapidly Developing Areas
Another takeaway from Figure 1 is that the MLBM appears to break down in high-value areas. High-value areas include promising geological areas where lease bonus rates, drilling permit and rig counts are high. A current example would be the Midland and Delaware sub-basins of the Permian Basin. For high-value, rapidly developing areas (not the focus of this article), the valuation process typically involves an Income Approach based on an engineering drill-out analysis[9] as well as a Market Approach based on price-per-acre data. In these areas, transaction data are more readily available (but still very difficult to obtain) because of buying by publicly traded mineral buyers as well as other funds which may be required to report the data. In these areas, the Market Approach is based on a price per net royalty acre[10] (Price/NRA) basis rather than a Price/NMA basis. It is not uncommon for core acreage in the Midland and Delaware Basins to sell for $10,000 to $20,000 per NRA.
Other Takeaways From the Data
Figure 1 shows an inverse correlation between the number of acres being sold and the Price/NMA – the larger the tract, the lower its value on a per-acre basis. This phenomenon may occur for two reasons. First, large tracts on the market are not typically located in high-development areas. Second, the buyer requires a minimum rate of return on the purchase, and the buyer will assume that not each and every acre will be prospective for mineral exploration and development.
MLB ratios for the highest-value properties in Figure 1 were high and disparate. This suggests that an Income Approach combined with a Market Approach based on Price/NRA is likely the best methodology for these property types when data are available.
No correlation was observed between oil price levels and Price/NMA, although we know, in theory, that higher expected oil (and natural gas) prices should increase mineral value.
A Defensible Approach
Mineral valuation cannot be mechanized or boiled down to a formulistic approach. Many variables are involved in the process, and professional judgment is required. The regression model discussed herein is based on market transaction data and should be a more defensible valuation approach if used as a starting point than the commonly used MLBM.
The author wishes to thank EnergyNet for its assistance and for providing the market transaction data used to develop this article and to thank Stout colleagues Phillip Schwartz and Joel Ompendoguelet for their research and other assistance.
- We required that the number of net mineral acres sold, the number of drilling permits during the 12 months preceding the sale date, and the number of drilling rigs located in the subject county at the time of sale were available, as well as other screening criteria.
- A net mineral acre (NMA) is calculated by multiplying the mineral owner’s undivided ownership percentage by the subject tract’s gross acreage. For example, a 3.125% undivided mineral interest in a 640-acre section equates to 20 net mineral acres. Burdens against the subject minerals including overriding royalty interests (ORRIs) and non-participating royalty interests (NPRIs), if any, should be considered and will result in a downward revision of NMA.
- The Baseline Lease Bonus is defined as the “most common” lease bonus per acre reported in the issue of the U.S. Lease Price Report published by Lierle Public Relations that was available at the time of sale or, when government lease sale data are available for the subject county at the time of sale, the average of these two data points.
- The regression was strongest using just two independent variables – the Representative Lease Bonus and Rig Count. The resulting regression formula is Price/NMA = .885 (Representative Lease Bonus) + 162.8 (Drilling Rig Count). The adjusted r-squared of the model is 0.38, which is just below the 0.40 to 0.60 preferred range. This points to the necessity of considering the other factors that influence non-producing mineral valuation mentioned in this article.
- Assuming the subject minerals are leased.
- Royalties can be paid on gross well proceeds or net proceeds after processing and marketing costs.
- The Multiple of Lease Bonus is the ratio of the Price/NMA divided by the Baseline Lease Bonus. For example, if 600 net mineral acres were sold for $60,000 (at $100 per net mineral acre) and the Baseline Lease Bonus in the area at the time of sale were $50 per acre, the Multiple of Lease Bonus for this transaction would be 2.0x ($100 per net mineral acre/$50 lease bonus per acre).
- Douglas S. Widlund, “Evaluating Minerals in Condemnation Cases,” Rocky Mountain Mineral Law Special Institute, January 1996. Also: Edwin C. Moritz, “Techniques for Valuing Acreage With Unproved Oil and Gas Potential,” 1996.
- The engineering drill-out cash flow projections will be based on assumed well type curves, spacing, and development pace.
- A net royalty acre (NRA) is defined as an NMA having a 12.5% royalty. Thus, under a 12.5% royalty rate lease, one NRA equals one NMA. Under a 25% royalty lease, one NMA equals two NRAs. Ten net mineral acres under a 25% royalty rate lease is worth two times more than 10 net mineral acres under a 12.5% royalty rate lease because the projected royalty income will be twice as high. Professional mineral buyers work with Price/NRA rather than Price/NMA to equalize their valuation metrics.