English

The dramatic decline in oil and gas prices during the past 12 months has left many wondering how the market values of oil and gas mineral and royalty properties1 have been affected. Clearly, royalty owner monthly check receipts are lower, but few grasp how far the market value of the properties has fallen. Rules of thumb, such as 3 to 5x annual cash flow, may result in nonsensical valuation conclusions especially if the annual period contains a mix of high and low commodity price months.
We analyzed two sets of empirical data and one of our own mineral appraisals both before and after the price collapse of late 2014 to measure the decline in royalty property values. First, we considered the change in share prices of royalty trusts, publicly traded entities that hold in mineral and royalty properties. Next, we gathered transaction data from EnergyNet, a leading marketer of oil and gas properties, to examine the change in cash flow multiples paid for mineral and royalty properties. Finally, we considered the change in the value of a large non-producing mineral portfolio that we appraised. The data shows that, in general, oil and gas mineral and royalty property values have declined a whopping 50%2 from mid-2014 to mid-2015.
There are three primary drivers of mineral and royalty property value: 1) expected oil and gas commodity prices, 2) the expected pace of drilling or development activity in the vicinity of the subject minerals, and 3) supply and demand factors, including market sentiment. We will consider all three in this article. As with any financial asset, the market value of any oil and gas property is based on the property’s expected cash flows discounted to the present at an appropriate discount rate.
The Decline in Oil and Gas Prices
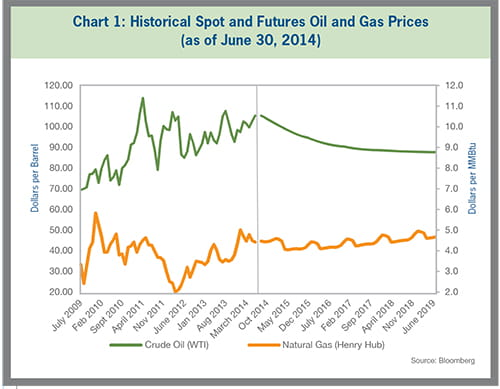
Chart 1 indicates that at June 30, 2014, the spot price of crude oil (WTI3) was $105.37 per barrel and based on the NYMEX futures market, crude oil was expected to remain within an approximate $90 to $100 per barrel window for the next five years. The spot price for natural gas (Henry Hub) on June 30, 2014, was $4.42 per MMBtu4 and based on the NYMEX futures market, natural gas was expected to remain within an approximate $4.00 to $4.50 per MMBtu band for the next five years.
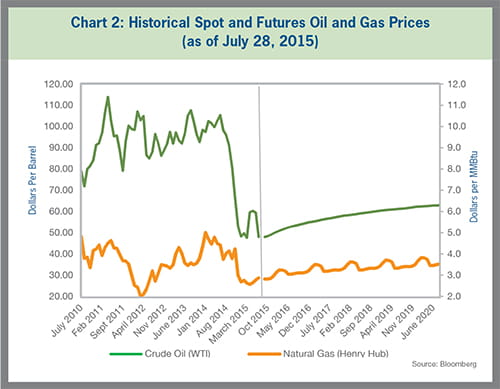
Then, the price collapse occurred during the second half of 2014. By the end of 2014, weakening global demand, unprecedented U.S. production, and strategic OPEC production decisions pushed prices down significantly. Chart 2 indicates that at March 17, 2015, crude oil prices had declined over 50% to $43.46 per barrel and based on the NYMEX futures market, oil price was expected to approximate $50 to $60 per barrel for the next five years. The spot price for natural gas was $2.48 per MMBtu on April 27, 2015, and based on the NYMEX futures market natural gas was expected to approximate $3.00 to $3.75 per MMBtu during the next five years, much lower than the previous $4.00 to $4.50 per MMBtu range.
Spot oil price declined just over 40% from June 30, 2014, to June 30, 2015. Expected oil prices also declined about 40% during the same period, falling from a $90 to $100 per barrel band to a $50 to $60 per barrel band. Spot natural gas price declined 37% during the same period. We will refer to the time period from 2011 to September 30, 2014, as the “pre-crash” time period and March 2015 to present as the “post-crash” time period.
The Decline in Stock Prices for Royalty Trusts
Royalty trusts are publicly traded portfolios of oil and gas mineral and royalty properties that pay out virtually all available cash flow, typically on a monthly basis. Royalty trusts do not employ debt or commodity price hedges. Their portfolios tend to be diversified, static (no new mineral properties can be acquired), and passively managed. Some royalty trusts have more exposure to oil than natural gas and some have more exposure to net profit interests rather than traditional royalty interests. Royalty trusts are pass-through entities for income tax purposes (they do not pay income taxes at the entity level) and are typically priced on a yield basis. Therefore, based on these characteristics, the change in the stock price of royalty trusts should be a reasonable proxy5 for the change in value of a relatively diversified, producing mineral and royalty portfolio from mid-2014 to mid-2015.
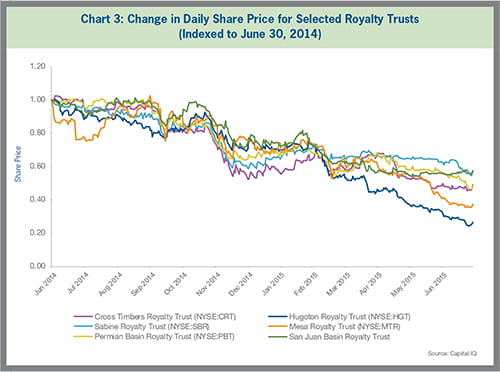
Chart 3 shows that between June 30, 2014, and June 30, 2015, the stock prices of royalty trusts generally declined 40% to 60%.6 This is a dramatic decline in a short period of time. Although extraordinary, we believe this percentage decline is a reasonable indication of the decline in value for directly held diversified, producing mineral and royalty portfolios between these time periods.7
The Decline in Cash Flow Metrics
The royalty trusts are not direct interests in mineral and royalty properties. We questioned whether there was a way to analyze the change in value of directly held properties from mid-2014 to mid-2015. The idea is conceptually difficult because properties do not transact frequently (to enable a price measurement of a specific property before and after price collapse). It is also difficult to develop generic value metrics such as price per acre or price per flowing barrel over time because properties are so unique. We decided to try to capture the change in the cash flow multiples paid during the subject period. To perform such a study, a large number of transactions would need to be considered due to the unique aspects of each property underlying a transaction.
To perform the study, we turned to the leading marketer of mineral and royalty properties in the U.S. EnergyNet creates a continuous marketplace of mineral and royalty properties by offering for sale over 2,600 properties in 2014.
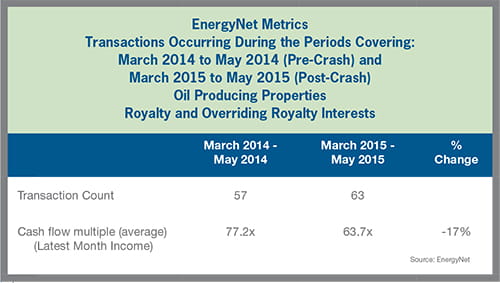
EnergyNet isolated 57 oil-weighted royalty8 and overriding royalty properties they sold from March 2014 to May 2014. Most of these properties were located in the mid-continent area such as Oklahoma and Kansas. The average monthly cash flow multiple9 on such pre-crash transactions was 77.2x. EnergyNet then isolated 63 oil-weighted royalty and overriding royalty properties they sold from March 2015 to May 2015. The average monthly cash flow multiple for these 63 post-crash transactions declined to 63.7x. Thus, the cash flow multiple declined approximately 17% from the pre-crash period to the post-crash period. This may not seem unusual to the casual observer as one would expect EBITDA multiples for operating businesses to ebb and flow during economic cycles. However, the data is counter to the prevailing view of mineral valuation.
Many use a fixed multiple of 5x annual cash flow (60 months of cash flow) to value small mineral and royalty properties no matter where the valuation date falls in the oil and gas price cycle. For example, a mineral and royalty portfolio generating $5,000 per month of cash flow valued at 60x monthly cash flow (or 5x annual cash flow) would have a value of $300,000 ($5,000 x 60). If that same portfolio generated only $2,500 per month as a result of lower oil and gas prices, the resulting value would be $150,000 ($2,500 x 60). Many believe that the cash flow multiple remains fixed and the resulting value is a function of the change in cash flow only. However, the EnergyNet data shows that there has been a double whammy on valuation — not only did the property level monthly cash flow decline from mid-2014 to mid-2015 as a result of the price collapse, but the multiple declined also. We believe the post-crash EnergyNet data is a reflection of an increase in the risk level perceived by investors (after suffering through the dramatic commodity price declines during late 2014) as well as investor’s view of a slower expected development pace.10 Thus, the 17% decline in the cash flow multiple reflected above is capturing only the increase in investor risk and delayed development pace. If the change in commodity price is considered (estimated at 40%), the overall decline in value would exceed 50%.
The Decline in Utica Shale Mineral Acreage Values
Lastly, we developed some observations from a non-producing mineral valuation we recently conducted in the Utica Shale. Our task was to value nearly 10,000 net, non-producing mineral acres just outside of the core Utica areas. We had a pre-crash valuation date and a post-crash valuation date. Almost all of the acreage had been leased. We employed three valuation approaches: 1) an engineering approach where we projected cash flow based on expected well performance (type curves), development pace, and NYMEX strip prices in effect at the subject valuation date, 2) a market approach where we considered price per net acre paid for adjacent acreage or other market information developed from industry contacts, and 3) a multiple of lease bonus approach where we were able to understand lease bonuses offered both before and after the price collapse based on discussions with the landman organization representing the most active oil and gas company in the subject county. Based on these approaches, our valuation conclusion declined nearly 60% between the two valuation dates.
Takeaways
Based on the data presented in this article, oil and gas mineral and royalty values have declined substantially as a result of the commodity price collapse. In general, producing properties appear to have declined approximately 50% from mid-2014 to present and non-producing minerals appear to have declined even more. The decline in value stems from lower expected commodity prices, a slower expected development pace, and greater risk in this asset class perceived by investors (i.e., higher required returns).
--
1 As distinguished from working or leasehold interests.
2 The reader should note that this is a broad generalization and will not apply in all situations – particularly in areas where development is continuing at a strong pace such as in the Permian Basin.
3 West Texas Intermediate, the NYMEX benchmark.
4 Million British Thermal Units.
5 The change in stock price could be impacted by factors other than those which would impact direct mineral and royalty properties such as differences in liquidity or float of the royalty trust securities. We also note that this comparison (as well as a comparison at the direct property level) is slightly distorted because all oil and gas properties are depleting in nature and given no change in commodity price or reserves (new discoveries or extensions) the latter date should always result in a lower price/value.
6 We did not observe any meaningful correlation between the decline in stock price and any key fundamental factor such as oil or gas reserve mix, geographic location, or reserve life index.
7 The reader should note that the percentage change in a particular property may differ, particularly if such property is located in an area of active development.
8 Overriding royalty interests are similar to royalty interests because neither are burdened by development or operating expenses. However, overrides are carved out of the working interest and therefore expire when the subject lease expires. Royalty interests are generally perpetual in nature and do not expire making them more valuable than an override.
9 EnergyNet generally calculates cash flow two ways: (i) the average monthly cash flow during the six months prior to the transaction and (ii) the cash flow during the month prior to the transaction. Sufficient data did not exist as of the date of this article to use the former definition based on the six month period so cash flow is defined in this study as the cash flow during the month prior to the transaction.
10 The properties that are the subject of this study are producing properties, many of which likely have further development potential to generate future royalty income from such producing properties.