English


THE WAITING GAME
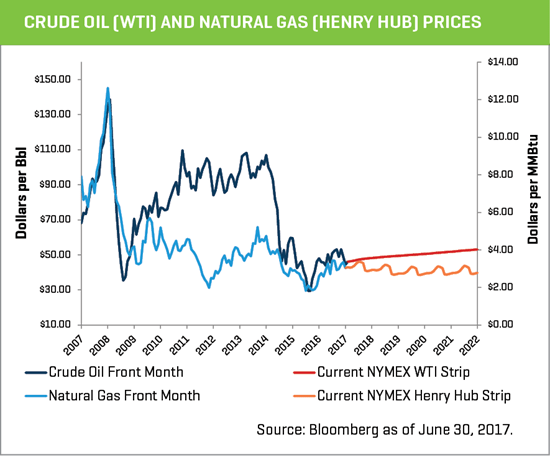
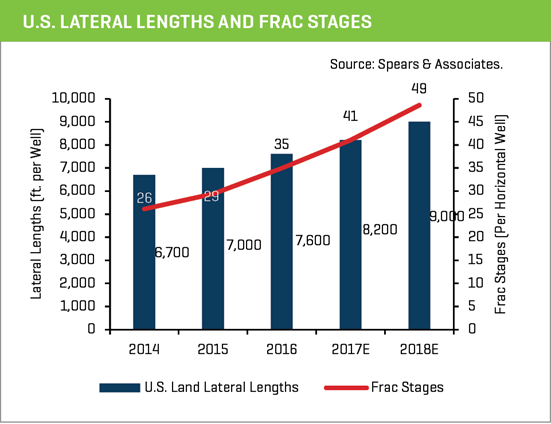
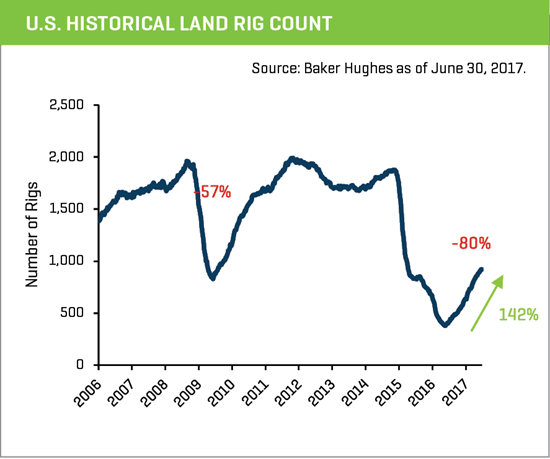
The energy service and equipment market has meaningfully rebounded since bottoming out in mid-2016. The U.S. land rig count has increased by 539 rigs or 142% since that time, and well complexity (lateral lengths) and service intensity (pad drilling, tighter cluster spacing, and more frac stages) have continued to accelerate. These have been driven by higher crude oil prices (compared to 2016 levels), enhanced drilling and completion efficiency, and OPEC (and others) production cuts.
However, this recovery has been tempered by fears of a U.S.-led production glut and prolonged supply/demand imbalance. While a number of energy producers can generate profits at current commodity price levels, a further deterioration could stifle development and blunt the recovery in the oilfield service industry, as evidenced by the recent slip in commodity prices (sliding back into the mid-$40’s), which has caused activity to pullback slightly in Q2 2017. Both E&P companies and investors are likely waiting for longer-term trends in production and inventory trends before committing additional capital to the segment, even as significant amounts of energy targeted capital waits on the sidelines.
Recent Capital Markets Trends
IMPROVING FINANCIAL METRICS, BUT...
While many energy service and equipment companies have seen activity (and revenue) improve, margins have not recovered to sufficient levels for the long term health of the sector. Q1 2017 revenue for production and well service companies increased 16% and 23% compared to Q4 2016 and Q1 2016 levels, respectively. Average Q1 2017 EBITDA margins moved to 6% from 1% and -0.2% in Q4 2016 and Q1 2016, respectively. However, historical EBITDA margins averaged approximately 20% from 2011 to 2015.
Certain segments, driven by increases in well complexity and service intensity, such as pressure pumping, frac sand, chemicals, and downhole equipment businesses have witnessed more pronounced improvement. Many energy service and equipment companies have also faced challenges financing emerging growth opportunities. Traditional bank financing has not been available for many of the private companies, generally regardless of the health of their respective balance sheets and cash flows, due to the increase in oilfield services bankruptcies (more than 120 since 2015) and regulation-based energy financing scrutiny. This has forced a number of companies to fund working capital and growth capital expenditures through factoring receivables and alternative lenders.
PUBLIC VALUATIONS HAVE RETREATED FROM EARLIER LEVELS
A number of public energy service company valuations reached elevated levels during the first half of 2017. This led to 12 public equity offerings in the energy service and equipment industry (including five IPOs) from January to May 2017, which is a significant shift from the almost two-year drought in listings beginning in late 2014 through late 2016. The IPOs were priced at implied valuations of approximately 10.2x 2017P EBITDA and 4.6x 2018P EBITDA, as analysts expect the recently listed companies to experience significant recovery from 2016/17P trough levels.
Offering activity subsequently slowed as crude oil prices declined and valuation multiples contracted. There has not been an energy service & equipment offering since early-May, although there are currently four IPOs in backlog. An uptick in crude prices (and the energy outlook) or sustained positive trends in activity for the listing and publicly traded companies would likely facilitate these and other currently sidelined public equity transactions.
Recent M&A Trends
CRUDE PRICES SLOW M&A ACTIVITY
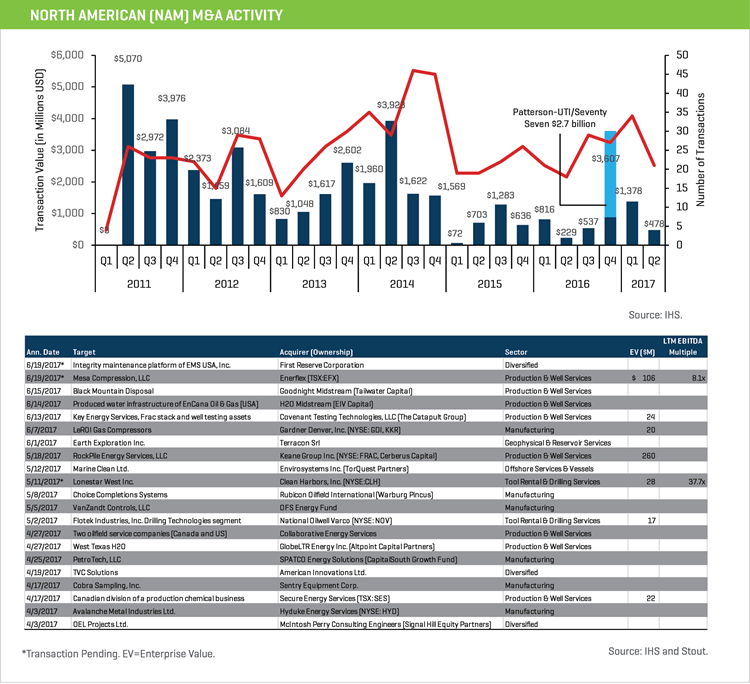
M&A activity has slowed in Q2 2017, as commodity prices slipped and uncertainty crept back into the market. However, activity levels have rebounded from prior year levels as energy service and equipment M&A activity through the first half of the year reached 55 transactions, compared to 39 in the first half of 2016 (+41%). These transactions continue to be funded with cash on hand and equity as credit markets remain difficult for energy service companies.
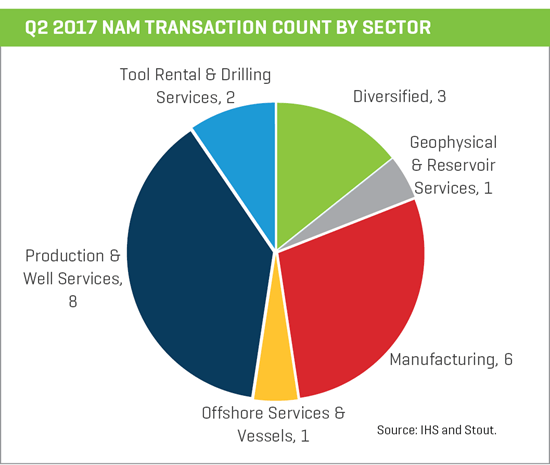
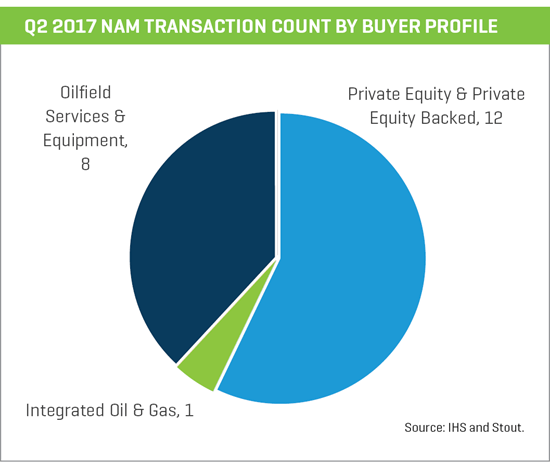
In the first half if 2017, strategics continued to represent the largest buyer group, although in Q2 private equity buyers, primarily through existing platform companies, were responsible for just over half of the total transactions in the quarter. Even amid recent commodity price uncertainty, energy service and equipment M&A activity is expected to increase due to the significant availability of assets for sale, including older vintage sponsor-backed investments (2011 and prior), as well as an increasing number of companies seeking liquidity to fund working capital and capex.