Français


Every spring and fall, banks reset the lending limits to oil and gas producers (“the borrowing base”). The law firm of Haynes Boone surveys energy bankers twice a year and asks them to provide their current oil and gas price decks, which are used to determine oil and gas producers’ borrowing bases.
Although just recently announced, Haynes Boone received the spring version of these oil and gas price decks from 24 banks in March 2023.
The following banks contributed to the current survey’s results:
- Amegy Bank
- Arvest Bank
- Barclays
- BOK Financial
- Cathay Bank
- Citizens Financial Group
- Comerica Bank
- East West Bank
- Fifth Third Bank
- First Horizon Bank
- First International Bank & Trust
- Frost Bank
- Gulf Capital Bank
- Modern Bank
- Pegasus Bank
- Sumitomo Mitsui Banking Corporation
- TD Securities
- Truist Securities
- U.S. Bank
- WaFd Bank
- Wells Fargo
- West Texas National Bank
According to the Haynes Boone Report, each energy lender has its own proprietary algorithm to determine its borrowing base. Future expectations of commodity prices (the price deck) over the life of the loan are not the sole determiner. However, they are a principal variable in a bank’s calculations. Therefore, predictions regarding future borrowing base redeterminations are heavily influenced by future commodity price expectations.
Survey Results
The results of the survey are shown in the graphic below.1 As shown, the results of the survey show a large degree of variation between banks. For the remainder of 2023, for instance, the mean price reflected for oil is approximately $66.00, but the range between bank pricing assumptions extends from a low of approximately $58 to a high of approximately $78 per barrel, clearly indicating that not all financial institutions have the same appetite for risk and outlook as the rest of the group.
Haynes Boone Energy Bank Price Deck Survey: Oil Base Case - Spring 2023
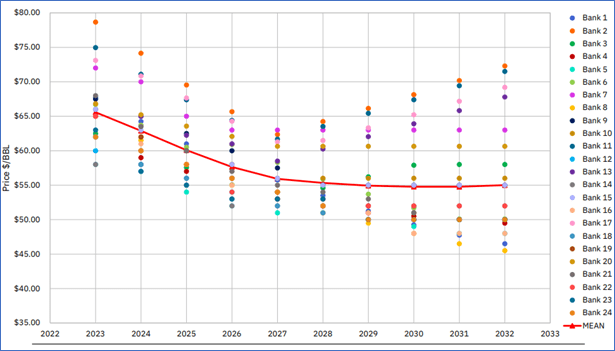
Also interesting to note is that the price expectations are the most closely aligned in 2027, after which they spread out again to even more price dispersion than currently seen in the survey results.
Discount Rate Impact of Lowered Price Decks
An illustrative analysis will demonstrate the impact of the banks’ lower price decks on a typical proved production valuation. The below analysis assumes that a well was drilled and started production next month.
The characteristics of the assumed decline curve were as follows:
- Initial production – oil, 1,000 Barrels of Oil Per Day (“BOPD”)
- Initial rate of decline – 65% per annum (horizontal well)
- B factor for Arps Equation – 15%
So in its first month of production, this well was expected to make over 30,000 barrels of oil, but by year 10 of its life, it was only expected to produce 300 barrels per month.
Illustrative Monthly Decline Curve

This analysis was extended for a 15-year period, combined with NYMEX futures pricing, and indicated a present value of approximately $37 million for the future production, discounted at 9% and using NYMEX pricing (held flat after seven and a half years).
Next, the mean of the banks’ pricing deck indications are substituted for the NYMEX pricing, and a calculation is performed for the present value of the future production of only $33.5 million, at a 9% discount rate, or “PV9.”
As a final step, a calculation is performed for what risk adjusted discount rate would need to be applied to this decline curve with NYMEX pricing in order to determine the same present value as would be concluded using the bank’s price deck. This resulted in a discount rate of 15.6% per annum, about 6.6% higher than the 9.0% rate in a PV9 calculation.
Key Takeaways
Since they are focused on the value of underlying assets as collateral for loans, banks will typically use a standard discount rate combined with a risk price deck when determining the collateral value, or borrowing base, for a discounted cash flow analysis perspective.
Market participants, however, typically will consider futures prices and expected differentials to determine their price projections for fair value and fair market value perspectives.
Based on the Spring 2023 responses to the Haynes Boone Energy Bank Price Deck Survey, employing these lower price decks with a typical Permian basin oil well’s decline curve, the lower price decks equate to about a 6.6% increase in the discount rate as compared to a standard PV9 calculation.
WTI Strip Prices Decrease
Spot prices and futures prices for the West Texas Intermediate (WTI) contract decreased by approximately $5.50 per barrel in the near term and by approximately $3.25 per barrel over the long term.
WTI Strip Prices - One Month Change

As shown, the oil price curve remains in a state of “backwardation,” reflecting the market’s expectation of lower future spot prices.
Oil Price Outlook
The price distribution below shows the crude oil spot price on May 23, 2023, as well as the predicted crude oil prices based on options and futures markets. Light blue lines are within one standard deviation (σ) of the mean, and dark blue lines are within two standard deviations.
WTI Crude Oil $/BBL

Based on these current prices, the markets indicate there is a 68% chance oil prices will range from $61.00 and $86.50 per barrel in mid-August 2023. Likewise, there is roughly a 95% chance that prices will be between $45.50 and $105.00. By mid-October 2023, the one-standard deviation (1σ) price range is $57.50 to $91.00 per barrel, and the two-standard deviation (2σ) range is $39.50 to $117.00 per barrel.
Key Takeaways
Remember that option prices and models reflect expected probabilities, not certain outcomes, but that does not make them any less useful. So far in 2023, crude oil prices have primarily remained within the range of $70 to $80 per barrel. As such, we have seen volatility decrease significantly compared to 2022, which is evidenced by the futures price ranges observed. As of May 23, 2023, the 1σ range had a spread of $33.50 per barrel, and the 2σ has a spread of $77.50 per barrel. For comparison, in 2022, we observed 1σ and 2σ price ranges in excess of $65.00 and $150.00 respectively.
- “Haynes Boone Energy Bank Price Deck Survey: Spring 2023,” Haynes Boone, April 2023.