Français


Corporate transaction activity continues to remain strong, as businesses from all industries as well as investors actively engage in mergers and acquisitions (M&A).
The purchase price paid in a merger and acquisition (M&A) transaction is presumed to be a reliable indicator of the target’s value when it results from a competitive sale process where the bidders have unencumbered access to accurate and complete information. However, if the winning bidder is a strategic buyer, then the purchase price may include some amount of “synergy value.” When dissenters in an M&A transaction exercise their appraisal rights under Section 262 of the Delaware General Corporation Law, the Delaware Court of Chancery or Delaware Supreme Court (collectively, the “court” unless otherwise noted herein) have the statutory mandate to “determine the fair value of the shares exclusive of any element of value arising from the accomplishment or expectation of the merger or consolidation,” which can include synergy value.
As discussed in a previous article, we found that the court generally places a high degree of reliance on a Deal Price Less Synergies value when the transaction involves a strategic buyer operating in a “robust” sales process. Today, we take a closer look at synergy value and offer further guidance for measuring and allocating such value in cases tried in the court.
Synergy value in this context primarily can come from three areas:
- revenue enhancements from new markets, higher product volumes, enhanced pricing power, etc.
- cost savings from head-count reductions, facility rationalization, elimination of duplicative costs, etc.
- capital optimization – improved working capital management, higher productivity of machinery and equipment assets, lower borrowing costs, etc.
The presumption in a dissenters’ rights case involving a strategic buyer, in which synergies are known (or at least believed) to exist, is that the deal price generally includes: a) the buyer’s perception of the fair value of the target, and b) some amount of synergy value that the buyer is willing to pay to the target’s shareholders to consummate the transaction. We can observe how a strategic buyer considers both elements by reviewing three primary steps in an M&A transaction.
First, the buyer will measure the total value it expects from the transaction. This includes the buyer’s perception of the value of: a) the target on a stand-alone basis using publicly available data, non-public information obtained from due diligence (if applicable), and general knowledge of the buyer; and b) the synergies that the buyer expects from the transaction. We refer to this figure as the Total Economic Value to Buyer.
Next, the buyer will separate the elements of the Total Economic Value to Buyer that are unique to the buyer from those that could be realized by another potential acquirer of the target. We refer to the former figure as the Synergy Value Unique to Buyer. In theory, the buyer would (or at least should) never pay the target shareholders for synergy value that results from actions, elements, or contributions that only the buyer can bring to the combined company. Deducting the Synergy Value Unique to Buyer from the Total Economic Value to Buyer yields the Maximum Negotiable Offer Price.
Finally, once the Maximum Negotiable Offer Price is set, the buyer will determine an initial offer price and negotiating strategy designed not only to close the transaction successfully, but also to retain the highest value possible for the buyer’s shareholders.
The M&A framework is summarized as follows:
Step 1: Derive Total Economic Value to Buyer
Step 2: Deduct Synergy Value Unique to Buyer
Equals: Maximum Negotiable Offer Price
Step 3: Determine an Initial Offer Price and Negotiation Strategy
Valuing Synergies in the M&A Process
The following is an illustration that demonstrates the application of the aforementioned framework and uses simplifying assumptions in certain areas.
The target has a market capitalization of $75.0 million and an enterprise value (i.e., market capitalization plus interest-bearing debt minus cash) of $92.0 million. The buyer performs a discounted cash flow (DCF) analysis and determines the target’s enterprise value to be $105.8 million, or 15% higher than the target’s reported enterprise value. The buyer uses a weighted average cost of capital (WACC) of 13% in its DCF analysis.
The buyer evaluates the potential synergies from the transaction and determines that they result from four areas.
- Buyer Pricing Synergy. The buyer expects that the transaction will allow it to increase the price on certain buyer products by 3.5%.
- Cost Savings Synergy. The buyer anticipates cost reductions of $1.9 million per year from the following areas: (a) $1.0 million from rationalizing sales personnel; (b) $0.3 million from eliminating duplicative public company costs (e.g., board fees, legal costs, audit expenses, etc.); and (c) $0.6 million from exiting a redundant distribution facility. However, the buyer also estimates that it will incur $0.3 million in integration costs and other one-time expenses to achieve these cost savings.
- Revenue and Gross Profit Synergy. The buyer believes that the combination will allow it to sell more of certain products and services that the target offers. The buyer estimates the incremental target revenue to be $3.0 million in the first year, which carries a gross profit margin of 54%. No incremental operating expenses are expected.
- Reduction in Cost of Capital Synergy. The buyer believes that the business combination will lower its cost of capital (i.e., WACC) from 13% to 12.5%. This reduction reflects the combined company’s larger size and a lower interest rate on its borrowings.
The buyer assesses each of these synergies and determines that the Buyer Pricing Synergy is considered to be unique to itself. The other synergies reflect economic benefits that could be realized by other potential strategic acquirers of the target.
The buyer estimates the value of each synergy area using the DCF method. The values of the Buyer Pricing Synergy, Cost Savings Synergy, and Revenue and Gross Profit Synergy reflect the incremental projected cash flows that are directly attributable to the synergy area in question, and the 13.0% WACC that the buyer used to estimate the target’s enterprise value. The quantification of value resulting from the Reduction in Cost of Capital Synergy is different from the other three synergies. It is calculated as the difference between the target’s enterprise value (with synergies) as derived using the 13.0% and 12.5% WACCs. The indicated synergy values are shown in Figure 1.
Figure 1. Synergy Values
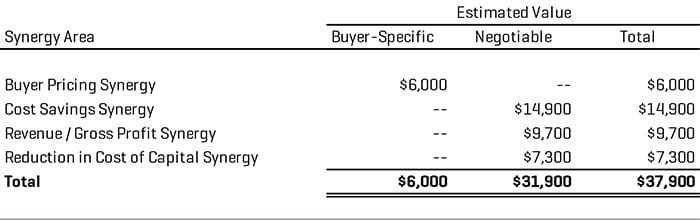
Note: Values in $000
Adding the Total Synergy Value of $37.9 million to the buyer’s estimate of the target’s enterprise value of $105.8 million yields a Total Economic Value to Buyer of $143.7 million. Subtracting the $6.0 million of Synergy Value Unique to Buyer results in a Maximum Negotiable Offer Price of $137.7 million.
The buyer determines that it will offer to pay a 33% acquisition premium to the target’s reported $75.0 million market capitalization, which results in an opening bid of $100.0 million (or $10.26 per share based on the target’s $9.75 million in shares outstanding). The enterprise value implied from the transaction price is $117.0 million, which is $20.7 million below the Maximum Negotiable Offer Price. If the buyer is successful in completing the transaction with its initial bid, the buyer will retain about 65% of the negotiable synergies and add $26.7 million of incremental value to the buyer’s shareholders (i.e., $20.7 million of negotiable synergies, plus $6.0 million in buyer-specific synergies), as shown in Figure 2.
Figure 2. Negotiable Synergy Values
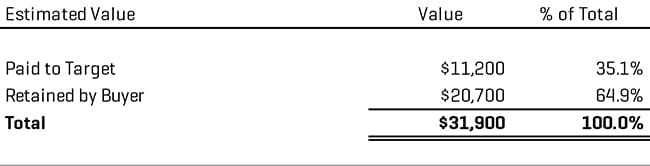
Note: Values in $000
The target likely will attempt to negotiate a higher purchase price in the transaction. As these negotiations unfold, the buyer can increase its offer price by $20.7 million before reaching the Maximum Negotiable Offer Price.
Alternative Method for Valuing Synergies
Rather than the DCF method, synergy value can be estimated using the transaction multiple. The $117.0 million enterprise value implied from the transaction and the target’s trailing earnings before interest, taxes, depreciation, and amortization (EBITDA) of approximately $10.5 million yield a transaction multiple of 11.1x. Multiplying the annual Cost Savings Synergy of $1.9 million by the transaction multiple of 11.1x yields a Total Synergy Value of $21.1 million. This method’s appeal is its simplicity, but simplicity is also its biggest weakness. The method fails to capture certain types of synergies, and it ignores potential changes in synergy amounts over time, as well as integration costs and other one-time expenses.
Allocating Synergies Between Buyer and Target
Once the Total Synergy Value and Maximum Negotiable Offer Price are estimated, the logical follow-up question is: "How does the buyer decide the purchase price that it is willing to pay the target?" In other words, how does the buyer determine the amount of synergy value to share with the target?
The methods available to allocate synergy value between the buyer and target generally fall into two categories: empirical studies and financial techniques.
Empirical Studies
One notable empirical study was published jointly by the Boston Consulting Group (BCG) and Technische Universität Műnchen (TUM) in March 2013 (BCG-TUM Study).[1] It reflects the application of a method developed based on an analysis of “the relationship between synergies and the effect of M&A announcements on capital markets.” Their research suggests that the target in a successful M&A transaction collects 31% of synergy value based on the average percentage of the transaction sample. The BCG-TUM Study can provide useful guidance in allocating synergy value between the buyer and target. In fact, it was cited by the Delaware Court of Chancery in its decision in Verition Partners Master Fund Ltd. and Verition Multi-Strategy Fund Ltd. v. Aruba Networks Inc.[2]
However, a couple of items are worth noting before relying solely on the BCG-TUM Study. First, the findings may be skewed because only “successful” M&A transactions were analyzed. A successful M&A transaction from the buyer’s perspective could be characterized, at least in part, as not over-paying for the target. If unsuccessful M&A deals were included in the sample, we suspect that the percentage of synergy value that the target collects would be higher than 31%. Unsuccessful M&A transactions could reflect buyers overestimating the target’s fundamental value, overestimating the potential synergies’ value, and failing to undertake disciplined purchase-price negotiations, among factors. Each of these factors could result in the buyer paying more of the synergy value to the target to complete the transaction. Second, the BCG-TUM Study shows a wide dispersion in the target’s synergy-collection percentage, ranging from 6% for transactions in the telecommunications industry to 51% for transactions in the health care industry. The authors note that the percentage varies, at least in part, based on the parties’ relative negotiating strengths and the amount of competition among bidders.
Financial Techniques
Several financial techniques can be considered to allocate synergy value between the buyer and target in an M&A transaction. While the techniques vary in their degree of complexity, they all borrow from the long-standing concept of “contribution analysis” observed in transfer-pricing arrangements for tax-reporting purposes. In these cases, value (or some form of profit) is allocated between the parties to a transaction based on their relative contribution of capital, assets, costs, earnings, knowledge and expertise, functions performed, risks assumed, or other factors.
Equal Sharing
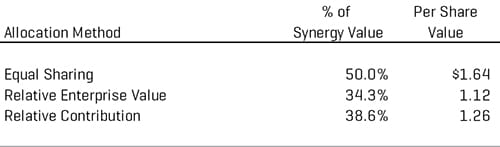
Starting with the simplest method, synergy value can be allocated equally between the buyer and target. This method essentially assumes that both parties contribute equally to (or have an equal “claim” on) the value that the synergies generate. This method might be most relevant in a 50-50 “merger of equals” transaction, or for synergies that depend equally on the buyer and target, and have a high degree of certainty of being realized. In our example, the target would receive $15.9 million in synergy value under this method (50% of $31.9 million), or $1.64 per share.
Relative Enterprise Value
Another method conceptually similar to the equal sharing method is based on the relative enterprise values of the buyer and target (as measured on a reported basis before the transaction). In the case of a stock-for-stock transaction with a fixed exchange ratio (e.g., 70% owned by buyer shareholders, 30% owned by target shareholders), the synergy value would be allocated 70-30 between the buyer and target. This method is applied in the same manner for an all-cash transaction. In our example, the enterprise values of $176.0 million for the buyer and $92.0 million for the target indicate that the aggregate synergy value should be allocated at 65.7% and 34.3%, respectively. The target would receive $10.9 million in synergy value under this method (34.3% of $31.9 million), or $1.12 per share.
Relative Contribution
A third method is a deeper dive than the previous two allocation models. The allocation framework asks two key questions to simulate the real-world decisions that the buyer must address either before or after the transaction.
- How will the synergy be realized?
- What relative contributions will the parties make in this regard?
The following discussion applies this framework to each synergy area in our illustration.
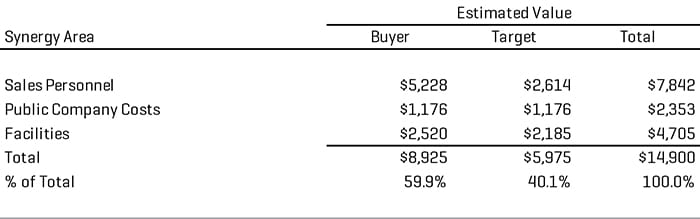
Cost Savings Synergy. The $1.0 million in annual cost savings synergies expected from rationalizing sales personnel will come from the elimination of six salespeople who are comparable in terms of level and compensation. The buyer analyzes their productivity levels and determines that head-count reductions will include four salespeople from the target and two from the buyer. Because the buyer “contributes” a more productive salesforce to the combined company compared with that of the target, the buyer should receive a higher allocation of synergy value. In this case, 67% of the synergy value is allocated to the buyer, as it contributes four of the six retained salespeople to the combined company.
The same conceptual framework can be applied to the $0.3 million in cost savings expected from eliminating duplicative public company costs. In this area, the buyer determines that the cost savings contributions that the parties made are similar and highly certain, and that sharing the synergy value equally is appropriate.
The allocation of the $0.6 million in annual cost saving synergies expected from exiting a redundant distribution facility is different from the other two synergies. The buyer assesses each distribution facility and determines that the combined company will use the buyer’s facility, and that the lease on the target’s facility will be terminated shortly following the transaction. However, it does not follow that 100% of the synergy value from this area should be allocated to the buyer because it contributes the “winning” facility. Rather, the buyer analyzes each facility in terms of relative performance metrics, including sales per square foot and rent per square foot, and finds that the buyer facility was 15.0% more effective and cost-efficient than the target’s location. With the help of algebra, we find that the synergy value allocation percentages are 53.6% for the buyer and 46.4% for the target.[3]
Based on the aforementioned allocations, the total Cost Savings Synergy value of $14.9 million is allocated at roughly 60.0% to the buyer and 40.0% to the target (Figure 3).
Figure 3. Cost Savings Synergy Value
Note: Values in $000
Revenue and Gross Profit Synergy. The $9.7 million in synergy value in this area is allocated between the parties based on their relative revenues (i.e., 60.5% for the buyer and 39.5% for the target). Relative revenues are used as the allocation basis because the nature of this synergy area closely matches the revenues that the parties contributed.
Reduction in Cost of Capital Synergy. The $7.3 million in synergy value in this area is allocated between the parties based on their relative enterprise values (i.e., 65.7% for the buyer and 34.3% for the target). Relative enterprise values are used as the allocation basis because the value increase related to this synergy area relates primarily to the enterprise values that the parties contributed.
Combining the allocated synergy values for the Cost Savings Synergy, Revenue and Gross Profit Synergy, and Reduction in Cost of Capital Synergy results in the target receiving $12.3 million in synergy value (38.6% of $31.9 million), or $1.26 per share.
Figure 4 summarizes the target synergy values based on the application of the three financial techniques.
Figure 4. Target Synergy Values
Note: Values in $000
Concluded Deal Price Less Synergies Value
A final determination of the Deal Price Less Synergies value can be made after considering the strengths and weaknesses of each financial technique used to allocate synergy value between the parties. Based on the aforementioned discussion and illustration, a Deal Price Less Synergies value of $8.99 per share is selected, which reflects the deal price of $10.26 per share minus the relative contribution synergy value of $1.26 per share.
Reasonableness Assessment
Our Deal Price Less Synergies value relies on several assumptions regarding the valuation of the target and synergies, as well as the subsequent allocation of synergy value between the buyer and target. The reasonableness of the fair value conclusion can be assessed by comparing it with the findings described in the BCG-TUM Study and certain information gleaned from financial buyers and also by evaluating the parties’ post-synergy profit margins.
The Importance of DCF and Synergies Analyses
When a Section 262 case involves a strategic buyer operating in a “robust” sales process, we find that the court routinely attempts to place a high degree of reliance on a Deal Price Less Synergies value in determining the fair value of the dissenters’ shares. The parties involved in the litigation should prepare not only a comprehensive DCF analysis (one of the court’s generally preferred valuation methods when an appraisal is required), but also a convincing analysis of the synergies expected from the transaction.
To be convincing, the synergies analysis should be: a) grounded in the factors that influence the buyer’s decision to effect the M&A transaction; b) based on assumptions that are supported by thorough analysis and sound logic; and c) reasonable when assessed against empirical studies or other financial metrics.
- Divide and Conquer. How Successful M&A Deals Split the Synergies, Boston Consulting Group, March 2013.
- Verition Partners Master Fund Ltd. and Verition Multi-Strategy Fund Ltd. v. Aruba Networks Inc., Court of Chancery of the State of Delaware, February 15, 2018.
- (53.6 ÷ 46.4) – 1 = 15%