English


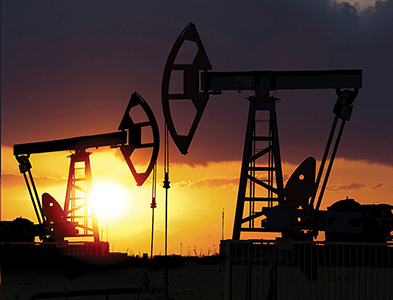
In last month’s Q1 Dallas Fed Energy Survey, dated March 27, 2024, there were two special questions which caught our attention:
- In the top two areas in which your firm is active: What West Texas Intermediate (WTI) oil price does your firm need to cover operating expenses for existing wells?
- In the top two areas in which your firm is active: What WTI oil price does your firm need to profitably drill a new well?
Respondents’ answers to these questions are summarized in the graph below, developed from the responses to the Fed Energy Survey’s special questions:
Comparison Between Plays

Industry Considerations
The “Other U.S. Shale” plays had the lowest price needed to cover lease operating expenses, at $33.50 per barrel. Likewise, this play also had the lowest oil price required to drill and operate a new well, at $59.41 per barrel. The highest oil prices needed to drill a new well were from the “Permian Basin, other” area (i.e., not in the Delaware Basin or Midland Basin of the Permian).
Considering this data in aggregate shows that for the U.S. E&P Industry, in aggregate, the average prices required for all plays and basins was:
|
1. Avg. WTI oil price needed to cover operating expenses for existing wells |
$37.62 |
|
2. Avg. WTI oil price needed to profitably drill a new well |
$64.29 |
|
3. Additional Oil Price Required to Drill a New Well |
$26.67 |
So according to participating survey respondents, on average, oil prices need to be about $27 per barrel higher to drill a new well, as compared to an operational floor price of about $38 per barrel.
Large/Small Firm Comparison
The survey went on to conclude that large E&P firms (with crude oil production of 10,000 barrels per day or more as of the fourth quarter of 2023) required oil prices of only $26 per barrel to cover operating expenses for existing wells (about $12 lower than the average), while small E&P firms (with fewer than 10,000 barrels per day) required about $44 per barrel, or $6 higher than the average.
This large range led us to question, and to develop an analysis to determine, an answer to the following question: “Is Bigger Better for Oil Companies?”
Investors and valuation professionals often consider valuation multiples when valuing enterprises and oil and gas assets. All else equal, a higher multiple typically indicates the following:
- The asset or equity is highly desired, supporting a higher price and corresponding multiple, and/or
- The perceived risk of earning expected returns is lower, therefore investors are willing to pay a higher price, and/or
- Higher expected growth in the underlying asset or entity
To test this theory with current market data, we first selected a group of publicly traded E&P companies for comparison:
- Exxon Mobil Corporation
- Chevron Corporation
- ConocoPhillips
- Range Resources Corporation
- Chesapeake Energy Corporation
- Antero Resources Corporation
- Occidental Petroleum Corporation
- EOG Resources, Inc.
- Diamondback Energy, Inc.
- Devon Energy Corporation
- Hess Corporation
- Matador Resources Company
- APA Corporation
- EQT Corporation
- Murphy Oil Corporation
Then we developed a regression analysis, examining how multiples of “Enterprise Value / Daily Production” varied for E&P firms of different sizes. The results of this analysis are shown in the graphic below.
EV / LTM Avg Daily Production (boe/d)

The upward slope in the linear regression line supports the premise that investors will pay a higher multiple of average daily production for larger companies. However, this is not a perfect correlation. In fact, the analysis shows that scale is responsible for about 38% of the increase in observed multiples, indicating that 62% of the variance results from factors other than scale.
Why would investors pay higher multiples for larger companies?
Economies of Scale
Economies of scale refer to the cost advantages that businesses can exploit by expanding their scale of production or operations. As the scale of output increases, the cost of producing each additional unit generally decreases.
Smaller independent producers often lack the scale and resources to achieve significant cost advantages, making it difficult for them to compete with the larger integrated oil and gas firms on a per-unit cost basis.
Control Along The Value Chain
The oil and gas value chain refers to the sequence of activities involved in the exploration, production, processing, transportation, and distribution of oil and natural gas products. It encompasses the following key stages:

Control of each of the factors below allows E&P companies to develop competitive advantages:
- Upstream
- Exploration: Identifying potential oil and gas reservoirs through seismic surveys, geological studies, and exploratory drilling
- Development: Drilling production wells, constructing facilities, and preparing the field for production
- Production: Extracting crude oil and natural gas from the reservoirs
- Midstream
- Transportation: Moving crude oil and natural gas from production sites to processing facilities or markets through pipelines, tankers, trucks, or railcars
- Storage: Storing crude oil and natural gas in tanks, underground caverns, or other facilities
- Saltwater disposal
- Downstream
- Refining: Processing crude oil into various refined products like gasoline, diesel, jet fuel, and petrochemicals.
- Marketing and Distribution: Transporting and selling refined petroleum products to end-users through pipelines, tankers, and retail outlets.
As shown in the results of the regression analysis above, large integrated firms like ExxonMobil and Chevron enjoy high valuation multiples, as they operate massive refineries that process crude oil into various petroleum products. The high capital costs of these facilities can be better absorbed and spread across higher throughput. Some major oil companies also have extensive networks of branded gas stations, allowing them to capture profits from retail operations.
Key Takeaways
Scale can help drive down costs for companies, and it can also allow them to generate higher profits with the same asset base given their ability to negotiate better agreements with suppliers willing to sacrifice margin to acquire a large customer.
Market data and multiples support that, on average, larger companies trade at higher multiples than smaller ones, given investor perceptions about risk, cost structure, and the ability to control more of the value chain. However, scale only accounts for about 38% of the difference in valuation multiples assessed, while the remaining differential between company multiples comes down to factors like:
- Reserves and Production: Companies with larger proven reserves of oil and gas, as well as promising exploration prospects and ability to grow production, tend to be valued higher by the market
- Cost Structure: Companies with lower exploration, production, and operating costs per barrel tend to have higher profit margins and can generate more cash flow, leading to higher multiples
- Asset Quality: Companies with high-quality assets (e.g., low-decline rate fields, fields with remaining long plateau production) are typically valued more by investors
- Geographic Diversification: Companies with a globally diversified portfolio of assets across politically stable regions are seen as less risky and tend to trade at a premium
- Capital Discipline: Companies that have demonstrated capital discipline, returning excess cash to shareholders via dividends and buybacks, rather than overspending on acquisitions/projects, are favored
- Management Team: Strong management teams with a track record of good capital allocation and execution tend to garner higher multiples
- Strategy: Companies pursuing a low-cost, high-return production growth strategy versus a rapid reserve replacement approach tend to be valued more highly
So in essence, E&P companies exhibiting attributes like low costs, visible production growth, proven shareholder returns, and conservative financial policies are typically expected to command premium valuation multiples.
WTI Strip Prices Decrease
Spot prices and futures prices for the West Texas Intermediate (WTI) contract decreased by approximately $7.00 per barrel in the near term and decreased approximately $2.00 over the longer term.
WTI Strip Prices - One Month Change

As shown, the oil price curve remains in a state of “backwardation,” reflecting the market’s expectation of lower future spot prices.
Oil Price Outlook
The price distribution below shows the crude oil spot price on May 15, 2024, as well as the predicted crude oil prices based on options and futures markets. Light blue lines are within one standard deviation (σ) of the mean, and dark blue lines are within two standard deviations.
WTI Crude Oil $/BBL

Based on these current prices, the markets indicate there is a 68% chance oil prices will range from $67.00 and $88.00 per barrel in mid-August 2024. Likewise, there is roughly a 95% chance that prices will be between $52.50 and $108.50. By mid-October 2024, the one-standard deviation (1σ) price range is $64.00 to $90.50 per barrel, and the two-standard deviation (2σ) range is $47.00 to $118.00 per barrel.
Key Takeaways
Remember that option prices and models reflect expected probabilities, not certain outcomes, but that does not make them any less useful. Throughout most of 2023 and 2024, crude oil spot prices have primarily fluctuated within the range of $70 to $90 per barrel. During that time, we observed general increases in futures price volatilities as prices neared the upper bound of that range, as evidenced by the futures price ranges observed. For mid-October 2024 pricing as of May 15, 2024, the 1σ range had a spread of $26.50 per barrel, and the 2σ range has a spread of $71.00 per barrel. For comparison, in 2022 we observed 1σ and 2σ price ranges in excess of $65.00 and $150.00, respectively.