English


Exacerbated by the current heat wave in the southern United States, electric systems are being strained to meet both daily peak demand as well as to produce the amount of energy required for the grid served. To better understand the cause of these potential shortfalls, it is necessary to understand the capacity factors of different energy sources, including renewables like solar and wind, as compared to their traditional fossil fuel counterparts such as coal, nuclear, and natural gas.
Capacity Factors
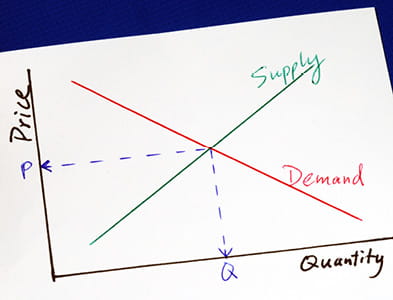
The capacity factor is the ratio of the actual electrical energy output over a certain period of time to the maximum possible output if the power source was operating at full capacity all the time. Essentially, it illustrates the efficiency and dependability of an energy source.
For example, a 100-megawatt (MW) fossil fuel generating station, having a 70% capacity factor, could theoretically generate 613,200 megawatt hours (MWH) of energy in a year. A 100 MW solar farm with a 25% capacity factor could only generate 219,000 megawatt hours during the same year.
The capacity factor is not about how much energy a power plant can potentially generate, but how consistently it produces energy over time. For instance, a wind turbine can produce enormous energy when the wind is strong, but if the wind is variable, the average energy produced over time might be quite less. Likewise, given that the sun does not shine all day, the electricity generated from a solar panel is constrained by the hours of darkness.
Capacity Factors: Renewables Versus Fossil Fuels
Now, let’s delve into the capacity factors of renewables and fossil fuels.
US 2022 Capacity Factor By Fuel Type
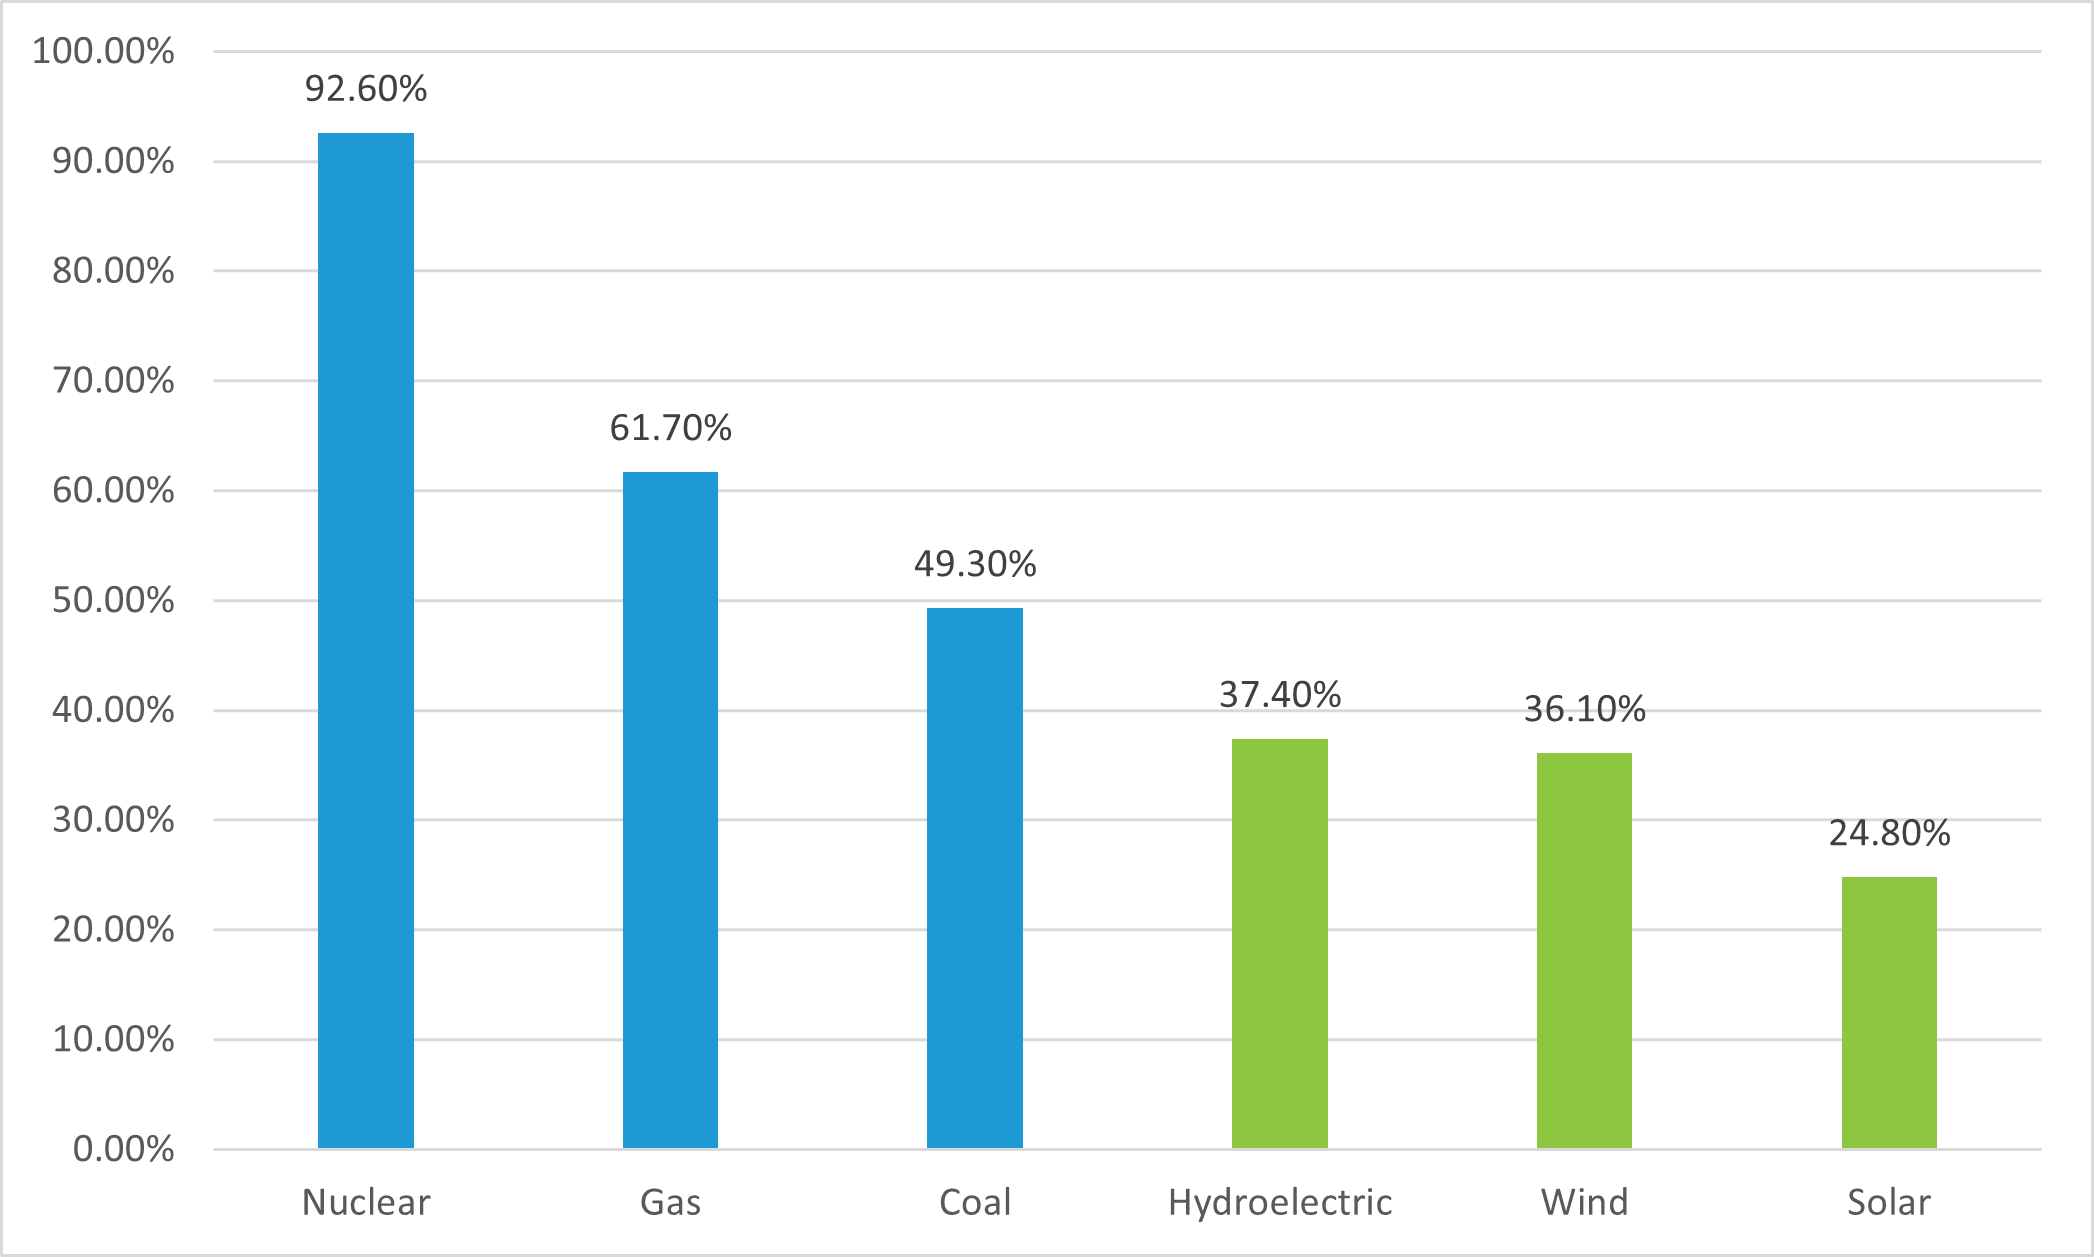
Capacity factors for solar power averaged about 25% in 2022 for the U.S. Wind was slightly higher at approximately 36%. These figures are comparatively lower than those of fossil fuel power sources, which typically have capacity factors ranging from 50% (for coal) to 93% (for nuclear plants).1
This variance arises due to the inherent nature of renewable energy sources – they are variable and reliant on weather conditions, unlike fossil fuels that can run continuously, barring operational or maintenance interruptions.
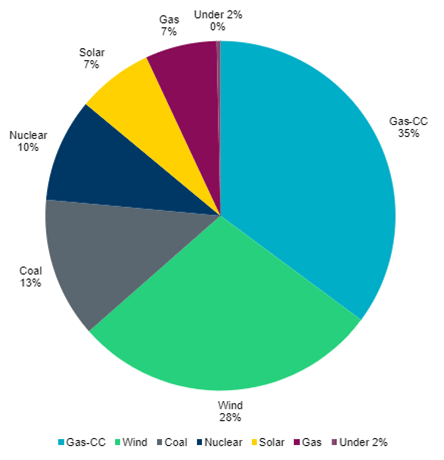
In my home state of Texas, served by the Electric Reliability Council of Texas (ERCOT), a review of generation sources to date for 2023 illustrates how increased dependence on renewables is adding to the uncertainty around future generation sources being able to meet demands.
With one third of Texas’ generation coming from wind and solar, it is easy to see how weather changes such as the current heat wave and triple-digit temperatures are causing ERCOT to ask residents to cut power consumption and turn up their thermostats.2
Energy by Fuel for 20233
In addition to the current heat wave, a recent major hailstorm in western Nebraska took an entire solar farm out of commission, forcing the local community to turn back to traditional power sources, local officials said. The so-called Community Solar Project – a 4.4 megawatt solar field comprised of 14,000 solar panels and located in Scottsbluff, Nebraska – is not currently operating and will remain offline until repairs are completed.4
Capacity Conundrum
Considering these capacity factors, it’s clear that even though renewables and fossil fuel plants may have the same installed capacity in megawatts, they are not able to generate the same amount of electricity over time. This blog post underscores the need for a balanced portfolio of U.S. generating assets, both renewables and fossil fueled. Ultimately, the transition to a fully renewable energy grid is a complex endeavor and involves much more than just a direct replacement of fossil fuels with the same capacity of renewable sources.
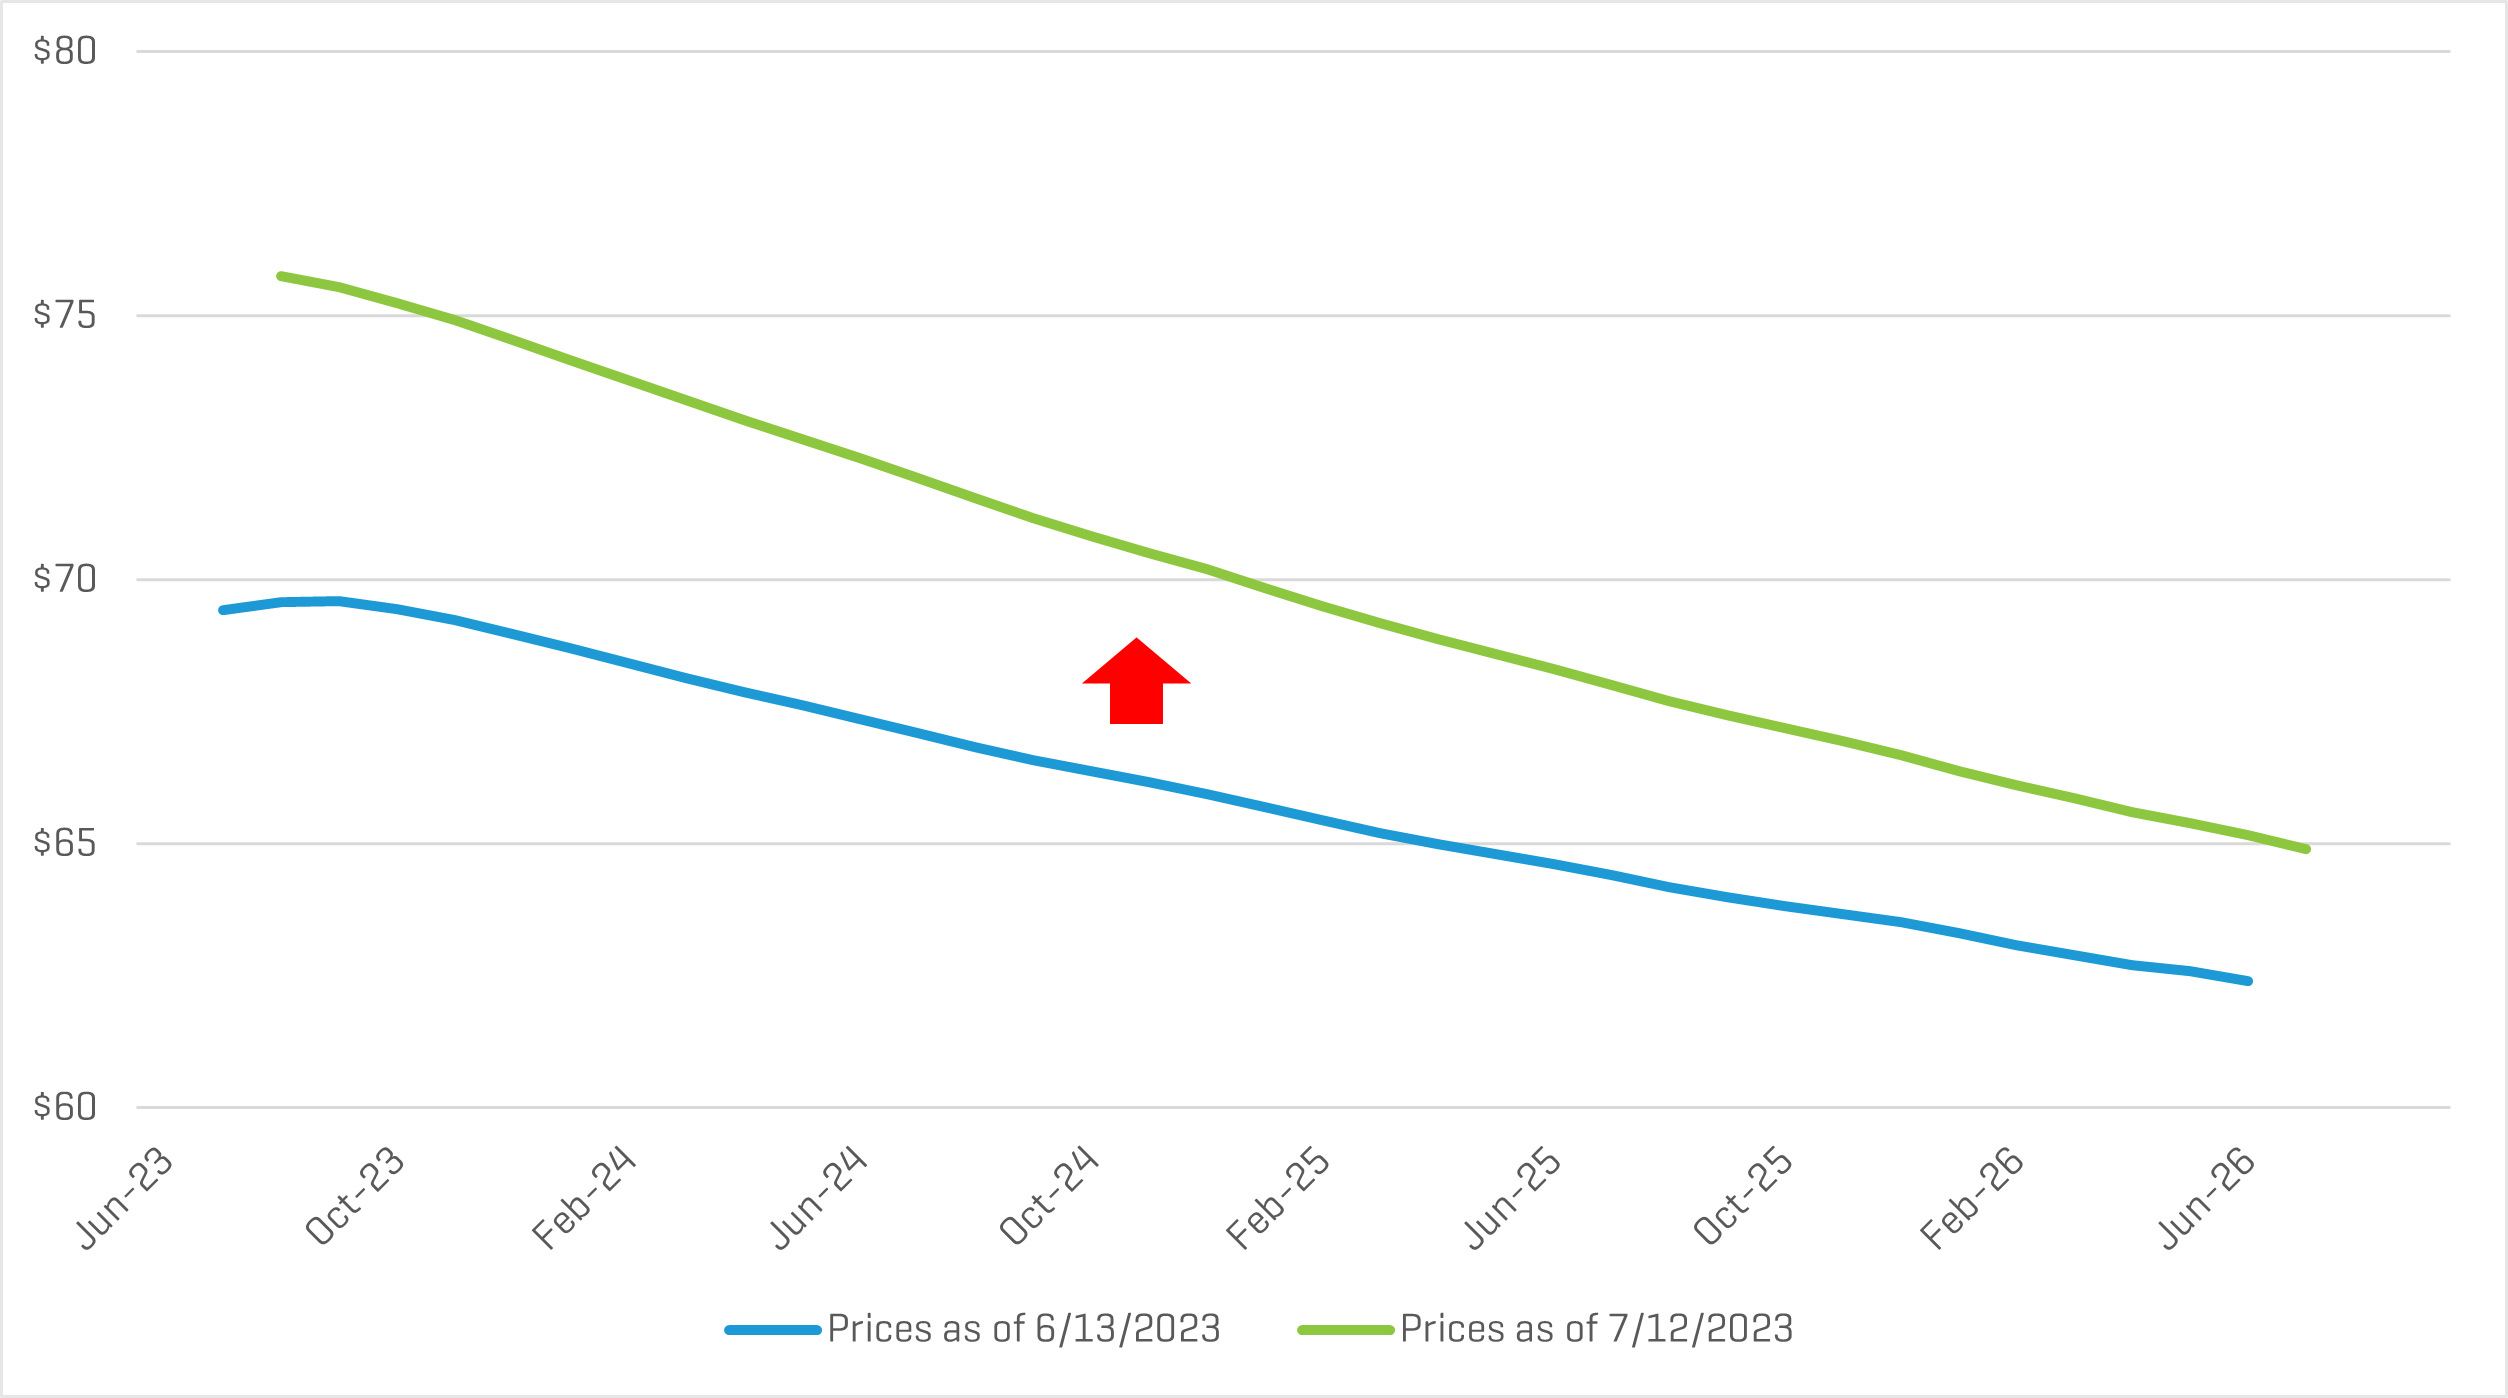
WTI Strip Prices Increase
Spot prices and futures prices for the West Texas Intermediate (WTI) contract increased by approximately $6.00 per barrel in the near term and increased approximately $3.00 over the longer term.
WTI Strip Prices – One Month Change
As shown, the oil price curve remains in a state of “backwardation,” reflecting the market’s expectation of lower future spot prices.
Oil Price Outlook
The price distribution below shows the crude oil spot price on July 13, 2023, as well as the predicted crude oil prices based on options and futures markets. Light blue lines are within one standard deviation (σ) of the mean, and dark blue lines are within two standard deviations.
WTI Crude Oil $/BBL
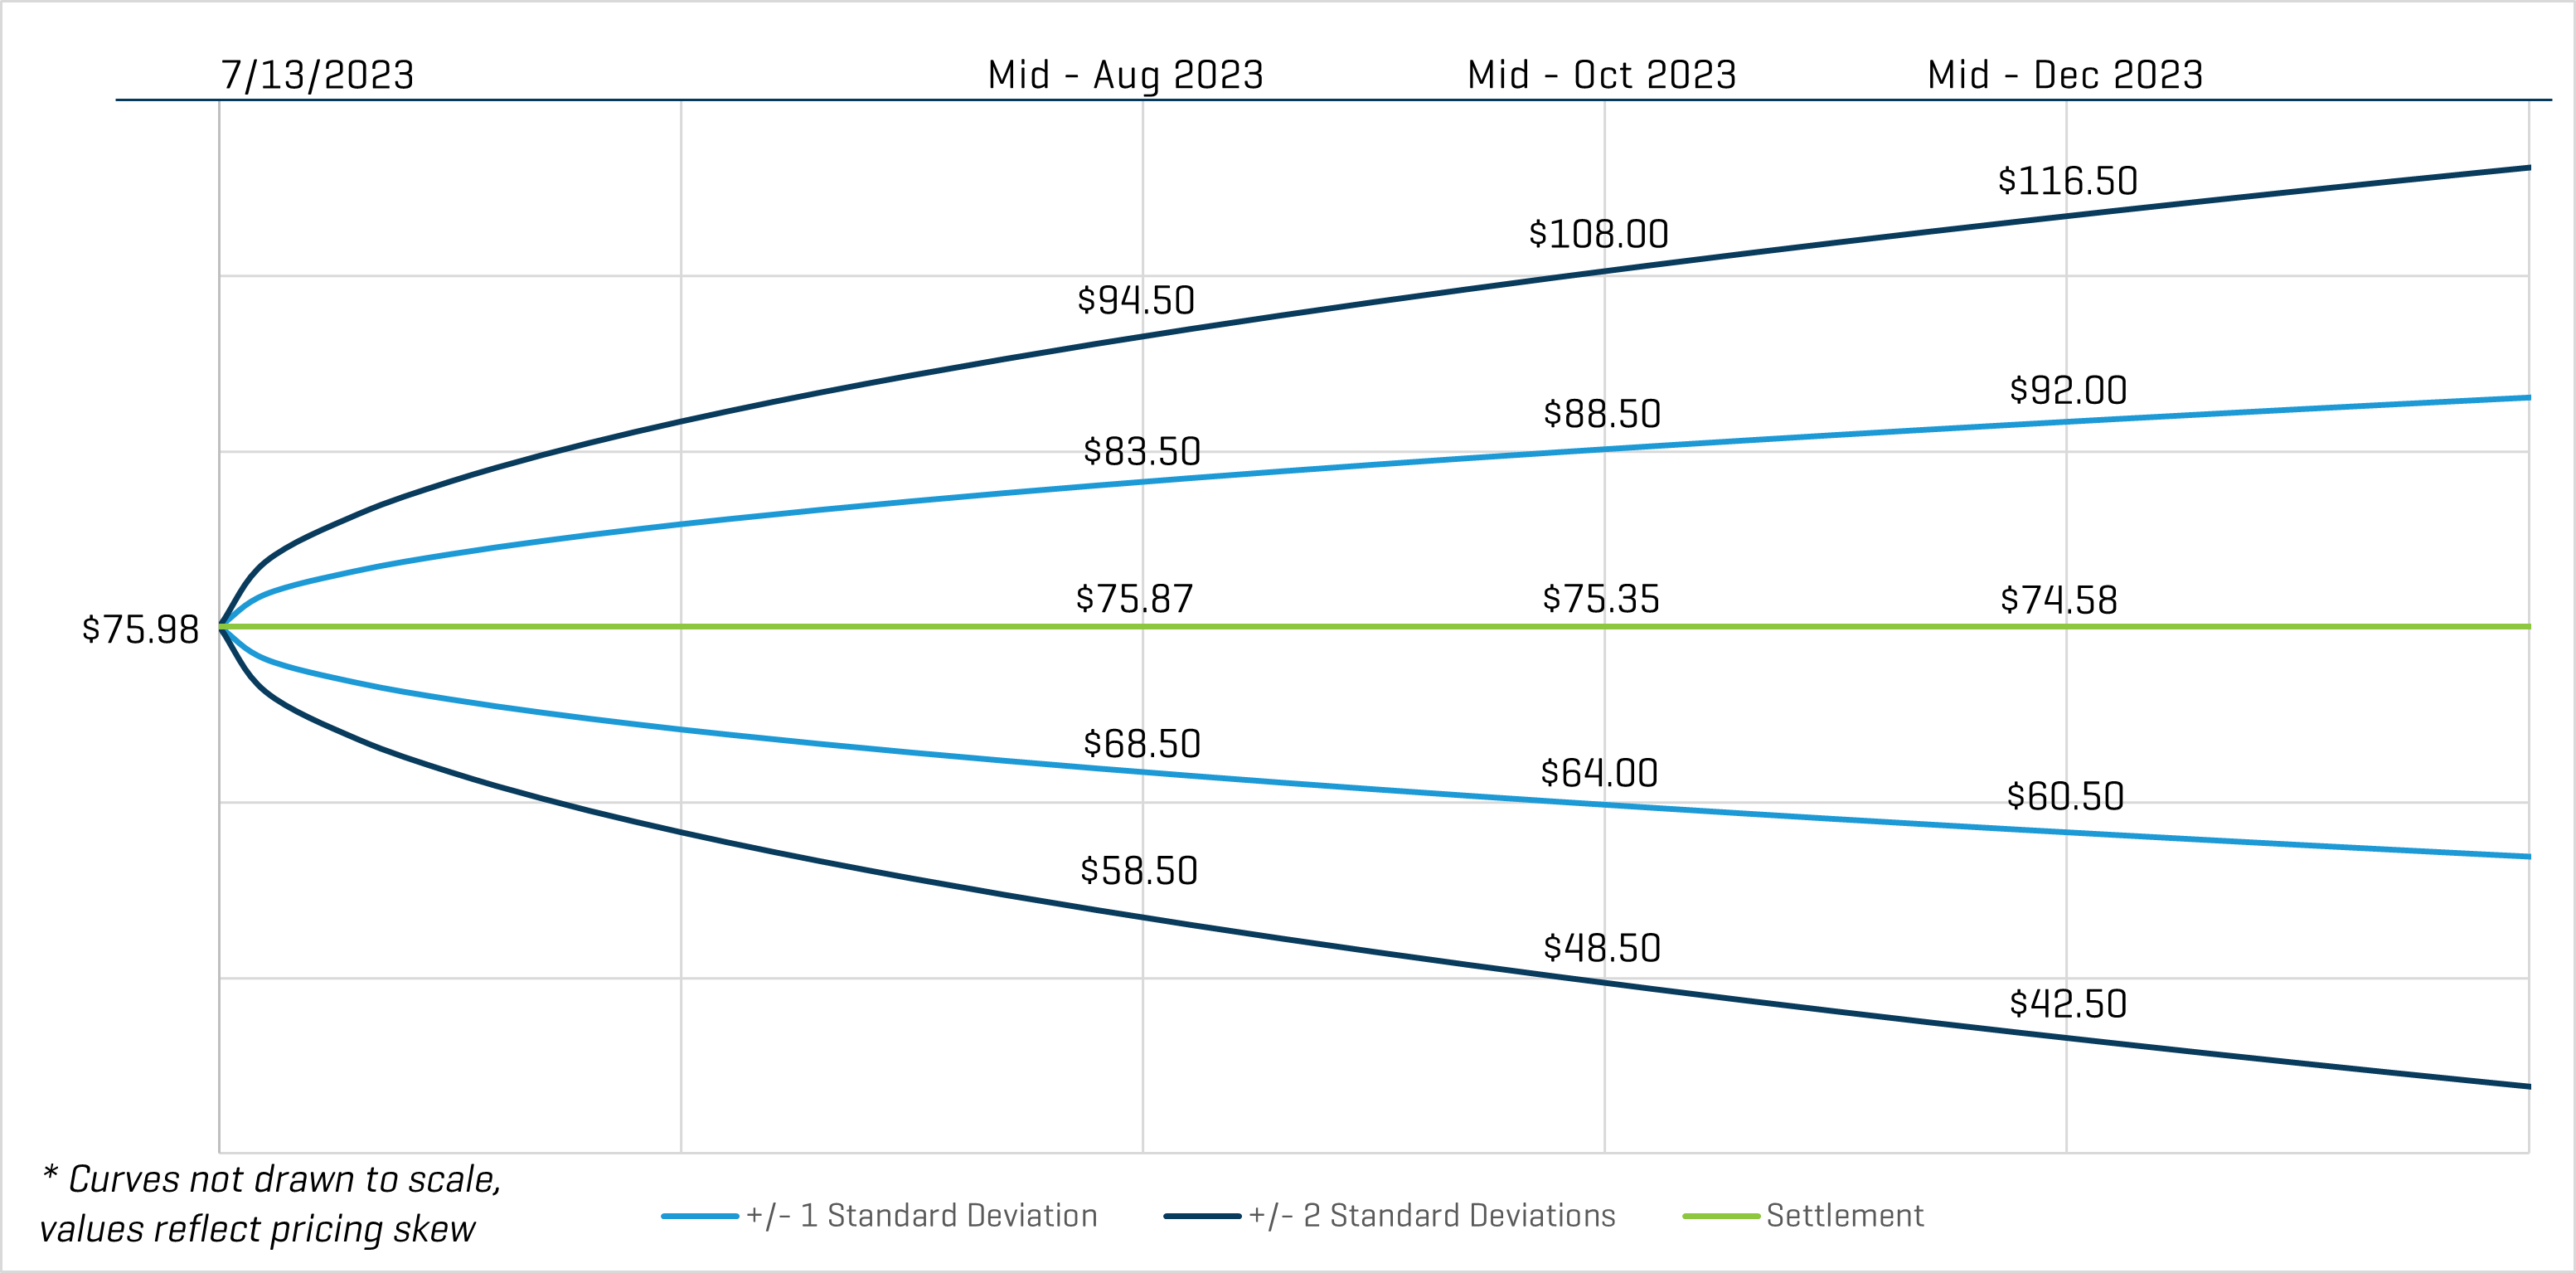
Based on these current prices, the markets indicate there is a 68% chance oil prices will range from $64.00 and $88.50 per barrel in mid-October 2023. Likewise, there is roughly a 95% chance that prices will be between $48.50 and $108.00. By mid-December 2023, the one-standard deviation (1σ) price range is $60.50 to $92.00 per barrel, and the two-standard deviation (2σ) range is $42.50 to $116.50 per barrel.
Key Takeaways
Remember that option prices and models reflect expected probabilities, not certain outcomes, but that does not make them any less useful. So far in 2023, crude oil prices have primarily remained within the range of $70 to $80 per barrel. As such, we have seen volatility decrease significantly compared to 2022, which is evidenced by the futures price ranges observed. For mid-December 2023 pricing as of July 13, 2023, the 1σ range had a spread of $31.50 per barrel, and the 2σ range has a spread of $74.00 per barrel. For comparison, in 2022 we observed 1σ and 2σ price ranges in excess of $65.00 and $150.00, respectively.
- Table 6.07.B. Capacity Factors for Utility Scale Generators Primarily Using Non-Fossil Fuels, Electric Power Monthly, U.S. Energy Information Administration.
- “Why we’re talking about the Texas power grid again,” Zachary B. Wolf, CNN, June 22, 2023.
- Interval Generation by Fuel Report, ERCOT.
- “Nebraska solar farm crippled by hail, underscoring power source’s fragility,” Thomas Catenacci, Fox News, June 29, 2023.