中文
中文


Energy markets continued to improve during the second quarter of 2018. Crude prices added to gains even amidst future uncertainty, highlighted by continued backwardation. Permian Basin activity remains the key driver of U.S. unconventional activity and has supported the continued recovery of sectors such as production and well services, energy equipment manufacturers, and contract land drilling, which has stabilized the gains achieved in recent quarters.
Key Q2 Takeaways:
- Crude oil prices continued to climb, while backwardation illustrates future pricing concerns
- Permian Basin remains the primary source of North American (“NAM”) activity
- Financial performance, including revenue growth and margin expansion, leveling out following a period of significant improvement in the energy service and equipment segment. Production and well services, energy equipment, and land drilling remain the leaders year over year, while offshore services remain challenged, although the decline slowed meaningfully in the quarter
- Public markets valuation levels rose over the quarter and began to correlate more closely with the broader market, possibly indicating a softening in production growth concerns
- Production and well services transactions remain most active by transaction count and dollar value, while offshore services remain depressed
Crude Oil and Natural Gas
Crude oil prices increased from $64.94 to $74.15 during the second quarter (a 14.2% increase) driven by sustained OPEC compliance with respect to production cuts, shortfalls in Venezuelan production, increased potential for conflict in the Middle East (e.g. Iran) and continued crude inventory draws driven in part by an outage in Canada. This rally has been sustained after the runup from $46.04 at the end of the second quarter of 2017 to $64.94 at the beginning of the second quarter of 2018, an increase of more than 40%. Despite low inventory levels, which approached the five-year historical low, natural gas prices edged lower by the end of the second quarter 2018 due to an outlook for persistent production and future excess supply.
Crude Oil (WTI) Prices and Natural Gas (Henry Hub) Prices
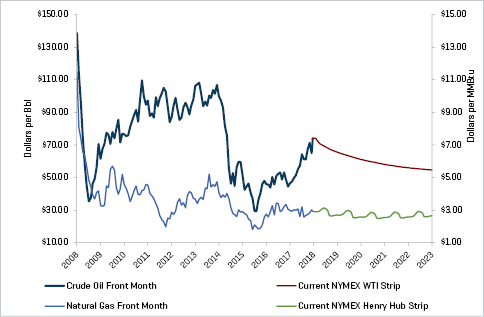
Source: Bloomberg, as of July 1, 2018
These positive developments were partially offset by continued efficiency and growth in North American production and a commensurate surge in U.S. crude oil output. The average U.S. land rig count increased by 47 rigs, approximately 4.8%, from 981 to 1,028 rigs during the quarter, of which 31 rigs were added to the Permian Basin, representing an increase of approximately 7.0% in the region.
Historical U.S. Land Rig Count
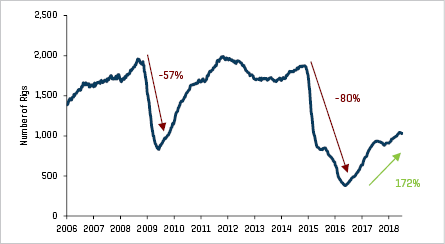
Source: Baker Hughes
Increase in U.S. Land Rig Count by Basin Since May 2016
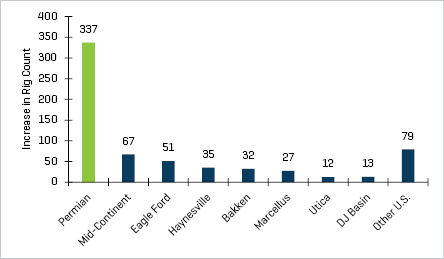
Source: Baker Hughes
Backwardation in the crude oil market continues to highlight concerns regarding longer-term crude pricing. The NAM market also continues to benefit from drilling and completion efficiencies, although the pace of efficiency is anticipated to moderate. Despite increases in pricing in certain service segments, the enhanced production outweighs the incremental costs.
Continued Financial Improvement
First-quarter 2018 financial performance leveled out following a period of improvement in the energy service and equipment segment. First-quarter total cumulative revenue decreased 2.4% compared with the fourth quarter of 2017 while increasing 14.8% compared with first-quarter 2017 levels for the energy service and equipment segment (with meaningful variance by sub-sector). First-quarter 2018 (excluding offshore construction and offshore drilling) EBITDA margins remained relatively stable at 12.7% compared with fourth-quarter 2017 results of 13.7%, and remained above first-quarter 2017 results of 10.4%. Subsectors that had experienced significant margin expansion in previous quarters, such as geophysical, production and well services, and land drilling, leveled off meaningfully, which drove the overall industry’s margin stabilization. Despite remaining well above first-quarter 2017 levels, first-quarter 2018 EBITDA results stabilized as well for the production and well services, and land drilling subsectors. Production and well services EBITDA grew 8.4% and 198.3% compared with the fourth quarter of 2017 and the first quarter of 2017, respectively, and land drilling EBITDA grew 0.3% and 80.8% compared with the fourth qarter of 2017 and the first quarter of 2017, respectively. During the same period, offshore drilling continued to be a laggard with first-quarter 2018 revenue declining by 5.6% and 26.7% from fourth-quarter 2017 and first-quarter 2017 levels, respectively.
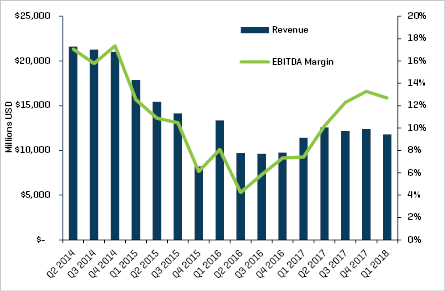
Production & Well Services Quarterly Revenue and EBITDA Margins
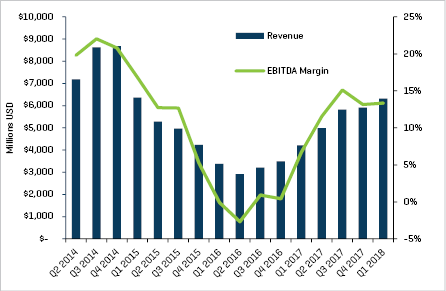
Source: S&P Capital IQ and Stout
Land Drilling Quarterly Revenue and EBITDA Margins
Source: S&P Capital IQ and Stout
Energy Equipment Manufacturers Quarterly Revenue and EBITDA Margins
Source: S&P Capital IQ and Stout
Rising Valuation Levels Beginning to Correlate with Broader Market
Public valuations for energy companies experienced less volatility during the quarter, with the Philadelphia Oil Service Sector Index (OSX) increasing 14.1% (closely tracking the gain in crude oil prices). The S&P 500 Index only increased 2.9% during the quarter. After meaningfully higher volatility in the first quarter of 2018, which exhibited 23 days of 1% price swings, the general market (S&P 500) volatility slowed in the second quarter with 13 days of 1% price swings. Recent energy performance may indicate a softening of concerns regarding rapid production growth due to elevated crude oil prices encouraging more activity. In fact, a number of research analysts have recently highlighted concerns about crude oil supply in future years due to persistent underinvestment during the downturn.
Equity Index Performance - OSX
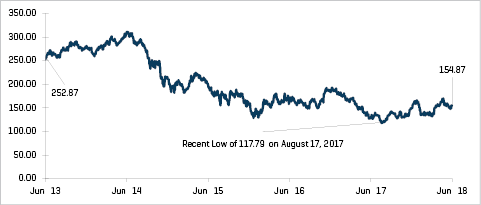
Source: S&P Capital IQ
Equity Index Performance
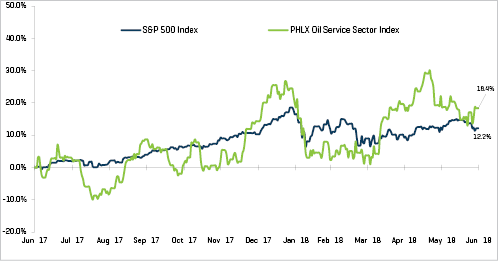
Source: S&P Capital IQ
Production and well services and energy equipment manufacturers saw the largest margin expansion in the first quarter of 2018 from the first quarter of 2017, with production and well services margins expanding from 6.7% in the first quarter of 2017 to 13.3% in the first quarter of 2018, and energy equipment manufacturers’ margins expanding from 7.4% in the first quarter of 2017 to 12.7% in the first quarter of 2018.
Offshore Drilling Quarterly Revenue and EBITDA Margins
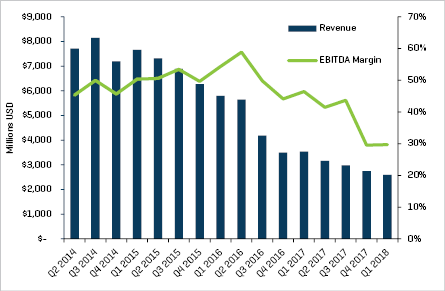
Source: S&P Capital IQ and Stout
RECENT M&A TRENDS
M&A Activity Has Stabilized
Energy service and equipment M&A activity remained relatively stable (by count) in the second quarter of 2018 compared with prior-quarter levels while dollar volumes dipped. Overall, second-quarter 2018 activity totaled 23 transactions, equal to the first-quarter 2018 activity and above second-quarter 2017 levels, while dollar volumes in the second quarter of 2018, of $458 million, were almost half the dollar volume in first-quarter 2018 levels but similar to the second-quarter 2017 level of $549 million. Transaction dollar volumes still remain well below 2011 through 2014 “elevated” historical average quarterly dollar volume of $2.4 billion. The outlook for remaining 2018 M&A and financing activity in the sector is positive as crude price gains hold, and as many companies require growth capital and owners continue to assess exits.
NAM Oilfield Services and Equipment Transactions
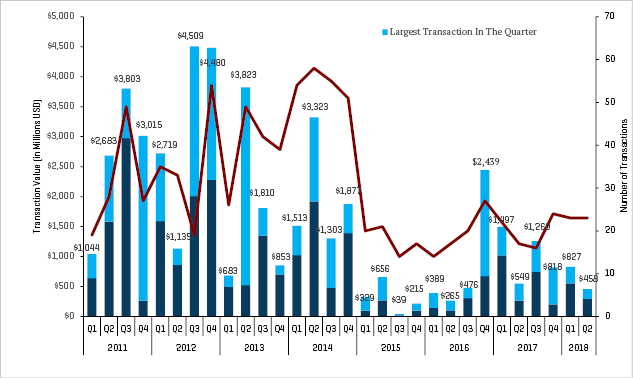
Source: 1Derrick, S&P Capital IQ, and proprietary information
Note: Q3 2015 excludes the Schlumberger/Cameron transaction value of $14.8 billion and Q4 2016 excludes the Baker Hughes/GE transaction value of $32.0 billion for scaling
Production and well services transactions have remained the most active OFS sector in NAM by transaction count and dollar value (excluding the AKITA acquisition of Xtreme Drilling, which accounted for $162 million of the total drilling sub-sector dollar value of $166 million). Energy equipment manufacturing also remains very active by the number of transactions. Offshore services continued to represent the weakest sector (by transaction count), while drilling saw more activity in the second quarter of 2018, with three transactions, approaching its full-year 2017 tally when it reached only four transactions for the entire year.
Q2 2018 NAM Energy Service and Equipment Transaction Count by Sector
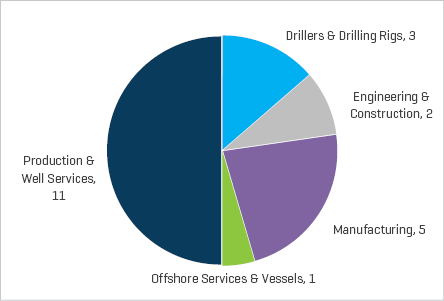
Source: 1Derrick, S&P Capital IQ, and proprietary information
Q2 2018 NAM Energy Service and Equipment Transaction Value by Sector (Millions USD)
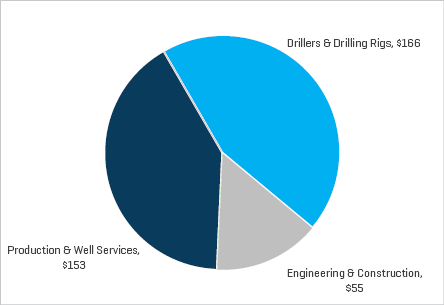
Source: 1Derrick, S&P Capital IQ, and proprietary information
Q2 2018 NAM Energy Service and Equipment Transaction Count by Buyer Profile
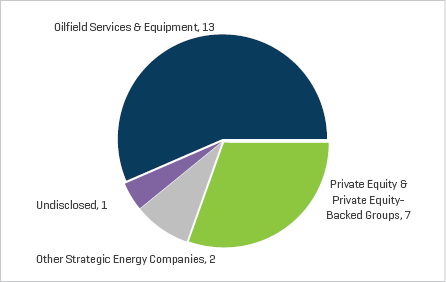
Source: 1Derrick, S&P Capital IQ, and proprietary information