Deutsch


Die Instabilität rund um die Straße von Hormus ist längst nicht mehr nur eine geopolitische Angelegenheit, sondern hat sich für Verpackungsunternehmen zu einer Kostenfrage entwickelt. Beispielsweise stieg der Brent-Ölpreis von etwa 69 US-Dollar pro Barrel vor der Eskalation im Februar 2026 auf einen Höchststand von über 138 US-Dollar Anfang April und schwankte den Sommer über stark, während die Spannungen zwischen den USA und Iran immer wieder aufflammten und nachließen. Mitte August lag der Ölpreis bei knapp 95 Dollar pro Barrel, ein deutlicher Anstieg gegenüber den rund 70 Dollar, die noch wenige Wochen zuvor nach einem kurzlebigen Waffenstillstand notiert wurden.
Das Ergebnis ist kein einheitlicher Anstieg der Verpackungskosten, sondern eine Reihe sich überschneidender Schocks, die sich auf jedes Substrat unterschiedlich auswirken. Kunststoff ist am unmittelbarsten von den Auswirkungen petrochemischer Ausgangsstoffe betroffen, während Papier, Metall und Glas die gestiegenen Inputkosten über Energie-, Fracht- und Rohstoffkosten sowie Kapazitätsengpässe auffangen. Für Unternehmer und Investoren sind die entscheidenden Fragen, wie schnell die Kosten beim Verarbeiter ankommen, wie lange sie bestehen bleiben und in welchem Umfang sie an die Kunden weitergegeben werden können.
Kunststoffverpackungen spüren die Auswirkungen zuerst und am stärksten.
Von allen Materialien, die von Verpackungsherstellern verwendet werden, ist Kunststoff am engsten mit den Petrochemie- und Energiemärkten verbunden. Die Kunststoffe, aus denen die meisten Verpackungskomponenten hergestellt werden (Polyethylen [PE], Polypropylen [PP], Polyethylenterephthalat [PET] und Polystyrol [PS]), werden aus Rohstoffen gewonnen, die aus Öl und Gas stammen, wobei der Anteil an Erdöl je nach Kunststoff, Herstellungsverfahren und Region variiert.
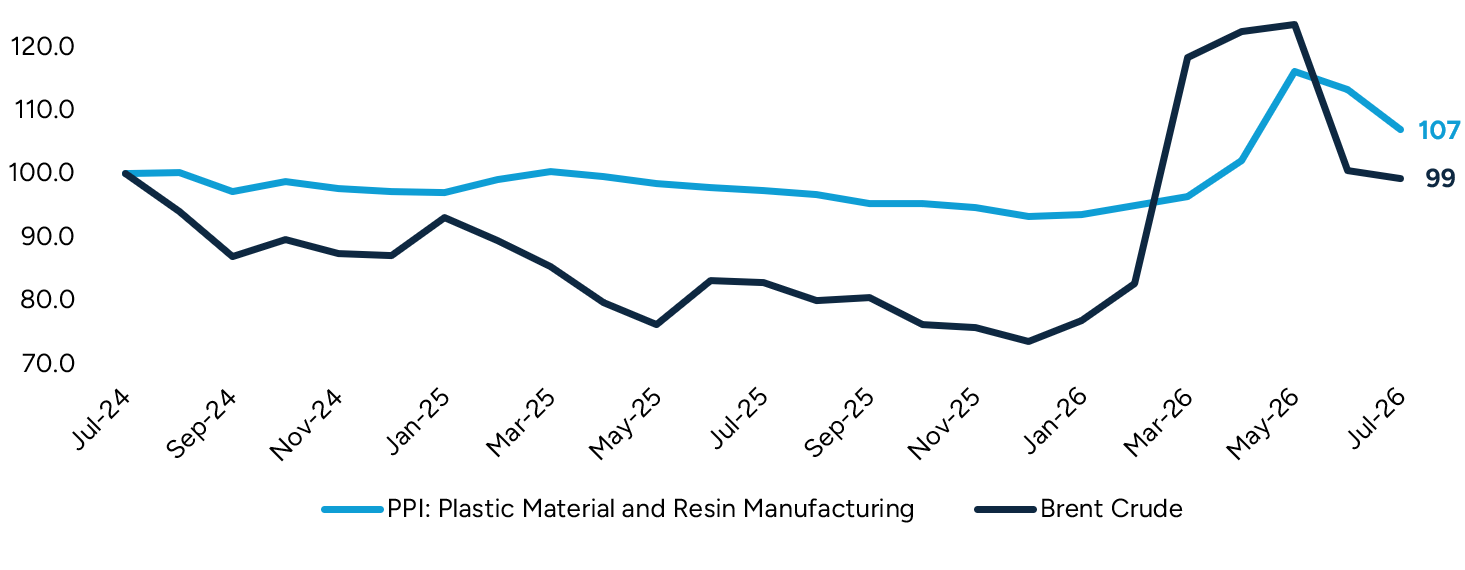
Allein Rohöl erklärt den Anstieg der Harzpreise im Jahr 2026 nicht. Kunststoff- und petrochemische Vorproduktmengen (z. B. Ethylen, Propylen und Paraxylen) aus dem Nahen Osten sind hinter der Straße von Hormus gestrandet, was das globale Angebot verknappt und die Kunststoffpreise schneller steigen lässt als die zugrunde liegenden Rohstoffkosten. In Europa zeigt der Index von Flexible Packaging Europe’, dass der Markt für biaxial orientierte Polypropylenfolie (BOPP) im zweiten Quartal 2026 um 97 % gestiegen ist, PET-Folie um 40 %, hochdichtes Polyethylen (HDPE) um 38 % und niedrigdichtes Polyethylen (LDPE) um 31 %. US-Polyethylenhersteller waren weniger dem unmittelbaren Ölpreisschock ausgesetzt, aber starke Exportnachfrage führte im März und April 2026 zu einer Auslastung der Anlagen von etwa 98–99 %, wodurch die Verfügbarkeit auf dem Inlandsmarkt verknappte und die Spotpreise für PE in die Höhe trieb, obwohl die Rohstoffkosten vergleichsweise stabil blieben. Die Lagerbestände wurden im Mai wieder aufgefüllt, wodurch sich der Druck etwas verringerte.
Der Konflikt in der Straße von Hormus hat unmittelbar zu einem Anstieg der Vorleistungskosten geführt. Etwa ein Fünftel des welt’en Öls wird normalerweise über diese Wasserstraße transportiert, und der Schiffsverkehr ist jedes Mal, wenn die Kämpfe wieder aufflammen, stark zurückgegangen – zuletzt, nachdem die USA Mitte Juli eine Seeblockade wieder eingeführt hatten. Da es 60 bis 90 Tage dauert, bis sich höhere Materialkosten bei den Verpackungsherstellern niederschlagen, setzt jeder erneute Preisanstieg die Uhr zurück, noch bevor die Auswirkungen der vorherigen Erhöhung abgefedert sind, sodass viele Verarbeiter eine Preiserhöhung gerade erst verkraftet haben, wenn schon die nächste eintritt.
Abbildung 1: Entwicklung des Ölpreises
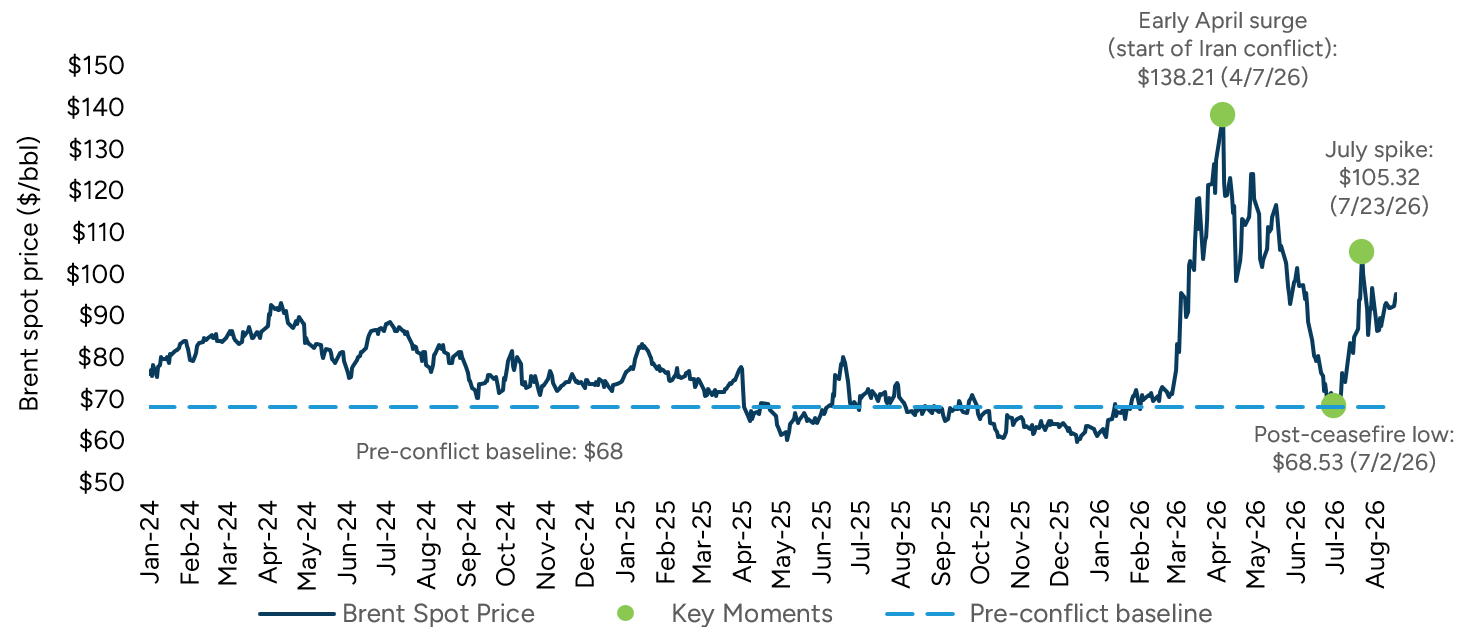
Abbildung 2: Harzpreis im Vergleich zum Ölpreis (indexiert auf Juli 2024)
Papier, Metall und Glas sind nicht immun
Papier, Metall und Glas sind keine Derivate von Kunststoffharz, aber die Preise für Fracht, Energie und Metallrohstoffe sind allesamt in die Höhe geschossen und üben einen Aufwärtsdruck auf die Inputkosten aller Verpackungssubstrate aus. Katar zählt zu den weltweit’größten Exporteuren von Flüssigerdgas (LNG), und seine Exporte müssen durch die Straße von Hormus passieren. Papier-, Metall- und Glashersteller nutzen Erdgas hauptsächlich zur Energieerzeugung während des Herstellungsprozesses, sodass höhere Gaspreise ihre Betriebskosten unmittelbar erhöhen, anstatt sich erst über einen mehrstufigen Produktionsprozess auszuwirken.
Die Seefrachtpreise werden von anderen Faktoren als vom Konflikt beeinflusst. Die Kosten pro 40-Fuß-Container sanken Ende April auf 2.232 US-Dollar, da die Frachtraten auf der Asien-Europa-Route aufgrund schwacher Nachfrage und Überkapazitäten nachgaben, bevor sie bis zum 27. August angesichts einer stärkeren Nachfrage auf der transpazifischen Route und einer durch Zölle bedingten Vorverlagerung der Transporte auf 4.473 US-Dollar stiegen. Nicht der Konflikt, sondern Überkapazitäten und Handelspolitik scheinen die Raten zu bestimmen, sodass eine Einigung am Golf keine Entlastung bei den Frachtkosten bringen dürfte. Kurzfristig sind die zusätzlichen Kosten auf Zuschläge zurückzuführen, da mehrere Fluggesellschaften mit Wirkung zum August 2026 Notfall-Treibstoffzuschläge eingeführt haben.
Containerboard-Produzenten geben höhere Inputkosten weiter
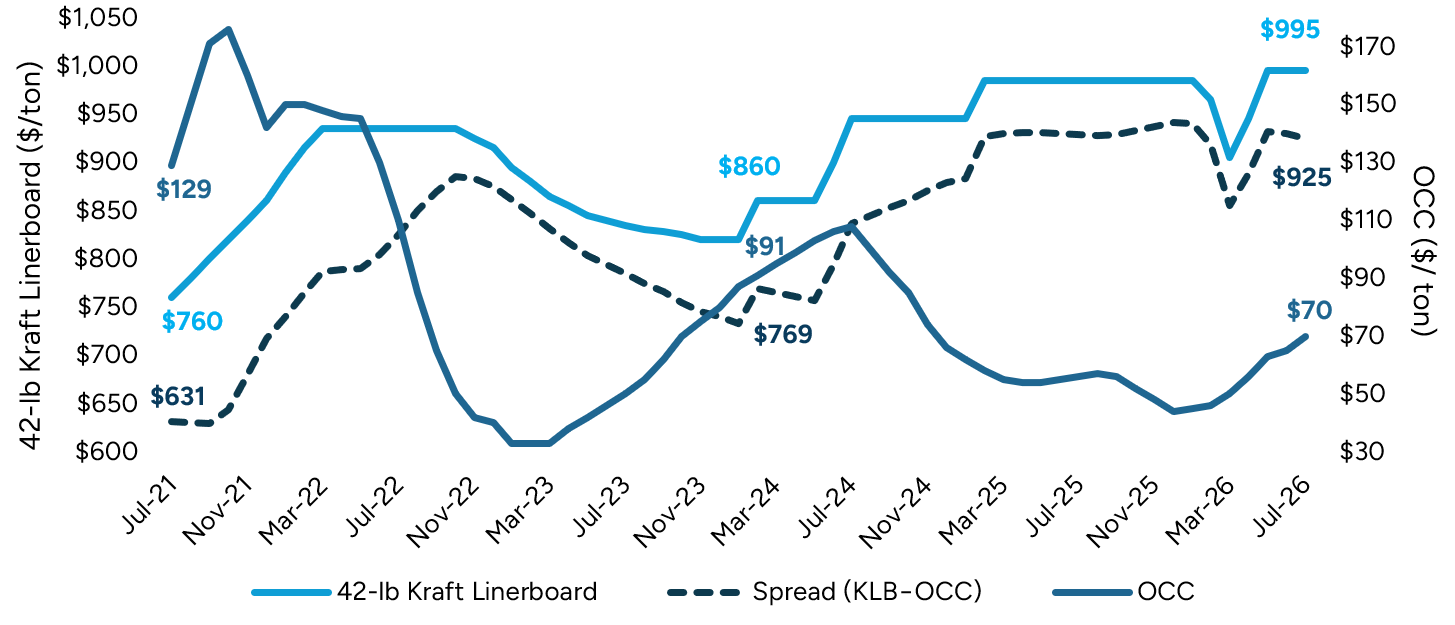
Sechs der größten nordamerikanischen Hersteller, darunter International Paper, Smurfit Westrock, Georgia-Pacific und PCA, setzten im Jahr 2026 zwei Runden von Preiserhöhungen durch, wobei im März und Juni Erhöhungen von 50–70 US-Dollar pro Tonne angekündigt wurden. Eine dritte Runde ist für den 1. September angesetzt, wobei die PCA eine beispiellose Erhöhung um 140 Dollar pro Tonne mit Wirkung zu diesem Datum angekündigt hat. Führungskräfte des Unternehmens verwiesen auf steigende Kosten und Energiepreisdruck im Zusammenhang mit dem Konflikt im Nahen Osten, zusätzlich zu einer Welle von Werksschließungen im Jahr 2025. Diesel, der im Jahr 2025 etwa 50 % über dem Vorkrisenniveau liegt, sorgt weiterhin für höhere Lieferkosten bei eingehendem Holz und ausgehenden Kartons. Auch die Preise für Altwellpappe (OCC), die als Recyclingfaser in die Wellpappenherstellung einfließt, sind stark gestiegen – von rund 44 US-Dollar pro Tonne im Dezember 2025 auf 70 US-Dollar pro Tonne im Juli 2026.
Linerboard-Preise entkoppeln sich von denen für OCC (Altwellpappe)
Obwohl der OCC-Preis gestiegen ist, haben sich die Preise für fertige Wellpappe noch stärker und schneller entwickelt, wodurch die traditionelle Beziehung zwischen beiden aufgebrochen wurde. In der Vergangenheit wurden die Preise für Wellpappenrohpapier stärker von der Nachfrage der Endverbraucher und dem zugrunde liegenden Gleichgewicht zwischen Angebot und Nachfrage bestimmt, aber mittlerweile treiben die Lieferanten Preiserhöhungen angesichts eines deutlich breiteren Spektrums an Kosten- und Betriebsdruck durch. Infolgedessen haben sich die Preise für Linerboard und OCC zunehmend auseinanderentwickelt, wobei Fracht-, Energie-, Holz- und Chemikalienkosten sowie Kapazitätsengpässe die Preise für fertiges Wellpappenrohpapier unabhängig von den Preisbewegungen bei Recyclingfasern beeinflussen. Was einst eine relativ unkomplizierte Beziehung zwischen Angebot und Nachfrage war, wird nun durch zahlreiche externe Schocks im gesamten System geprägt.
Aluminium sieht sich einem zweiten Kostendruck ausgesetzt
Metall hat eine direktere Verbindung zur Region. Die Golfregion liefert etwa 10 % des welt’weit exportierten Aluminiums, und im März 2026 beschädigten iranische Angriffe zwei große Aluminiumhütten im Golf; die größere der beiden rechnet erst Anfang 2027 mit einer vollständigen Wiederherstellung. Die Preise erreichten Anfang Juni bereits 3.700–3.800 US-Dollar pro Tonne, bevor sie auf das aktuelle Niveau von etwa 3.200 US-Dollar zurückgingen; Branchenanalysten gehen davon aus, dass eine erneute konfliktbedingte Unterbrechung der Lieferungen die Preise wieder in diesen Bereich treiben könnte. Diese Schätzung umfasst höhere Transportkosten und kriegsbedingte Versicherungsprämien, die zum Basispreis des Metalls hinzugerechnet werden. Das Schmelzen ist energieintensiv und verursacht zusätzliche Kosten, wo die Energie gasbefeuert ist. Unternehmen, die Dosen und Folienverpackungen herstellen und bereits mit Kostensteigerungen durch die ab 2025 geltenden Zölle auf Stahl und Aluminium konfrontiert waren, sehen sich nun einer zweiten Welle von Kostensteigerungen gegenüber.
Glas ist am längsten Energie ausgesetzt
Glas weist von den dreien die höchste Energieintensität auf. Das Schmelzen läuft kontinuierlich bei hohen Temperaturen, sodass ein Ofen nicht wie eine Verarbeitungsanlage bei einem Preisanstieg gedrosselt oder stillgelegt werden kann, und die Kosten werden nahezu unmittelbar weitergegeben. Einige Hersteller von Glasflaschen haben über Liefer- und Verfügbarkeitsprobleme im Zusammenhang mit der allgemeinen globalen Energiekrise berichtet, auch wenn die Auswirkungen in öffentlichen Berichten noch ’ nicht so eindeutig quantifiziert wurden.
Anlage Nr. 3 Materialübergreifender Vergleich (indexiert auf Juli 2024)
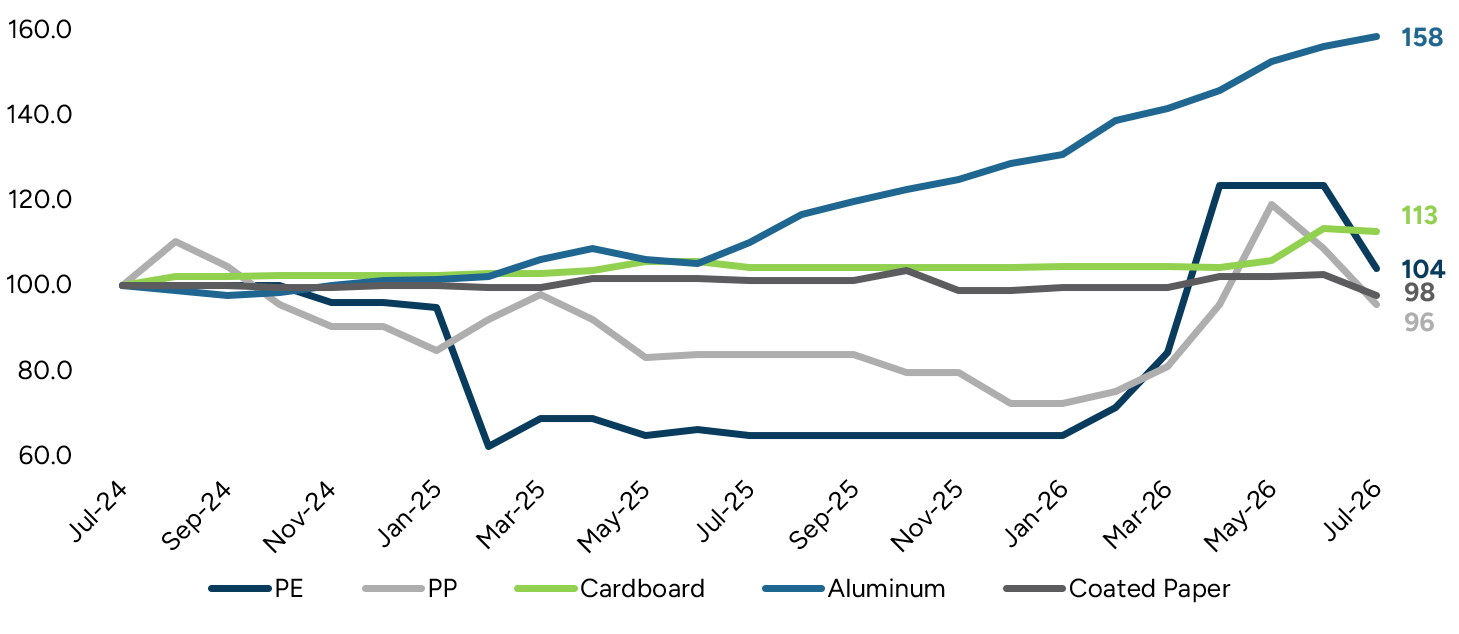
Abbildung 4: 42-Pfund-Kraft-Linerboard im Vergleich zum OCC-Spread
Bedeutung für Unternehmer und Investoren
Da das beobachtete Muster aus starken Ausschlägen besteht, auf die teilweise Rückgänge folgen, spiegeln die Kursbewegungen eher wiederholte Schocks wider als die Festlegung einer neuen Untergrenze für künftige Kurse. Eine Lockerung ist jedoch nicht dasselbe wie ein Ausklingen. Es liegen noch Monate der Aufarbeitung vor, und wiederholte Rückfälle sorgen weiterhin dafür, dass die Uhr zurückgesetzt wird, bevor sich die Kosten vollständig normalisieren. Dieses Basisszenario hängt auch von der Angebotsreaktion ab, die sich zwischen Öl und Gas unterscheidet. Öl kann auf kurzzyklische Schieferölproduktion und innerhalb von Monaten verfügbare OPEC-Reservekapazitäten zurückgreifen, während der Aufbau von LNG-Verflüssigungskapazitäten Jahre dauert und es keinen vergleichbaren Swing-Produzenten gibt. Dadurch normalisieren sich gasgebundene Faktoren langsamer. Glaslastige Verpackungshersteller sollten mit einer längeren Erholungszeit rechnen, als es der Ölpreistrend in Abbildung 1 vermuten lässt.
Die Vertragsstruktur könnte Gewinner und Verlierer voneinander trennen
Die Vertragsstruktur ist das wichtigste Unterscheidungsmerkmal in der gesamten Branche. Unternehmen mit indexbasierten oder Kostenweitergabe-Klauseln sind weitgehend geschützt, während diejenigen ohne solche Regelungen den Anstieg unmittelbar tragen und sich jede Verzögerung weiter gegen die 60- bis 90-tägige Preisanpassungsverzögerung summiert. Die Weitergabe erfolgt jedoch nicht automatisch. Kunden, die selbst unter Margendruck stehen, akzeptieren Erhöhungen nicht zuverlässig, sodass dieses Vorgehen selbst dann ein Umsetzungsrisiko birgt, wenn der Vertrag dies zulässt. Diese Diskrepanz tritt bereits in laufenden Transaktionsprozessen zutage, in denen Käufer gezielte Fragen zur Vertragsstruktur und Preisanpassungsgeschwindigkeit des ’Unternehmens stellen, statt sich nur auf die jüngste Finanzentwicklung zu konzentrieren. Die sich vergrößernde Kostendifferenz zwischen den Substraten belebt auch Substitutionsdiskussionen wieder, die zum Erliegen gekommen waren, solange die Preise stabil blieben.
Quellen: *CNBC*, *Al Jazeera*, *Reuters*, *Plastics Technology*, *PlasticsToday*, *Flexible Packaging Europe*, *GEP*, *Packaging Dive*, *Discovery Alert*, *Xeneta*, *Drewry*, *Suaid Global*, *Middle East Insider*, *The National*, *Wikipedia* (*Krise in der Straße von Hormus 2026* / *Kraftstoffkrise im Iran-Krieg 2026*), Stand: 27. August 2026