Deutsch


EMERGING FROM RECENT VOLATILITY
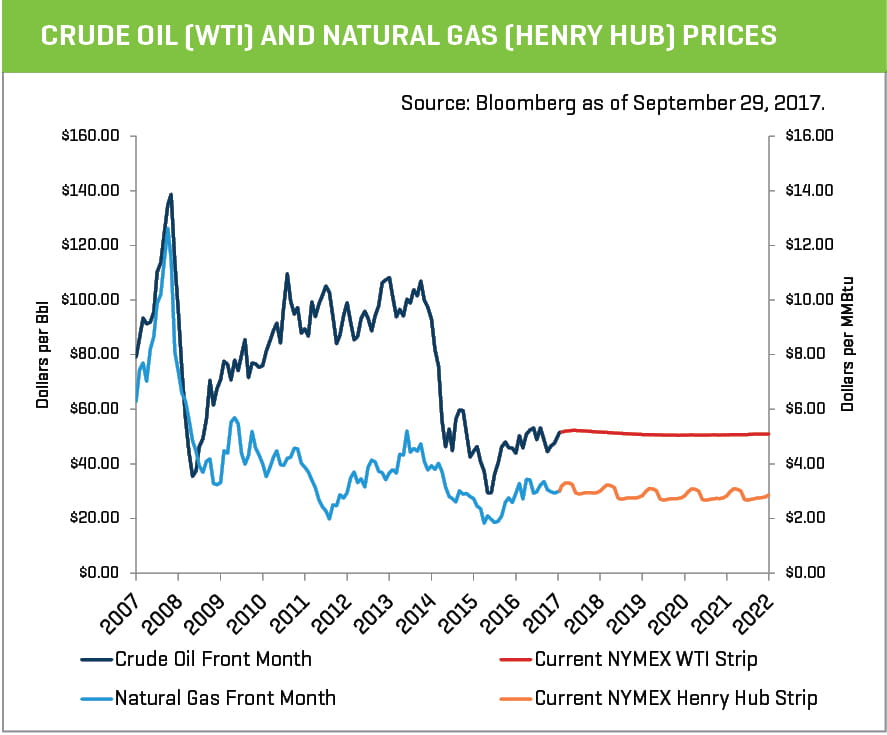
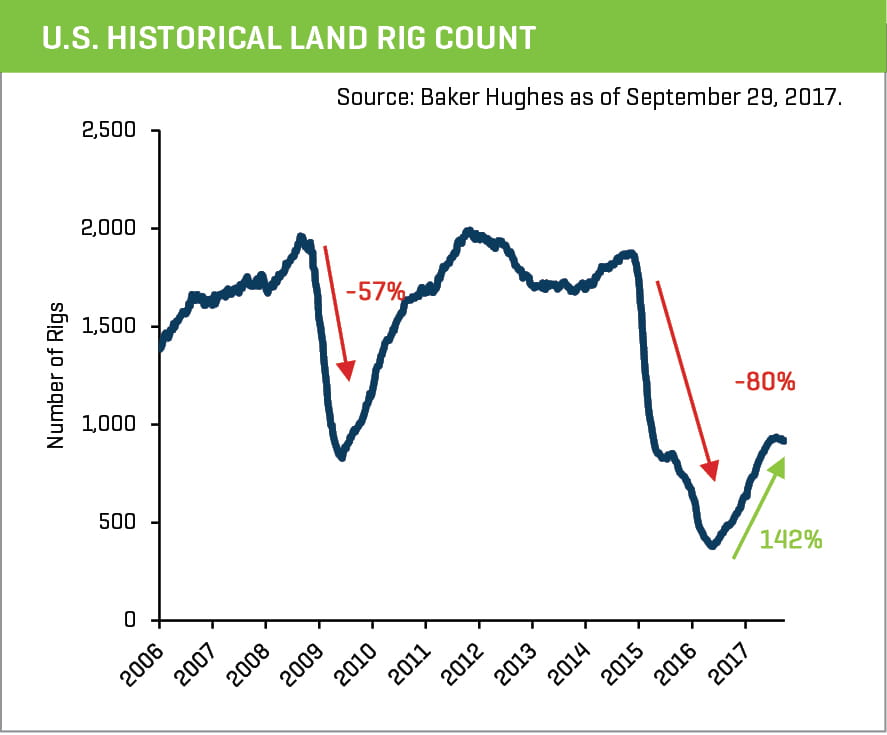
The U.S. energy market witnessed meaningful volatility in the third quarter, whipsawed between global crude inventory draws (a positive for market balance), a stalling (and recently declining) rig count and uncertainty regarding E&P company 2018 budgets. The average U.S. land rig count in the third quarter was 927 rigs, a 6% increase compared with the average second-quarter rig count of 874 rigs and an increase of 153 rigs (+21%) between the first and second quarters of 2017. WTI crude oil prices ranged from $44.23 (on July 7, 2017) to $52.22 bbl (on September 25, 2017), further highlighting the variance during the quarter. Despite the flattening rig count, well service intensity has continued to increase. The expectation is that lateral lengths (and horizontal frac stages), proppant use and overall completion complexity will continue to increase. This should lead to a more robust energy service and equipment market, particularly for completions-oriented businesses. Conversely, more commoditized service businesses that are more dependent on drilling rig counts may witness market weakening.
Recent Capital Markets Trends
CONTINUED IMPROVEMENT IN FINANCIAL METRICS
There was a continued trend of improving revenue and margins for many energy equipment and service businesses, although the pace of improvement has slowed for many companies. Second-quarter 2017 revenue increased 4% and 63% compared with first-quarter 2017 and second-quarter 2016 levels, respectively, for production and well service companies. Second-quarter 2017 EBITDA margins moved to 7% from 6% and -17.5%, respectively, versus margins in the first quarter of 2017 and the second quarter of 2016. The substantial ramp-up of drilling and completion activity translated to better performance. Meaningful shortages of sand and pressure pumping capacity (in certain regions) led to pricing increases in these sectors. This trend is likely to continue into third-quarter financial results, although recent reactivations of pressure pumping fleets, new sand capacity and better logistics should temper price increases for the remaining portion of 2017.
DESPITE OVERALL POSITIVE TRENDS, ENERGY SERVICES EQUITY VALUATIONS REMAIN CHALLENGED
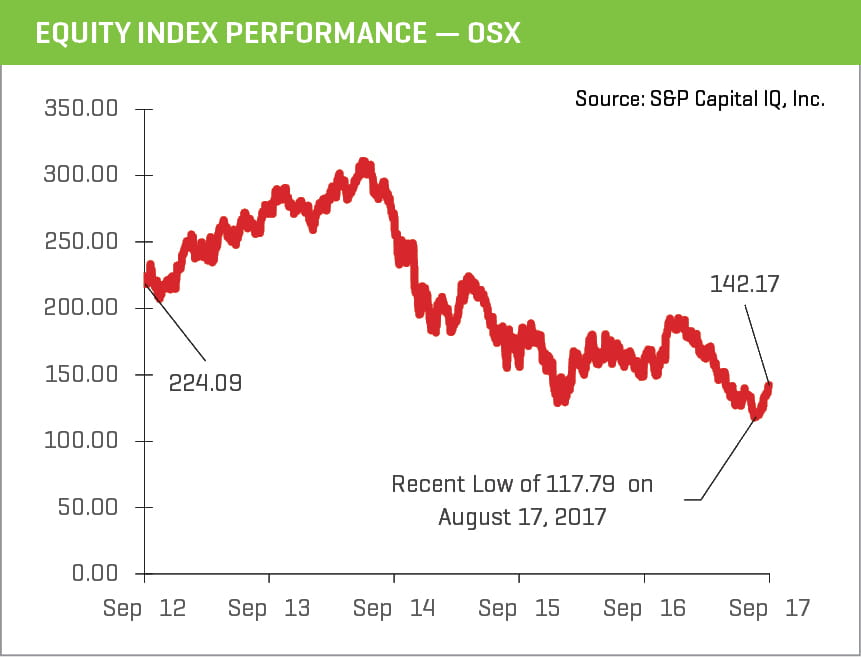
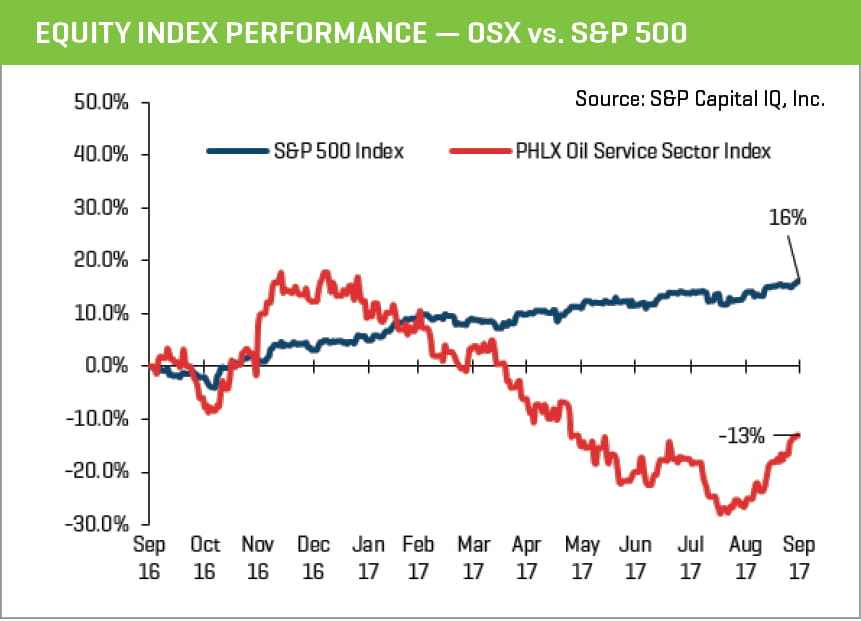
Valuations for a number of public energy service companies bottomed during the third quarter, with the Philadelphia Oil Service Sector Index (OSX) dipping to a low of 117.79, a decline of 36% from 183.79 at the beginning of 2017, a decline of 62% from a five year high of 308.04 in July 2014. The meaningful gains from late 2016/early 2017 that were driven by recovering crude prices (and a better industry outlook) and rapidly increasing rig counts were replaced by fears of excess production. With these tempered expectations, the IPO market for energy service companies slowed from the burst of activity in late 2016/early 2017.
While near-term crude prices have recently improved to $51.67 as of the end of the quarter, the forward curve is remarkably flat (average 2018 and 2019 WTI prices are $51.88 and $50.96, respectively), which has tempered the outlook for 2018. Onshore service company valuations are likely to be anchored until there is greater clarity on E&P company budgets. Offshore-focused businesses are likely to be commodity price-driven with a keen focus on new tendering activity and pricing.
(click to view larger chart)
Recent M&A Trends
M&A ACTIVITY HAS TEMPERED
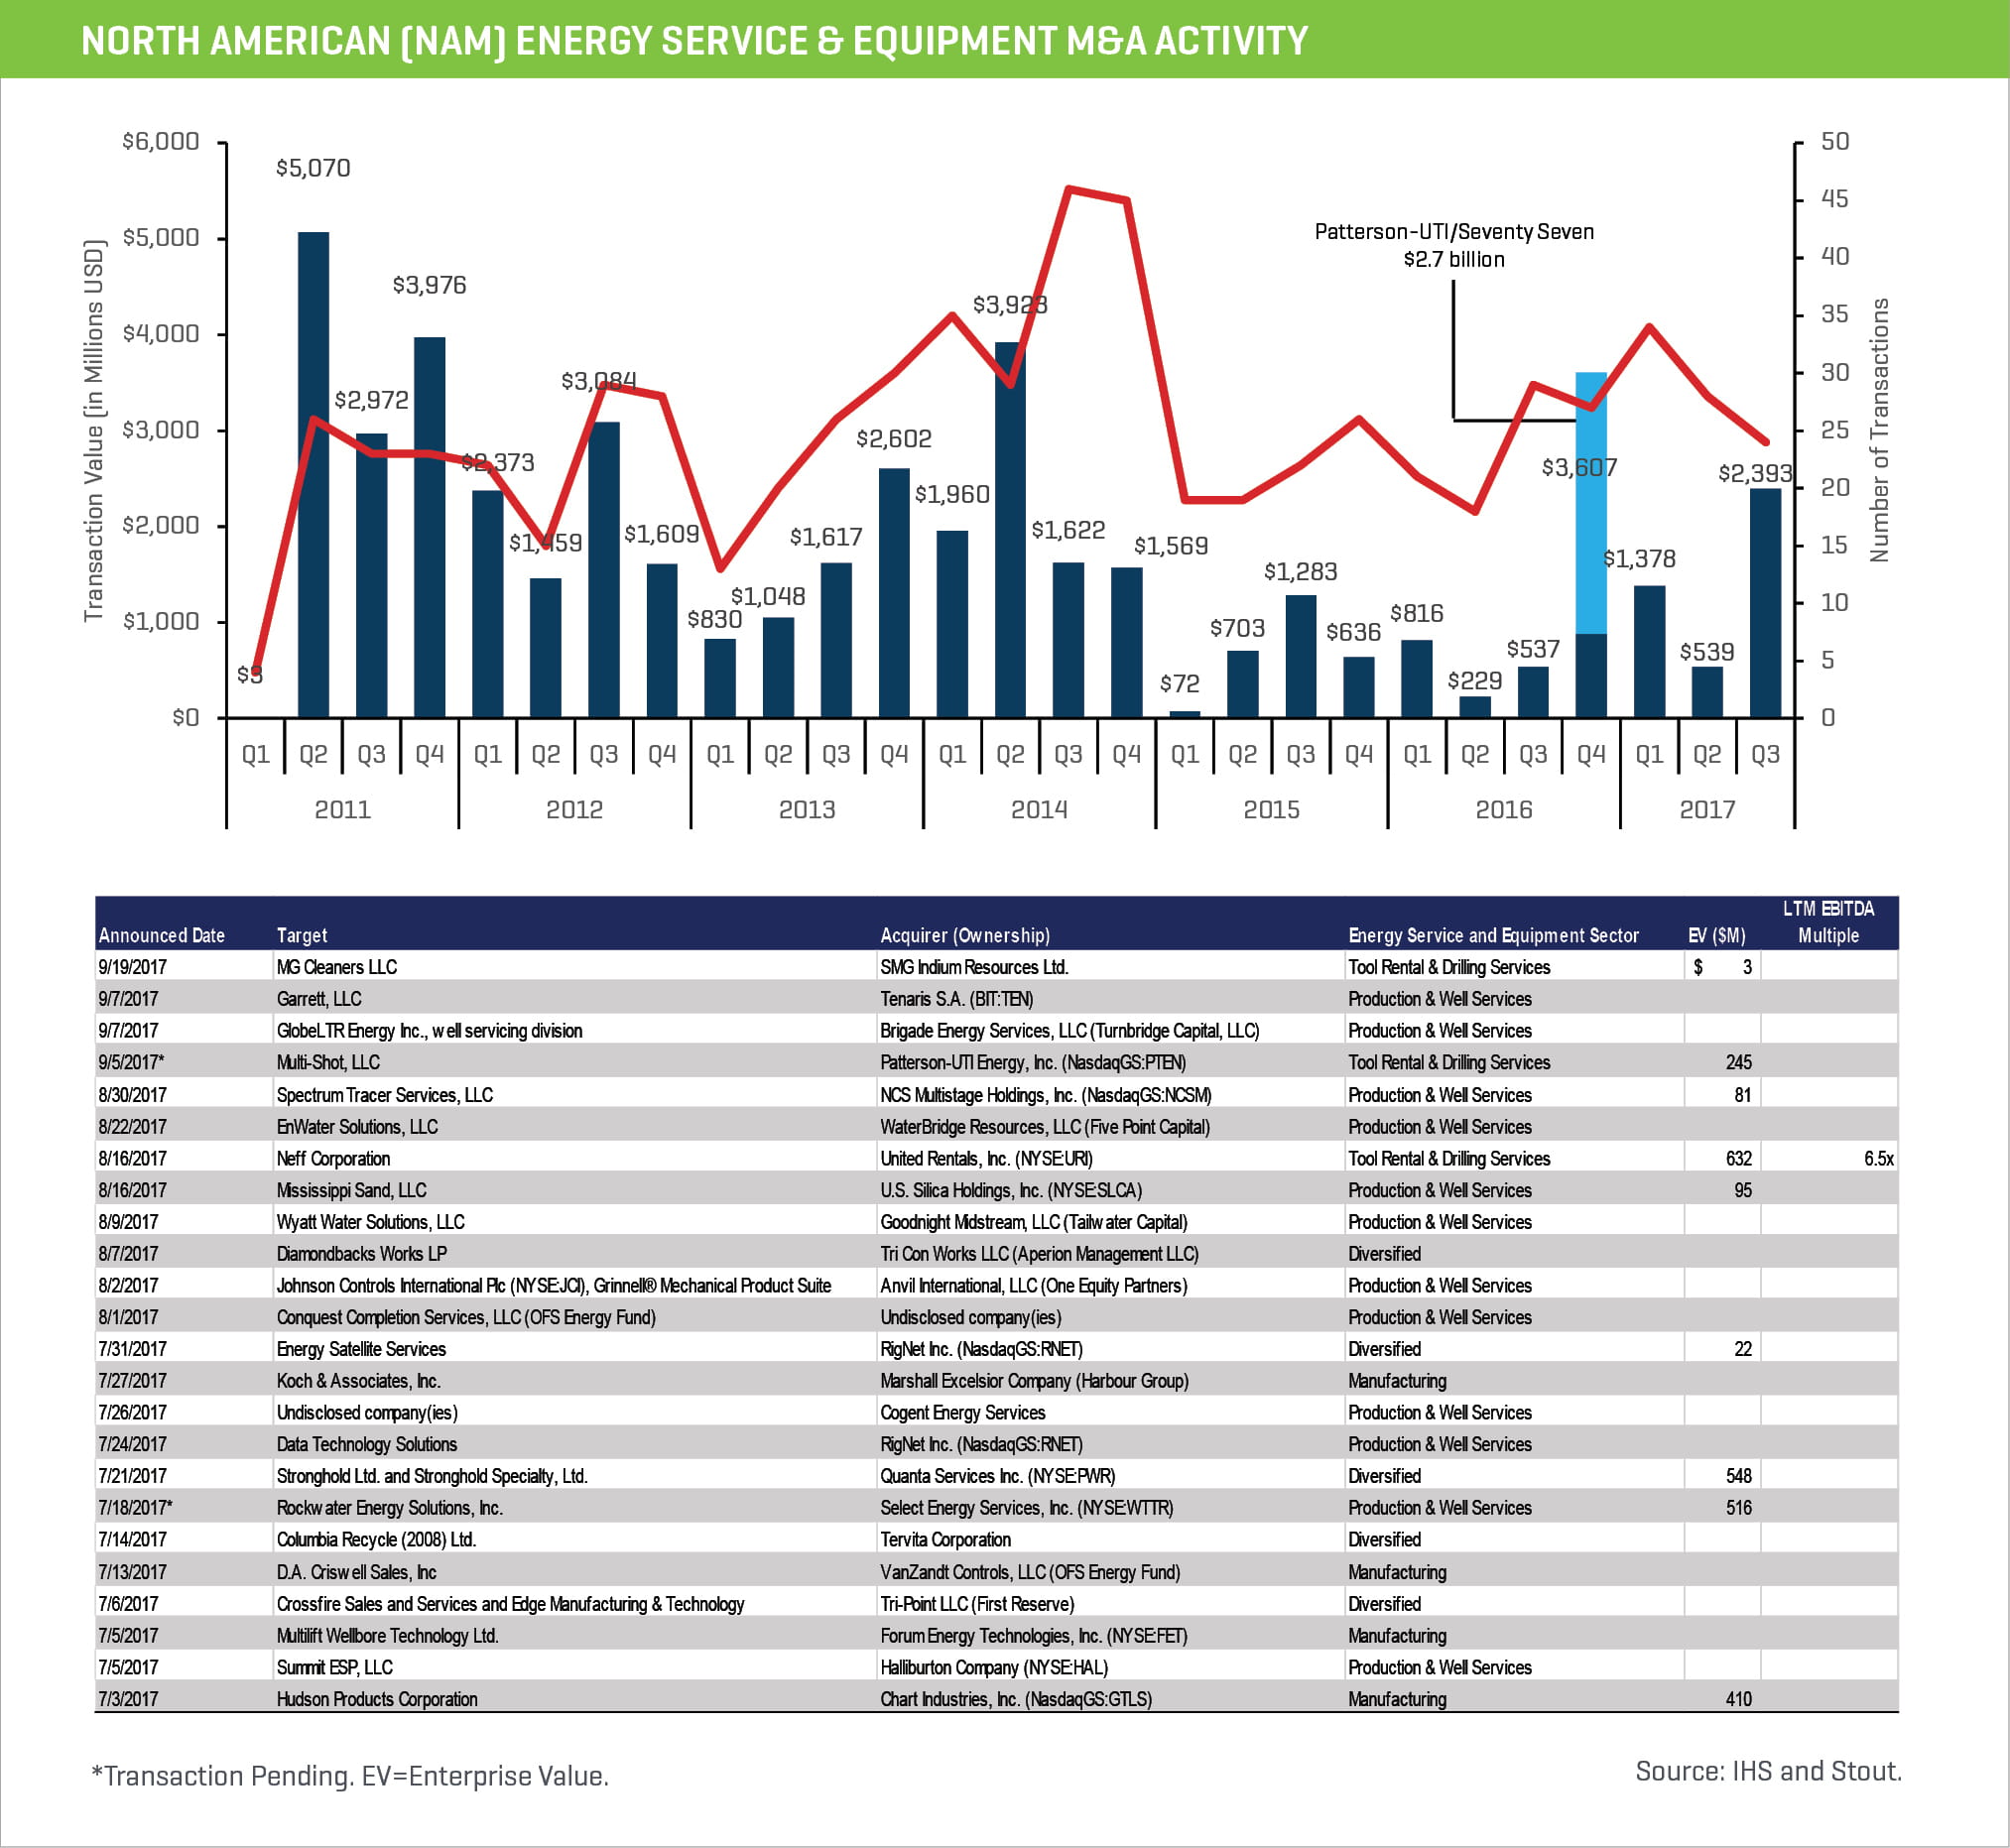
M&A activity by count slowed in the third quarter, as commodity prices remained range bound and uncertainty crept back into the market. However, activity levels have rebounded from prior year levels as energy service and equipment M&A activity through the first three quarters of the year reached 86 transactions, compared with 68 in the first three quarters of 2016 (+26%).
(click to view larger chart)
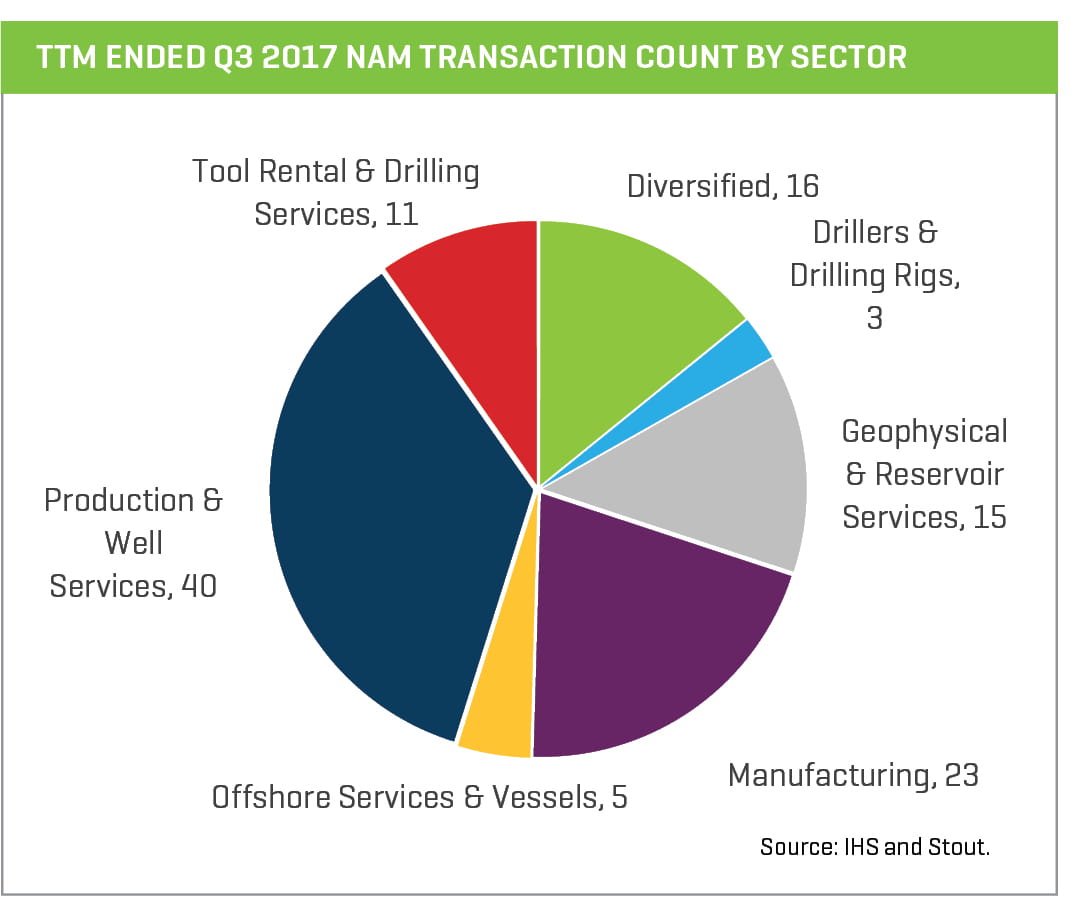
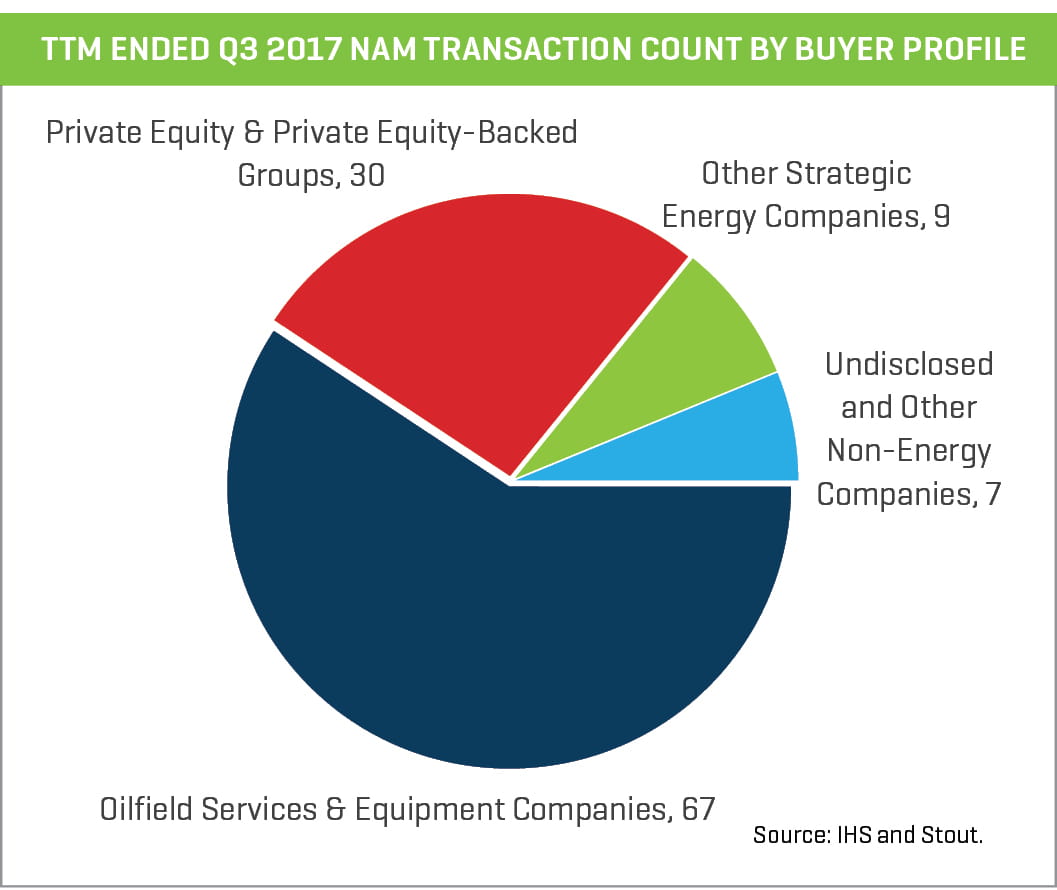
Production & Well Services transactions remain the most active OFS sector in NAM by number of transactions while Drillers & Drilling Rig businesses represent the largest dollar value. However, excluding Patterson-UTI’s $2.7 billion acquisition of Seventy Seven Energy, Production & Well Services businesses represent the largest dollar volume in the trailing twelve-months (TTM) ending September 2017. Manufacturing also remains an active sector. Offshore-related transactions continue to be a weaker part of the market. Energy Services companies (Strategics) have been the most active acquirers of companies in the sector (60% of TTM transaction activity by volume), while private equity and private equity-backed groups represent the second most active buyer group (approximately 30%).