Deutsch


Market Dynamics
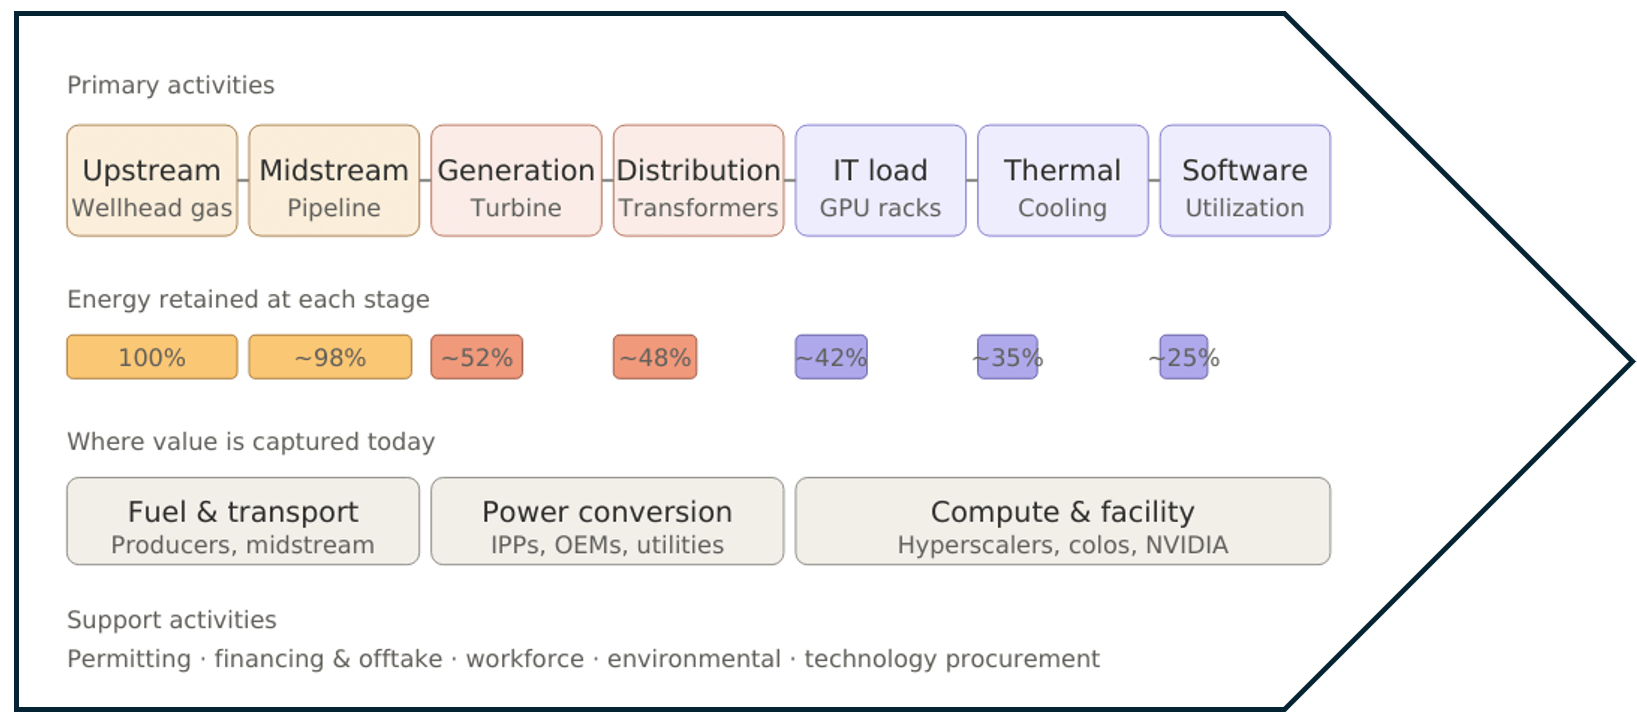
A British thermal unit (BTU) of natural gas leaves an illustrative Permian wellhead with a fixed amount of energy, measured in MMBTUs. By the time that energy reaches a computer (or GPU) in an AI data center, only 25 to 35 percent of it survives. The rest is lost to pipeline compression, turbine inefficiencies, transformer heat, cooling overhead costs, and idle silicon chips.
For most of the last decade, those losses were a footnote. Power was cheap, abundant, and somebody else’s problem. Data center developers competed on land selection, cooling system designs, and uptime, and the natural gas molecules that ultimately spun the turbine were far removed from the data center’s P&L. That world is over.
As of year-end 2024, roughly 2,300 gigawatts (GW) of new generation and storage capacity has been queued for U.S. grid interconnection, more than the entire installed generating fleet of the country.1 Given this shift, the bottleneck in AI infrastructure costs has migrated from the server room to the wellhead, and the firms that figure this out first stand to capture a disproportionate share of the next $100 billion in value.
Value Chains
In 1985, Harvard’s Michael Porter published Competitive Advantage, arguing that a firm is not a monolith but a chain of discrete activities or processes, each adding cost, value, or both.2 He organized his thoughts into a firm’s value chain.
Porter's Value Chain
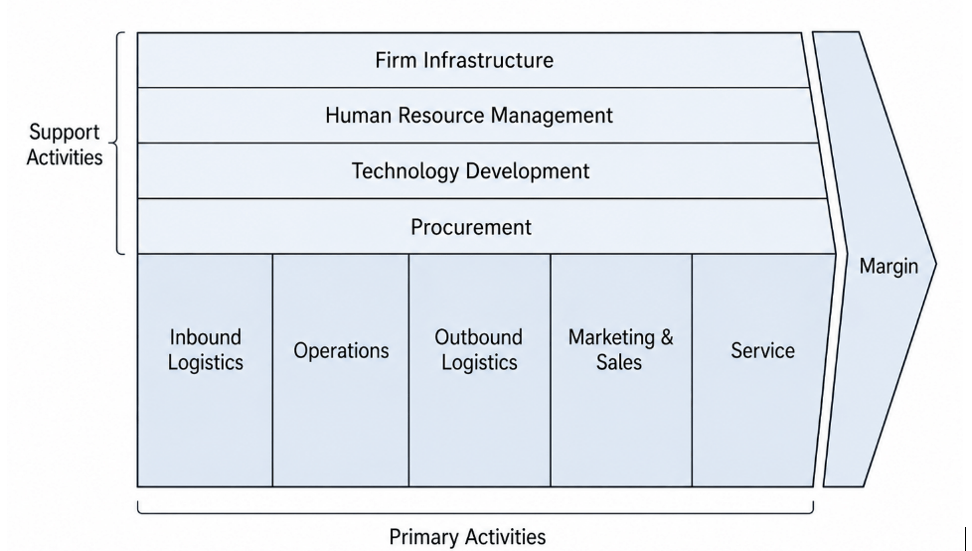
Porter’s hypothesis was deceptively simple: a company is not a monolith but a sequence of discrete activities or processes, each of which either adds value, adds cost, or both. Winning firms understand the value chain, optimize the links that matter most, and either perform key activities more cheaply than competitors (cost leadership), or perform them differently enough to command a premium (differentiation).
The BTU-to-GPU Value Chain3
The insights above are shown in today’s BTU-to-GPU Value Chain, covering industrial sequences required to convert a unit of fuel energy into useful AI computations.
Here’s what it looks like.4
Expected Winners
The framework’s implication is that the next phase of AI infrastructure value will not accrue to whoever buys the most new chips. NVIDIA is already capturing much of that value.5 Value will be created for companies that are able to simultaneously underwrite a 20-year fuel contract, a seven-year turbine lease, and a three-year silicon chip refresh agreement.
That favors a short list of players: integrated energy companies extending downstream into power and compute, independent power producers with gas exposure and project finance muscle, and a new class of vertically integrated AI infrastructure firms that own the molecule and the GPU on the same balance sheet.
It disfavors a longer list of pure-play colocation REITs offering advantageous sites and operational uptime, hyperscalers without an upstream gas strategy/source who will increasingly be price-takers on rising power costs, and regulated utilities boxed out of attractive base load contracts by “behind-the-meter” projects that bypass them entirely.
AI infrastructure development is no longer just a technology investment, but an energy investment with a software layer on top. Future value creation will go to whoever can deliver the most efficient computations per BTU at the wellhead.
WTI Strip Prices Increase
Spot prices and futures prices for the West Texas Intermediate (WTI) contract increased approximately $8.50 per barrel6 in the near term and increased approximately $3.50 over the longer term.7
WTI Strip Prices - One Month Change
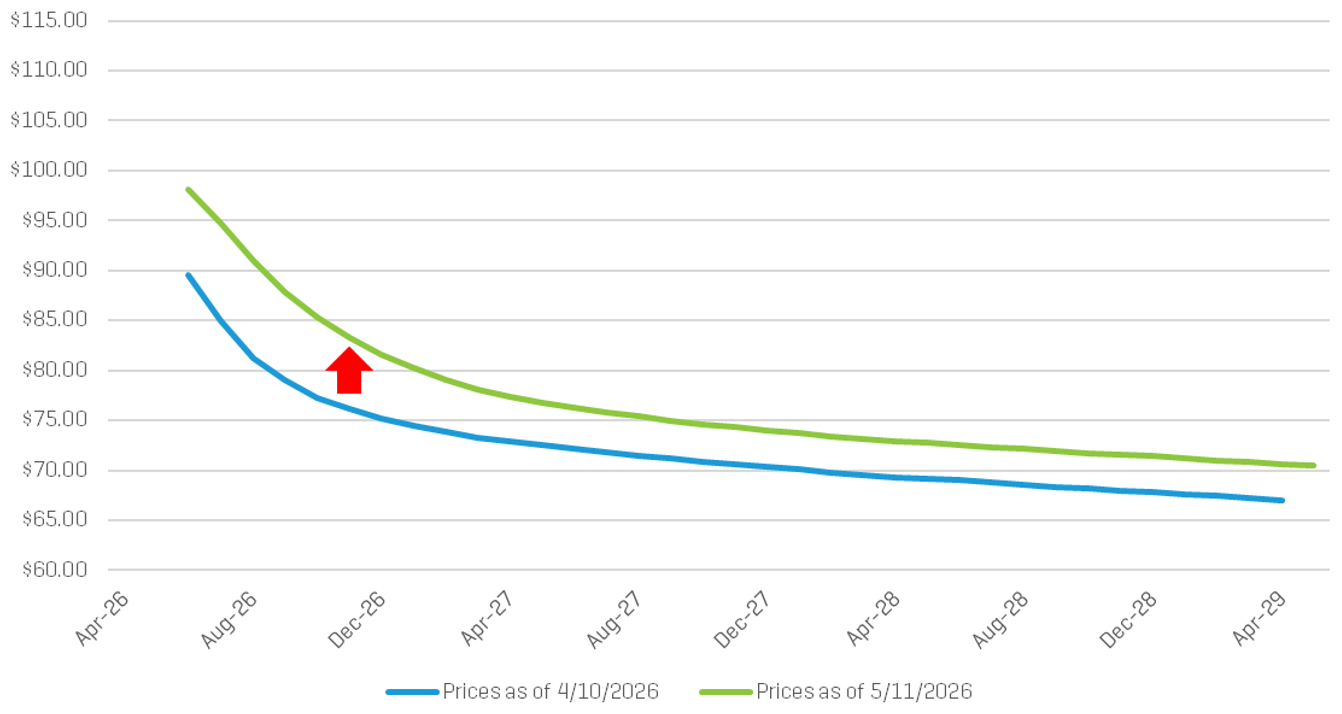
As shown, the oil price curve has shifted to a state of “backwardation,” reflecting the market’s expectation of lower future spot prices over the longer term.
Oil Price Outlook
The price distribution below shows the crude oil spot price on May 12, 2026, as well as the predicted crude oil prices based on options and futures markets. Light blue lines are within one standard deviation (σ) of the mean, and dark blue lines are within two standard deviations.
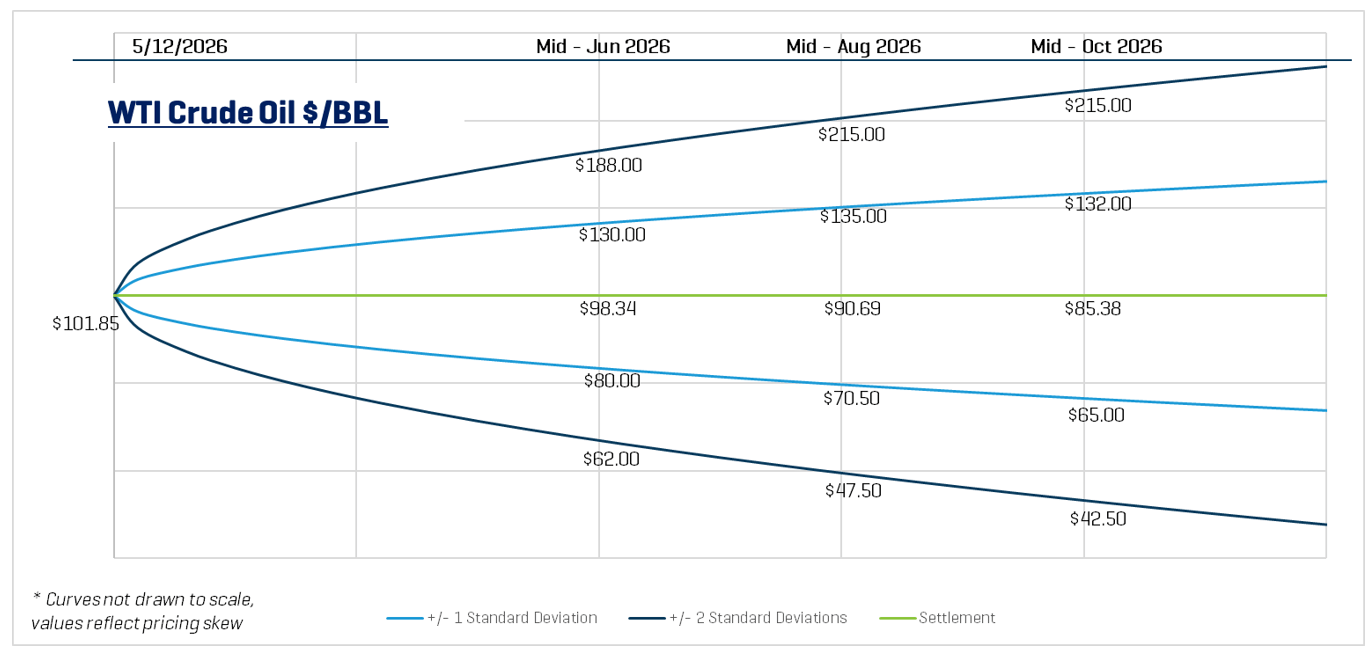
Based on these current prices, the markets indicate there is a 68% chance oil prices will range from $70.50 to $135.00 per barrel in mid-August 2026. Likewise, there is roughly a 95% chance that prices will be between $47.50 and $215.00. By mid-October 2026, the one-standard deviation (1σ) price range is $65.00 to $132.00 per barrel, and the two-standard deviation (2σ) range is $42.50 to $215.00 per barrel.
Insights
Remember that while option prices and models reflect expected probabilities rather than certain outcomes, they still remain a useful tool for assessing market expectations and risk. Throughout most of 2023 and 2024, crude oil spot prices generally fluctuated within the range of $70 to $90 per barrel. During that period, we observed general increases in futures price volatilities as prices approached the upper and lower bounds of that range. In 2025, crude oil spot prices generally decreased throughout the year. For mid-October 2026 pricing as of May 12, 2026, the 1σ range had a spread of $67.00 per barrel, and the 2σ range had a spread of $172.50 per barrel, indicating a general increase in spreads compared to recent months. Given the continued military conflict in Iran, we have observed significant near-term price and volatility increases due to geopolitical risk and potential supply disruptions. However, longer term pricing has remained relatively more stable, which may reflect expectations that supply conditions will return to normal once tensions ease.
- Lawrence Berkeley National Laboratory, Queued Up: 2025 Edition — Characteristics of Power Plants Seeking Transmission Interconnection As of the End of 2024 (2025). As of year-end 2024, approximately 2,300 GW of total generation and storage capacity was actively seeking grid interconnection in the United States.
- Michael E. Porter, Competitive Advantage: Creating and Sustaining Superior Performance (New York: Free Press, 1985). See also IBM, “What Is Value Chain Analysis?”
- Jason Lindquist, “(They’ve Got) The Power – Nscale’s Monarch Data Center Aims to Optimize the Btu-to-GPU Value Chain,” RBN Energy LLC, April 23, 2026.
- Energy retention figures are illustrative — they assume a simple-cycle gas turbine (~38% thermal efficiency), modest distribution losses, a PUE of ~1.2, and ~70% GPU utilization.
- Georgia Butler, “Nscale acquires 8GW Monarch Compute Campus, Microsoft signs on for 1.35GW of compute,” Data Center Dynamics, March 17, 2026.
- Versus April 10, 2026.
- Ibid.