Deutsch


This article provides an analysis of how four of the most common types of equity-based employee awards fare under different market conditions. (For the purpose of comparison, the awards were structured such that, as of the grant date, they were worth the same dollar amount.) It then addresses how time and market conditions affect the awards’ values, concluding with an analysis of the awards’ risk profiles. As an executive or board member, being able to compare side by side the potential advantages and disadvantages of each type of award provides the framework needed to align the value proposition offered to key employees in the form of equity-based awards with the company’s long term prospects and interests.
Background
For many years there has been discussion in the literature regarding the effects of equity-based compensation on firm performance, with some cases providing evidence that compensation improves firm performance (see Ofek and Yermack; Bryan, Hwang, and Lilien) and with others observing the opposite effect (see Frye). Nonetheless, equity-based compensation as a percentage of total executive pay increased consistently from the 1980s to the 2000s, from about 20% to more than 35% (Frye). In this article, we take a step back and, instead of exploring the relationship between company performance and executive equity-based compensation, we explore the risk profile of four of the most common types of awards, which enables the creation of a decision framework that boards and compensation committees can use to identify an appropriate award to meet their goals.
In this section we provide a brief description for each of the equity-based awards we studied, the contractual terms that need to be specified at inception, and the motivation behind each award.
RSU
Restricted stock unit (“RSU”) awards are compensation offered in the form of company stock. Unlike common stock, RSUs don’t increase the number of shares outstanding at the time of grant because no units are actually issued. Instead, RSU awards usually follow a vesting schedule, and once the award vests an equivalent number of common shares, it is given to the employee. Typical vesting schedules are time-based (i.e., portions of the award are granted over a period of time at specific dates in the future) or performance-based (i.e., the award is granted upon the units’ achieving certain predefined performance metrics). The number of RSU awards granted and the corresponding vesting schedule are the only items that need to be specified at inception.
ESO
Employee stock option (“ESO”) awards, like RSU awards, are granted according to a predefined vesting schedule. Also like RSU awards, typical ESO awards maintain vesting schedules that are time-based or performance-based. Unlike RSU awards, however, ESO awards are granted with a specific strike price and maturity — typically at-the-money and 10 years, respectively. These contractual terms need to be specified at inception.
TSR
Total shareholder return (“TSR”) awards compensate the employee based on the relative performance of the common stock of the subject company (i.e., the issuer of the award) during a defined performance measurement period, with respect to the common stock of a peer group (e.g., a set of competitors, companies in the same sector, or components of an index).
At the end of the measurement period, the stock return of each company is measured and ranked. Based on the terms of the award a number of common shares is given to the employee based on how the subject company ranks relative to the peer group. At inception, the peer group, measurement period, reference stock prices, and number of units the employee will receive at the end of the measurement period as a function of the company’s relative ranking within the group need to be specified.
Analysis
This analysis assumes a value of $10 per share of common stock as of the grant date of the awards, as well as an equity volatility of 40% and a risk-free rate of 2.5%. In addition, each option has its own set of assumptions:
For the RSU award, a value of $1 million corresponds to 100,000 units.
For the time-vesting employee stock option (“ESO-T”) award, we assume a vesting schedule of one-third of the award per year for the first three years, a strike price of $10, and an expiration date of 10 years after the date of the grant. This corresponds to an award of 236,449 units to achieve a $1 million award value as of the grant date.
For the performance-based employee stock option (“ESO-P”) award, we assume a vesting condition of 100% on Year 3 if at that point the stock price is 1.1x or higher (approximately 3.23% IRR); otherwise, there is 0% vesting. As with the ESO-T award, the strike price and option expiry were set to $10 per share and 10 years, respectively. Under these conditions, a $1 million award value as of the grant date corresponds to 303,474 units.
For the TSR award, we assume a peer group of five companies. Although all five companies were assigned 40% equity volatility for the purpose of simplicity, the analysis uses a realistic correlation matrix with correlation coefficients between 30% and 45%. The vesting condition has a measurement period of three years, and an award of 2.0x, 1.5x, 1.0x, 0.5x, and 0 for relative rankings of first, second, third, fourth, and fifth, respectively. Under these conditions, a $1 million award value as of the grant date corresponds to 86,103 units.
Using the aforementioned assumptions, the stock prices at Year 3 were simulated for 100,000 paths, and the values of each type of award were computed for each sample path. In the case of the ESO-T award, the whole award is vested at Year 3 and have a remaining life of seven years. Because the underlying stock performance is known at Year 3, it was possible to estimate whether the ESO-P award would vest, and also compute how many TSR units would vest, based on the relative ranking of the company within the peer group.
Results
Figure 1 shows the value of each type of award as a function of the realized stock price at Year 3:
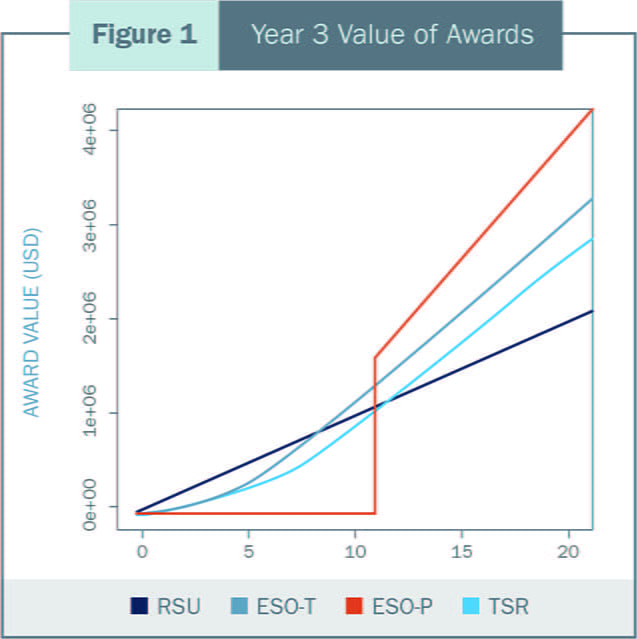
The RSU award shows the most straightforward payoff because it is directly proportional to the underlying stock price. A stock price of $0 at Year 3 corresponds to a $0 award value, and a stock price of $20 at year 3 corresponds to a $2 million award value.
The ESO-T award is also simple to explain: It is the value of a call option with the underlying stock price equal to the Year 3 stock price, a strike price of $10, and a remaining life of seven years, multiplied by the number of ESO-T units awarded. Because there is some probability that the underlying stock will end up higher than the strike price by Year 10, even realized stock prices under $10 have some value.
The curve that describes the value of the TSR award is somewhat similar to that of the ESO-T, but the reason is completely different. In the case of the ESO-T award, the value is non-zero for lower stock prices because of the time value of the option; in the case of the TSR award, the value is non-zero because the vesting condition for the award depends on the relative equity return of the group more than it depends on the performance of the underlying stock in isolation (i.e., a low underlying stock price can still lead to a relative ranking of 1 as long as the other companies in the peer group perform worse). Clearly, the higher the stock price, the greater the likelihood that the company has outperformed its peers and the higher the value of the same number of units. Because of the possibility that a high return results in a lower ranking if the peer group performs better than the subject company, however, the TSR value curve is below the ESO-T’s. This means that, for the same ending stock price, the value of the TSR award is, on average, less than the value of the ESO-T award.
The ESO-P award curve is the least linear among all four compensation options. Any stock price under the performance threshold of $11 does not vest, which results in an award value of zero. In contrast, if the award vests, even though the per-unit value is the same as the ESO-T award’s (i.e., both options have the same underlying value, strike price, maturity, and risk-free rate), the aggregate value of the ESO-P award is higher because there are more ESO-P units than ESO-T units (a direct consequence of the way the award is structured at inception). For both the ESO-P award and the ESO-T award to be worth $1 million as of the grant date, it is necessary to award more ESO-P units than ESO-T units, in order to compensate for the fact that, under some scenarios, the value of the ESO-P award is zero and the value of the ESO-T award is greater than zero (more on this below).
Figure 2 shows the probability of achieving a given award value at Year 3:
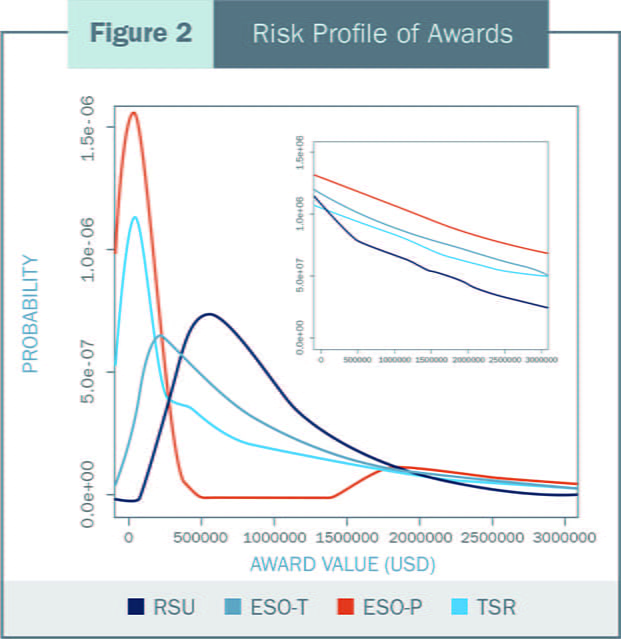
The ESO-P award is the most likely to result in a value of zero — and therefore is the riskiest option — followed by the TSR, ESO-T, and RSU awards, in that order. That said, the ESO-P award is also the most likely to offer the highest reward as the tail of the distribution extends further into higher award values, while the RSUs offer the least upside as the probability of reaching a high award value is the lowest of the four. The RSU award is the most likely to be worth at least $1 million at Year 3, followed by the ESO-T, TSR, and ESO-P awards.
Conclusion
Using standard accounting rules for computing the value of equity-based awards as of issuance, it is possible to estimate the number of units corresponding to the RSU, ESO-T, ESO-P, and TSR awards, such that the awards would be worth $1 million each as of the grant date. Based on the risk profiles and payoff structures of the award types, the awards can be ranked by their risk-reward profile. This analysis shows that the ESO-P award offers the highest value but is also subject to the most risk, and the RSU award offers the least value and the least risk.
For the case studied, the TSR award is somewhat riskier than the ESO-T award at higher stock prices, both in terms of award value versus realized stock price and in terms of the probability of reaching a high award value. The main difference between the TSR and ESO-T awards is apparent at low realized stock prices: the ESO-T award is worth very little because the options are out of the money, and the TSR award, regardless of poor stock performance, can be worth more than the ESO-T award so long as the company ranks at the top of the peer group.
Boards of directors and compensation committees would benefit from developing a better understanding of the risk-reward profiles underlying different types of equity-based awards. Armed with this information, they would be able to make better-informed decisions regarding which type of employee compensation is most appropriate for their organization, and how to structure the award to both motivate employees and more closely align the company’s and employees’ interests.
Bryan, Stephen, LeeSeok Hwang and Steven Lilien. “CEO Stock-Based Compensation: An Empirical Analysis of Incentive-Intensity, Relative Mix, and Economic Determinants.” The Journal of Business (2000): Vol. 73, No. 4, pp 661.
Frye, Melissa. “Equity-Based Compensation for Employees: Firm Performance and Determinants.” The Journal of Financial Research (2004): Volume 27, Issue 1, pp 31.
Ofek, Eli and David Yermack. “Taking Stock: Equity-Based Compensation and the Evolution of Managerial Ownership.” The Journal of Finance (2000): Vol. 55, Issue 3, pp 1367.