Italiano


Energy markets continued to improve during the first quarter of 2018. Crude prices have gained amid future uncertainty, highlighted by continued backwardation. Permian activity remains the key driver of U.S. unconventional activity and has supported the continued recovery of sectors such as production and well services, energy equipment manufacturers, and contract land drilling.
Key Q1 Takeaways:
- Crude oil prices continued to climb, while backwardation illustrates future pricing concerns
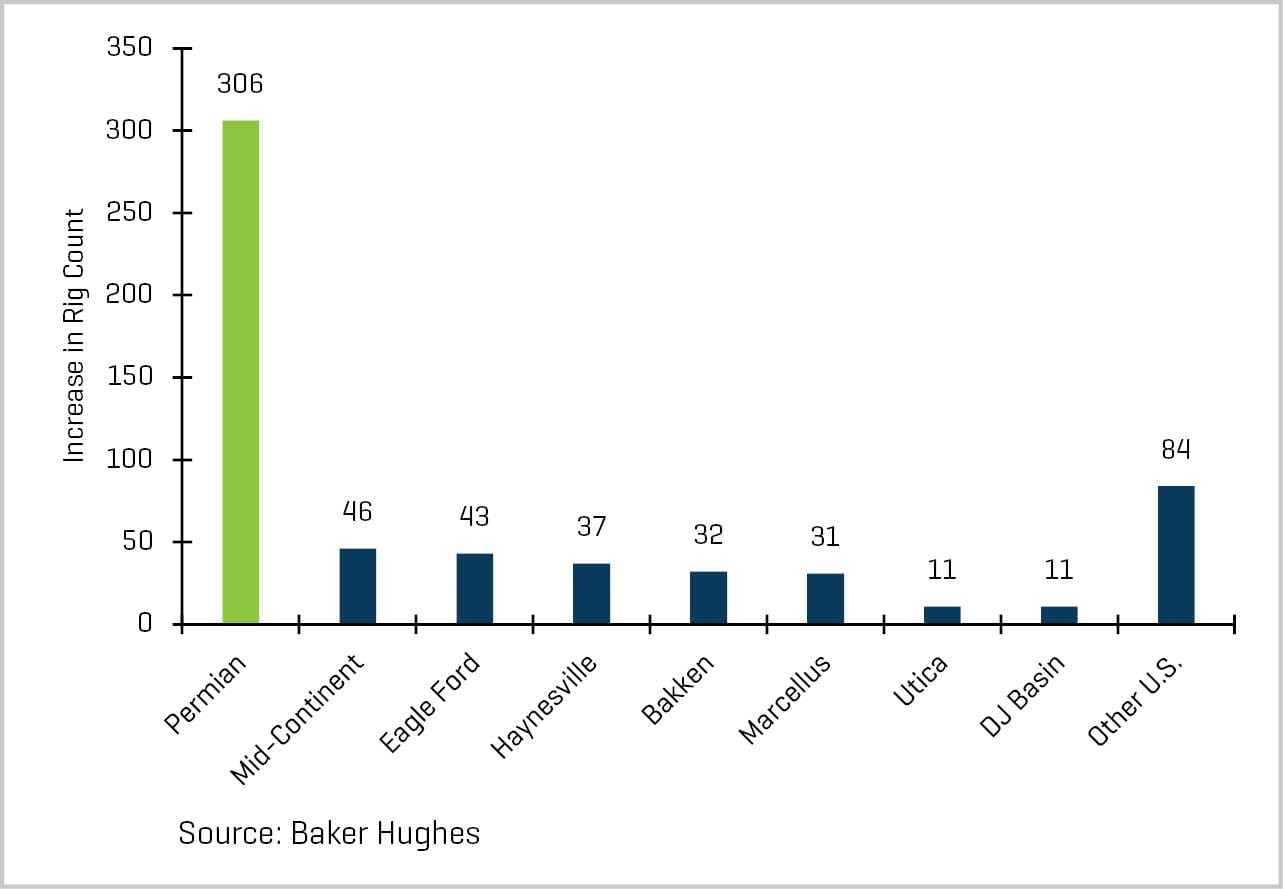
- Permian remains primary source of North American activity
- Production and well services, energy equipment, and land drilling experienced the largest growth and margin expansion, while offshore services and drilling have yet to see the bottom. Relative energy underperformance may indicate continued concerns regarding rapid production growth due to elevated crude oil prices encouraging more activity. Production and well services transactions remain most active by transaction count and dollar value, while offshore services remain challenged
CRUDE OIL
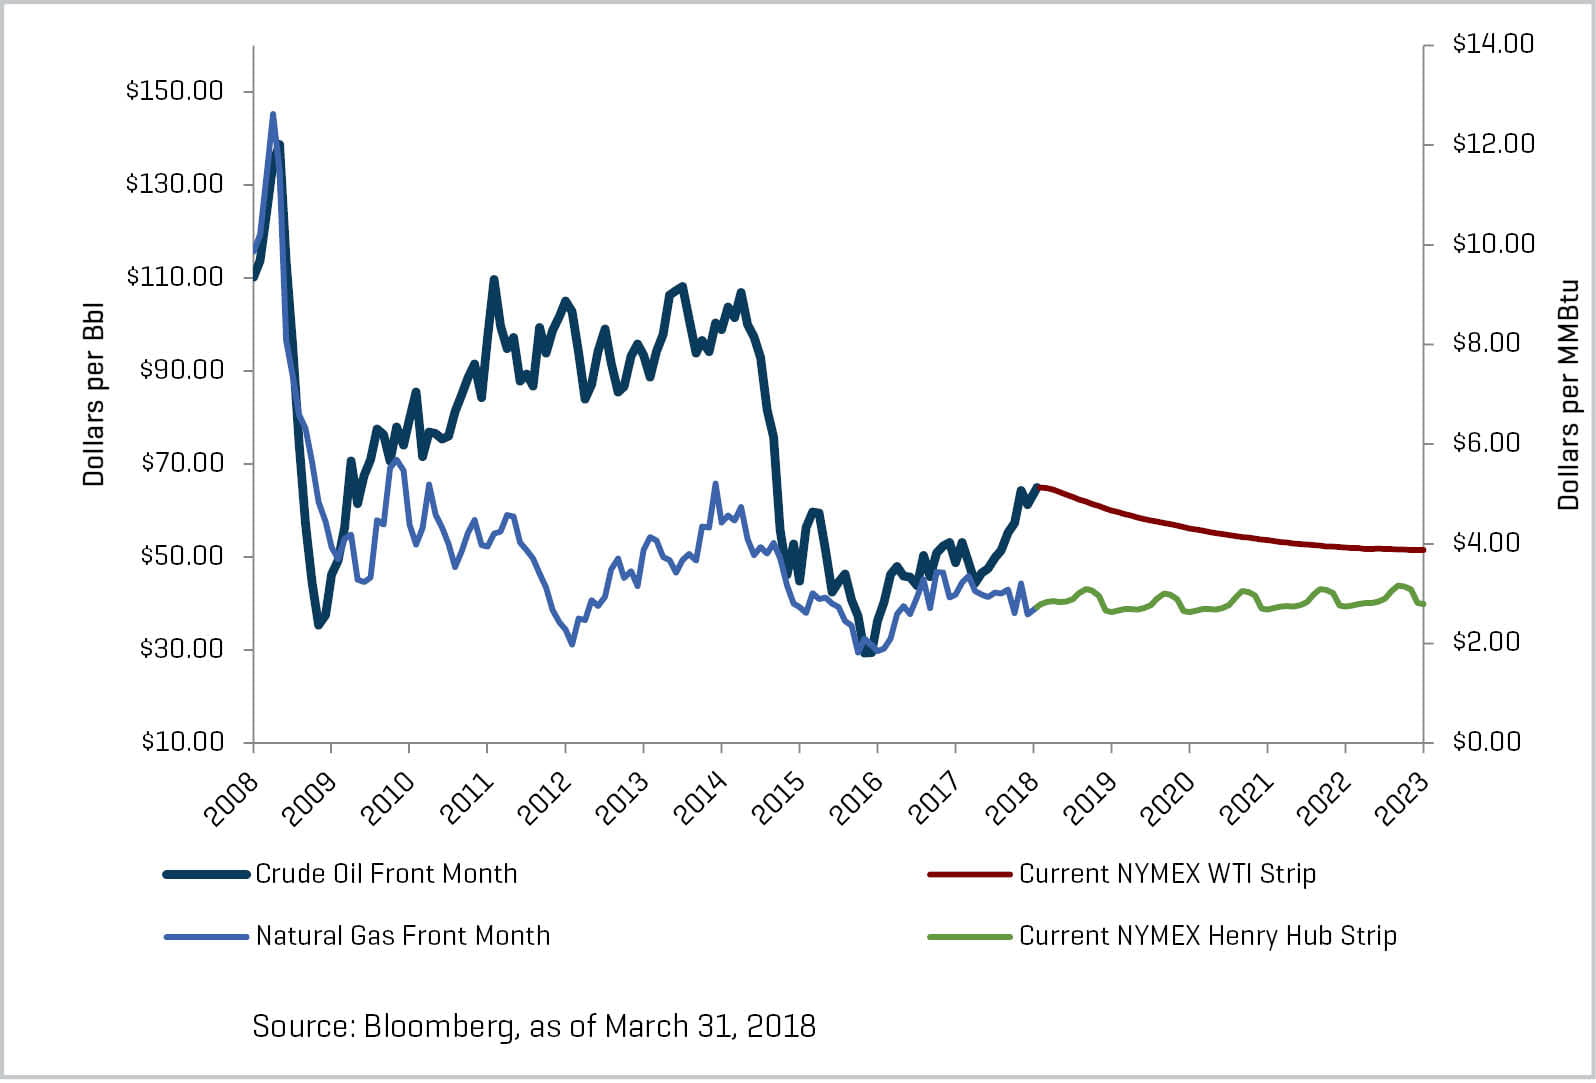
Crude oil prices increased from $60.42 to $64.94 during the first quarter (a 7.5% increase) driven by sustained OPEC compliance with respect to production cuts, shortfalls in Venezuelan production, increased potential for conflict in the Middle East (e.g. Iran), and continued crude inventory draws.
Crude Oil (WTI) Prices and Natural Gas (Henry Hub) Prices
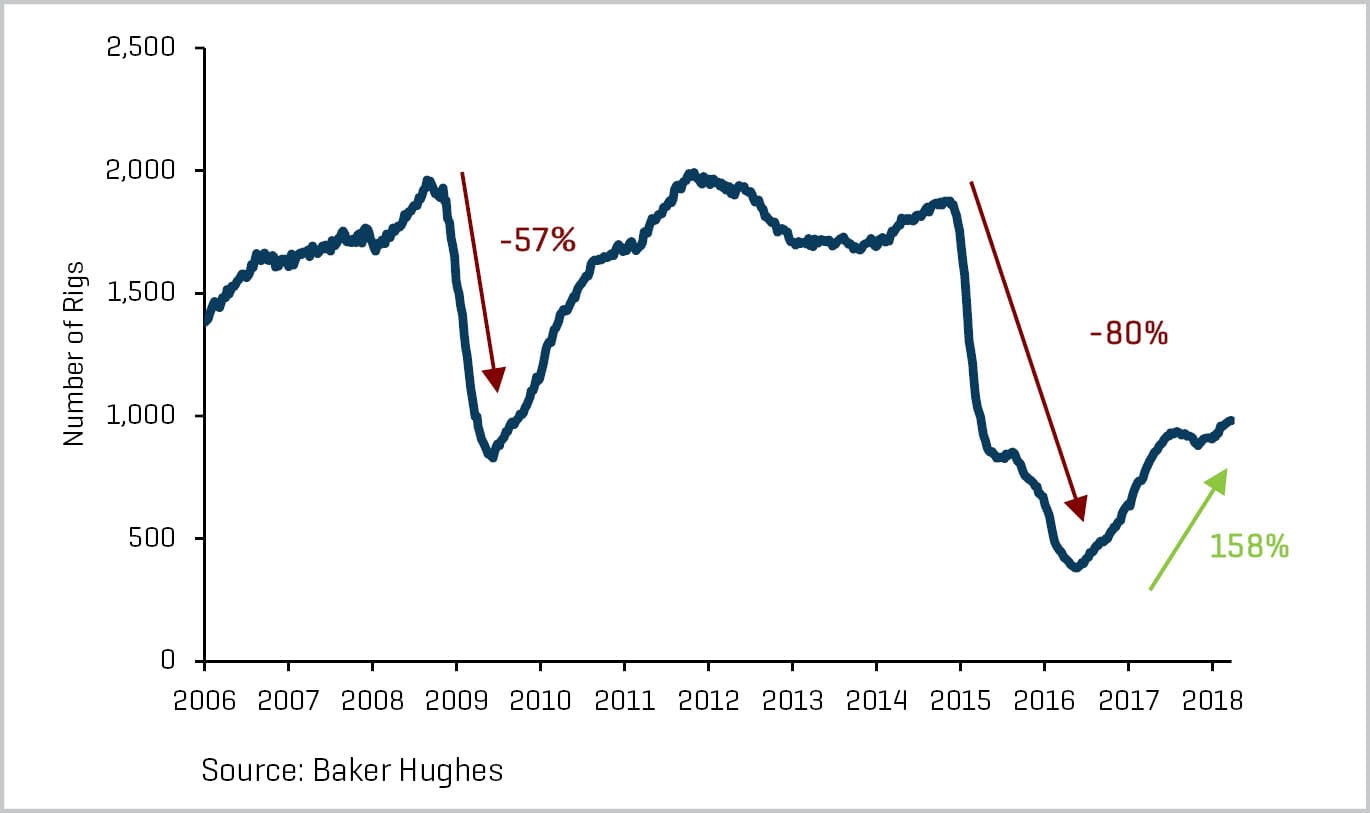
These positive developments were partially offset by continued efficiency and growth in North American production and a commensurate surge in U.S. crude oil output. The average U.S. land rig count increased by 70 rigs, approximately 7.7%, from 911 to 981 rigs during the quarter, of which 45 rigs were added in the Permian Basin, representing an increase of approximately 11.3% in the region.
Historical U.S. Land Rig Count
Increase in U.S. Land Rig Count Since May 2016
While many North American producers are cautiously optimistic regarding crude oil prices, a number remain careful in committing capital to longer lead time projects. Backwardation in the crude oil market highlights some of these concerns regarding longer-term crude pricing. Exploration and production companies have left meaningful portions of their production unhedged and will see gains if crude prices remain stable or rise further. The North American market also continues to benefit from drilling and completion efficiencies, although the pace of efficiency is anticipated to moderate. Despite increases in pricing in certain service segments, the enhanced production outweighs the incremental costs. Additionally, it is expected that the associated natural gas production will strengthen as international demand continues to grow and additional export liquified natural gas facilities come online.
Continued Financial Improvement
Financial performance in the fourth quarter of 2017 highlighted continued improvement in the energy service and equipment segment, though the pace of growth moderated in several subsectors. Fourth-quarter total cumulative revenue increased 1.7% and 21.1% compared with third-quarter 2017 and fourth-quarter 2016 levels, respectively, for the energy service and equipment segment (with substantial variance by subsector). Fourth-quarter EBITDA margins, excluding offshore construction and offshore drilling, remained flat at 13.3% relative to third-quarter results, and above fourth-quarter 2016 results of 9.6%. Geophysical, production and well services, and land drilling experienced the most significant growth on both a quarter-over-quarter and a year-over-year basis. The geophysical subsector grew 8.1% and 51.1%, compared with the third quarter of 2017 and fourth quarter of 2016, respectively. Production and well services grew 0.7% and 58.0%, respectively, and land drilling grew 7.5% and 61.9%, respectively. During the same period offshore drilling continued to be a laggard with fourth-quarter revenue declining by 7.6% and 21.6% from third-quarter 2017 and fourth-quarter 2016 levels, respectively.
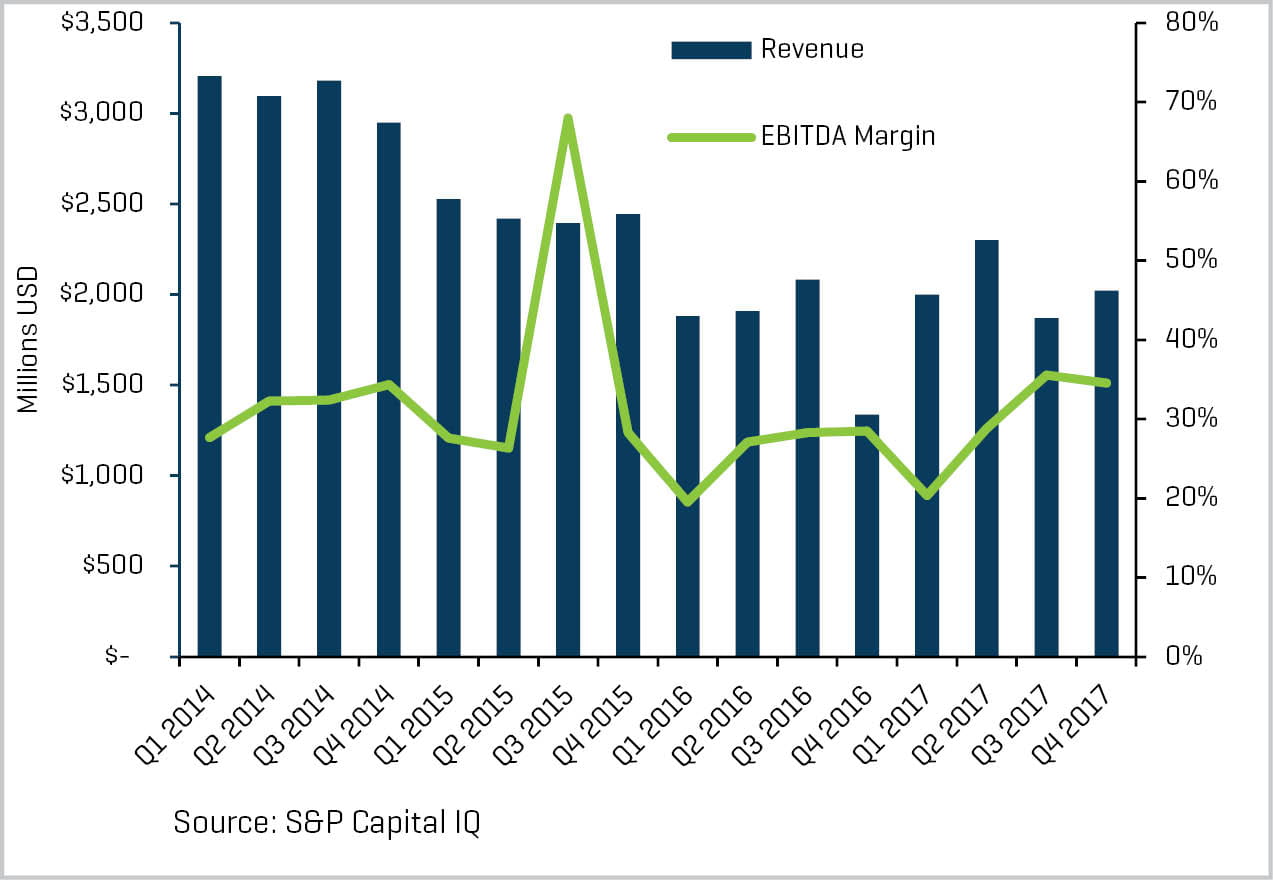
Geophysical and Geoscience Services Quarterly Revenue and EBITDA Margins
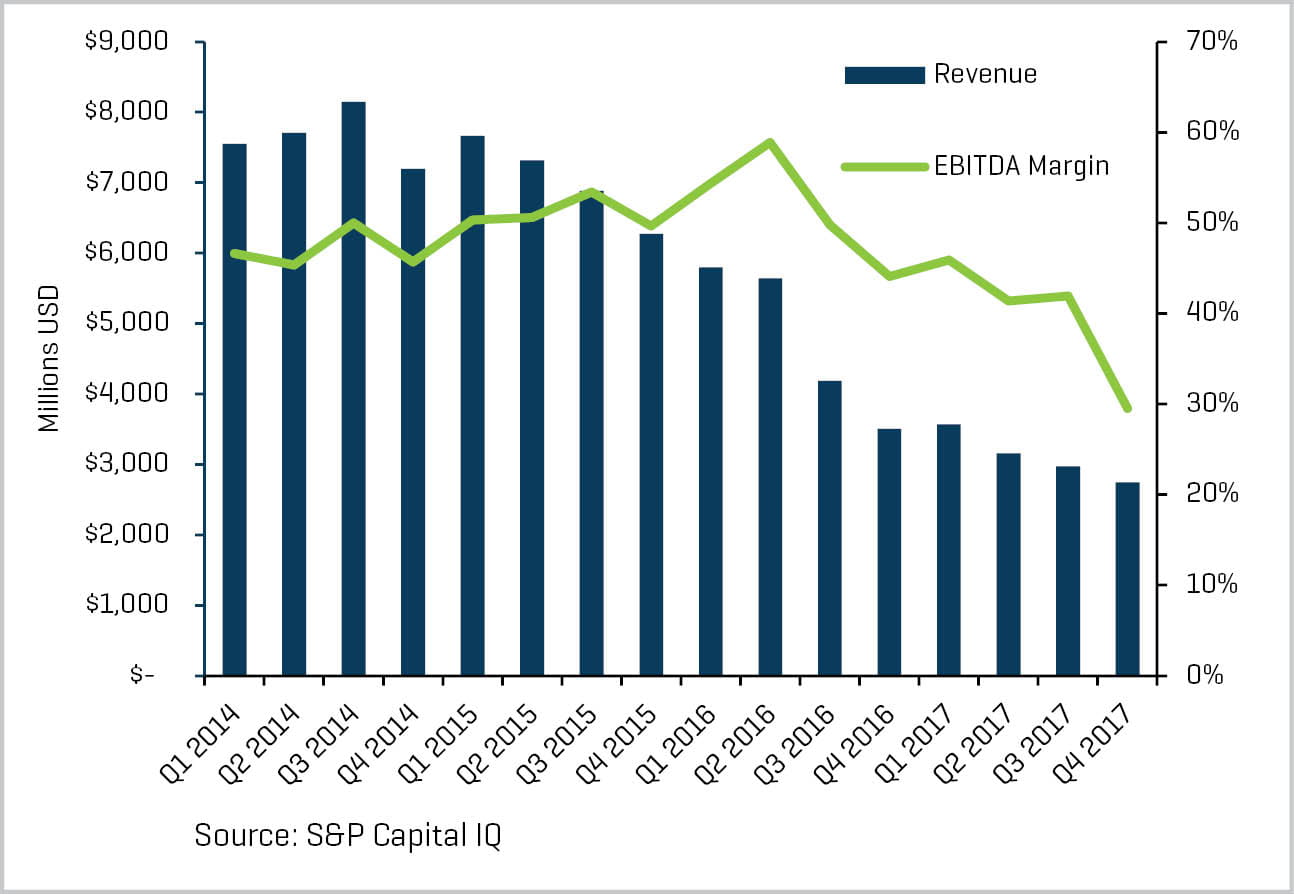
Production & Well Services Quarterly Revenue and EBITDA Margins
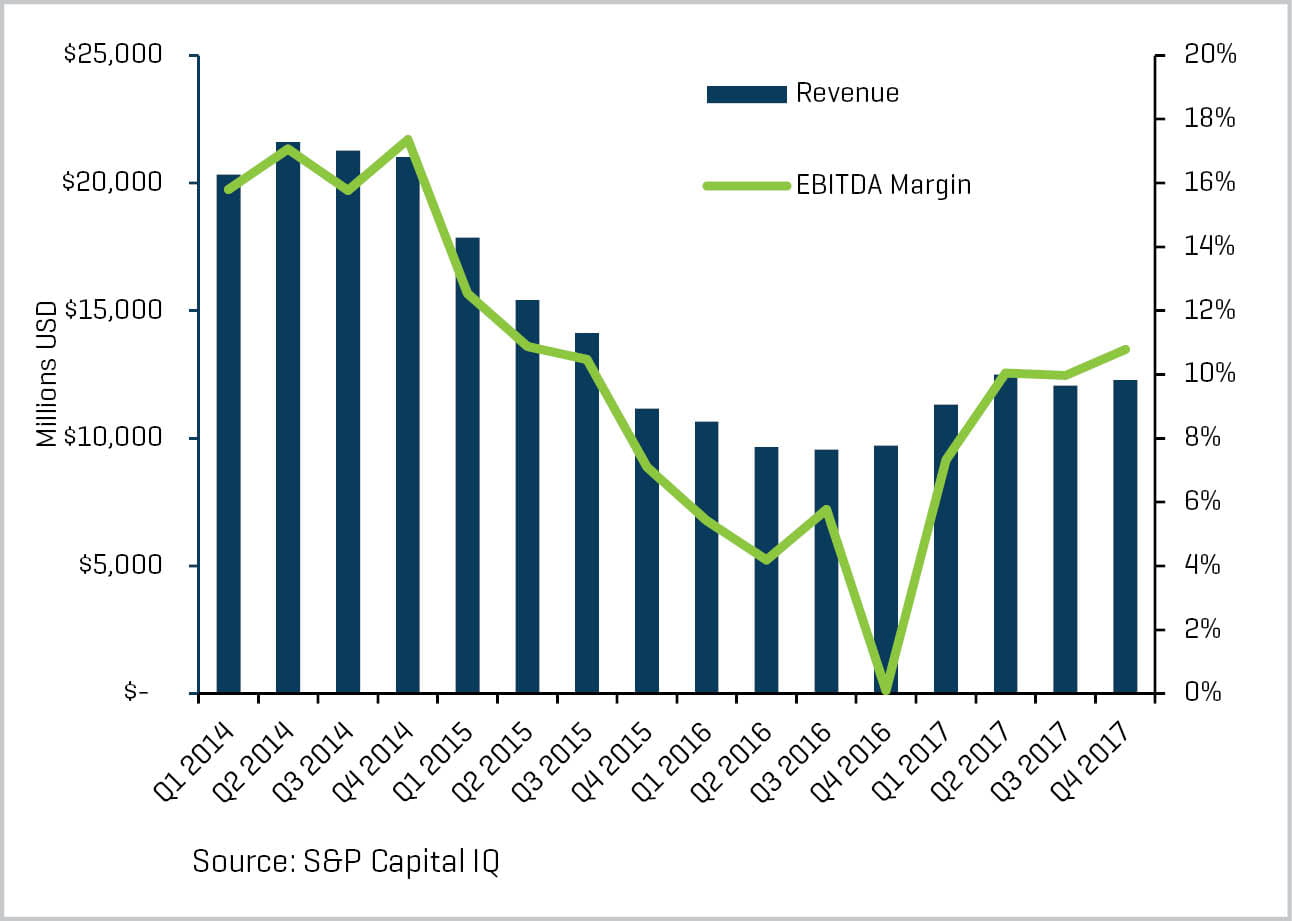
Land Drilling Quarterly Revenue and EBITDA Margins
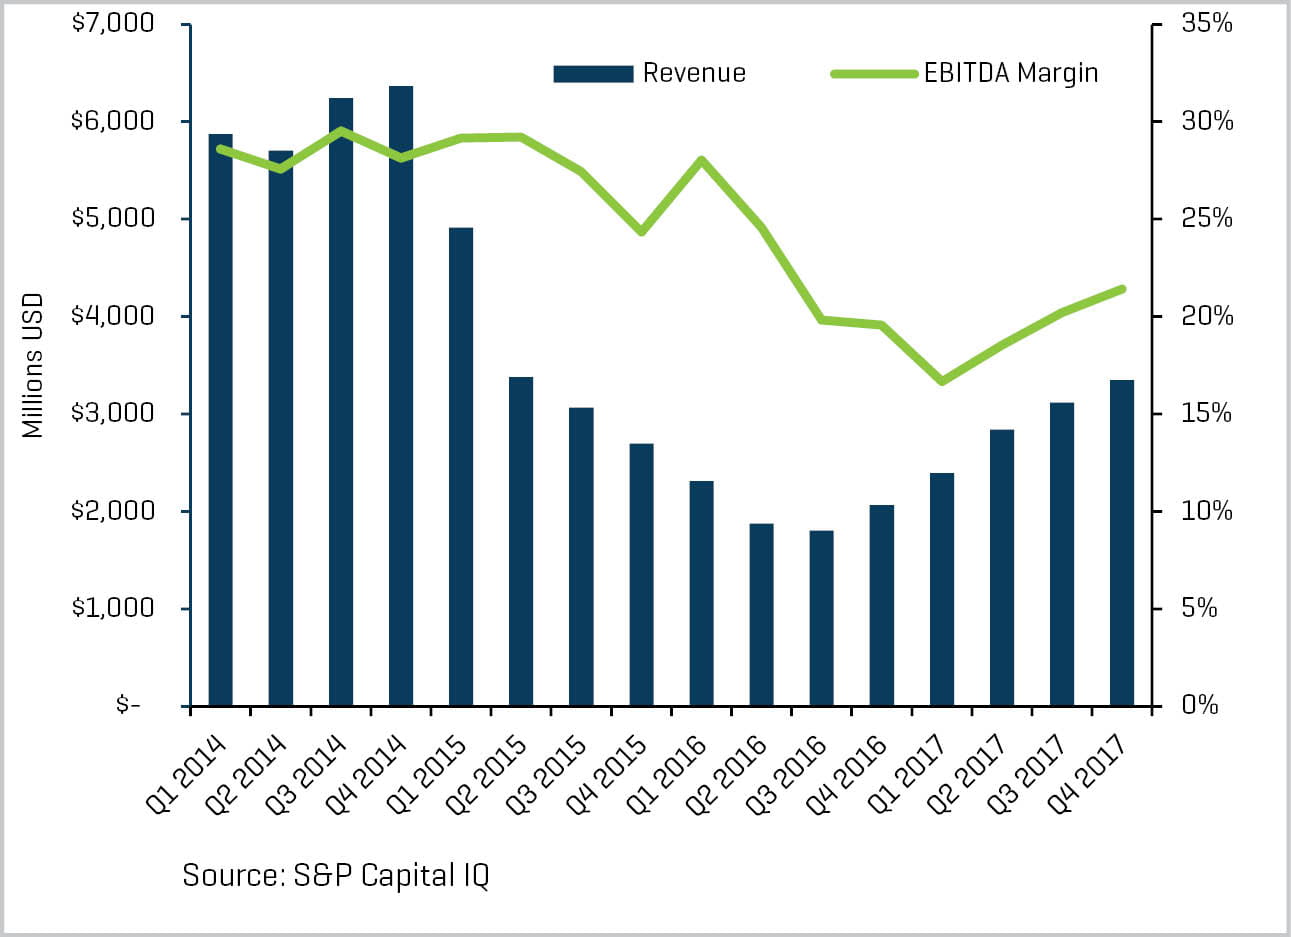
Production and well services and energy equipment manufacturers saw the largest year-over-year margin expansion in the fourth quarter. Production and well services margins expanded from 0.5% in the fourth quarter of 2016 to 10.7% in the fourth quarter of 2017. Energy equipment manufacturers’ margins expanded from 0.1% in the fourth quarter of 2016 to 10.8% in the fourth quarter of 2017. Conversely, the offshore market in the fourth quarter continued to struggle compared with the same time the previous year (not yet reaching a trough and rebounding as have other subsectors).
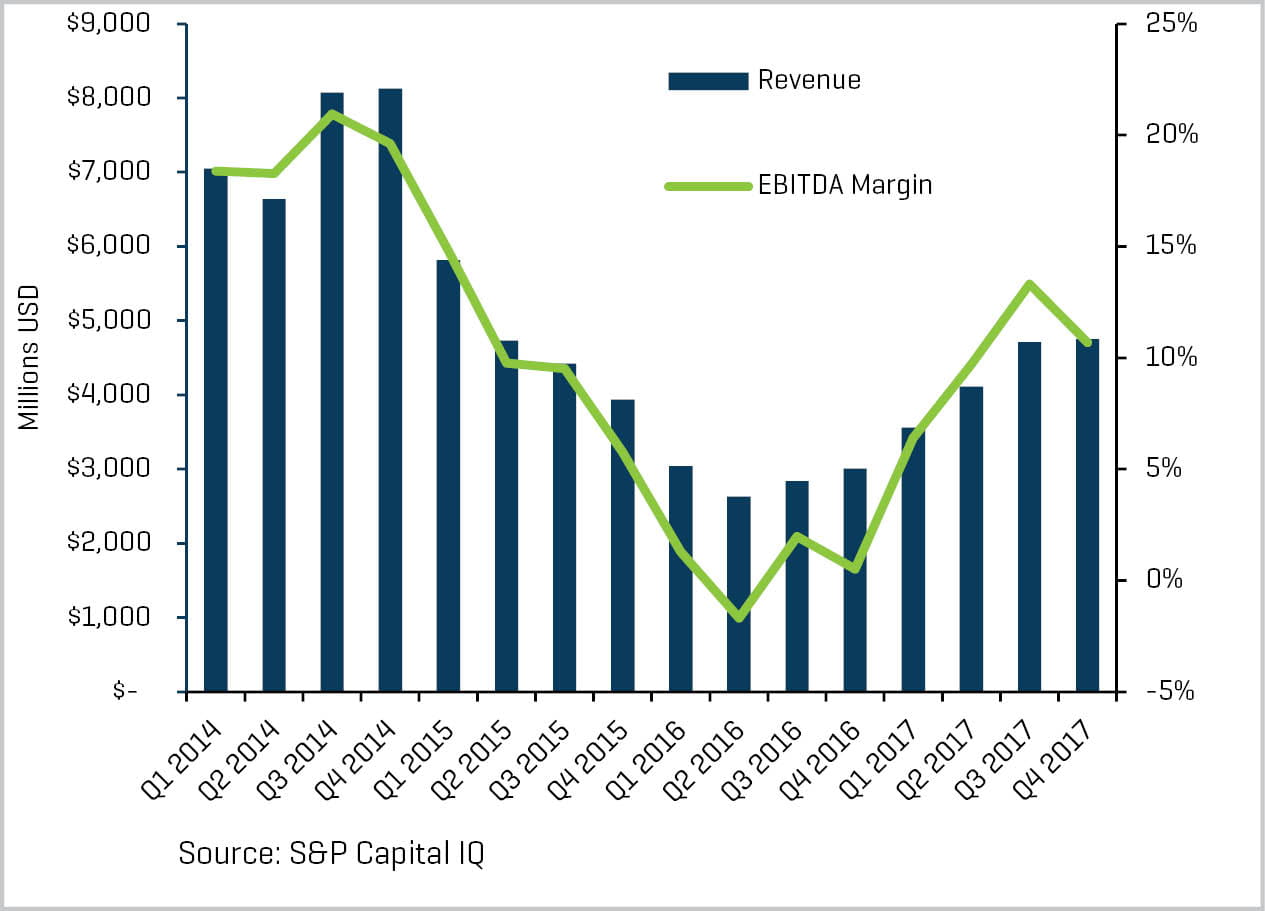
Energy Equipment Manufacturers Quarterly Revenue And EBITDA Margins
Offshore Drilling Quarterly Revenue and EBITDA Margins
Valuation Levels Still Lagging Broader Market
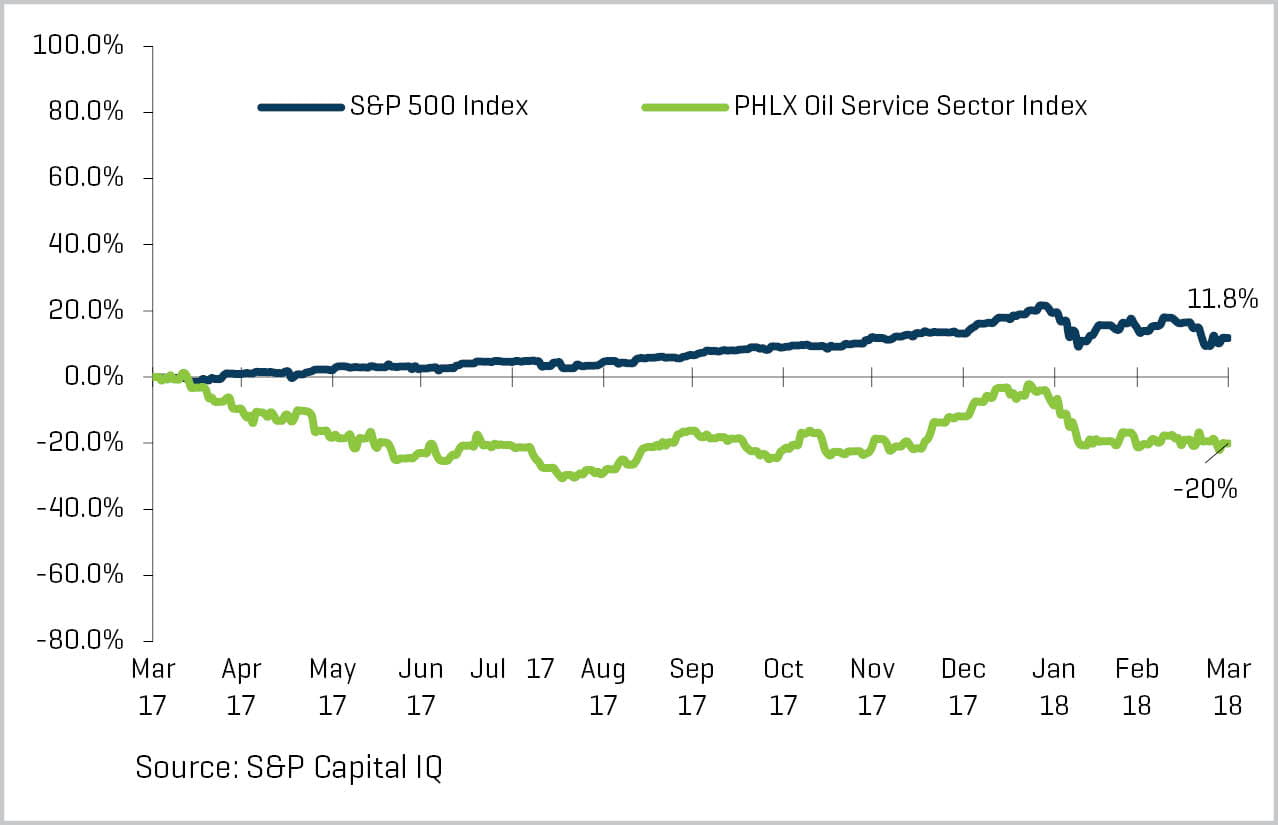
Public valuations for energy companies witnessed meaningful volatility during the first quarter, with the Philadelphia Oil Service Sector Index (OSX) decreasing 9.3%. The S&P 500 Index only decreased 1.2% during the quarter. After a period of unusually low volatility, the general market (S&P 500) witnessed 23 days of 1% price swings driven by a combination of positive economic news and earning results, the threat of trade wars with multiple countries and regions, geopolitical concerns (Syria, Iran, North Korea, etc.), and domestic political turmoil (seemingly daily events). Relative energy underperformance may indicate continued concerns regarding rapid production growth due to elevated crude oil prices encouraging more activity.
Equity Index Performance - OSX
Equity Index Performance
RECENT M&A TRENDS
M&A Activity Has Stabilized
Energy service and equipment M&A activity remained relatively stable (by count) in the first quarter of 2018 compared with prior-quarter levels while dollar volumes increased slightly. Overall first-quarter 2018 activity totaled 22 transactions, equal to first-quarter 2017 activity. Dollar volumes in the first quarter, of $826 million, remained stable at fourth-quarter 2017 levels but decreased from $1.5 billion in the first quarter of 2017, and still remain well below 2011 through 2014 “normalized” historical levels of average quarterly dollar volume of $2.4 billion. The outlook for remaining 2018 M&A and financing activity in the sector is positive as many companies require growth capital, private owners continue to assess exits after surviving the downturn, and financial performance improves.
North American Oilfield Services and Equipment Transactions
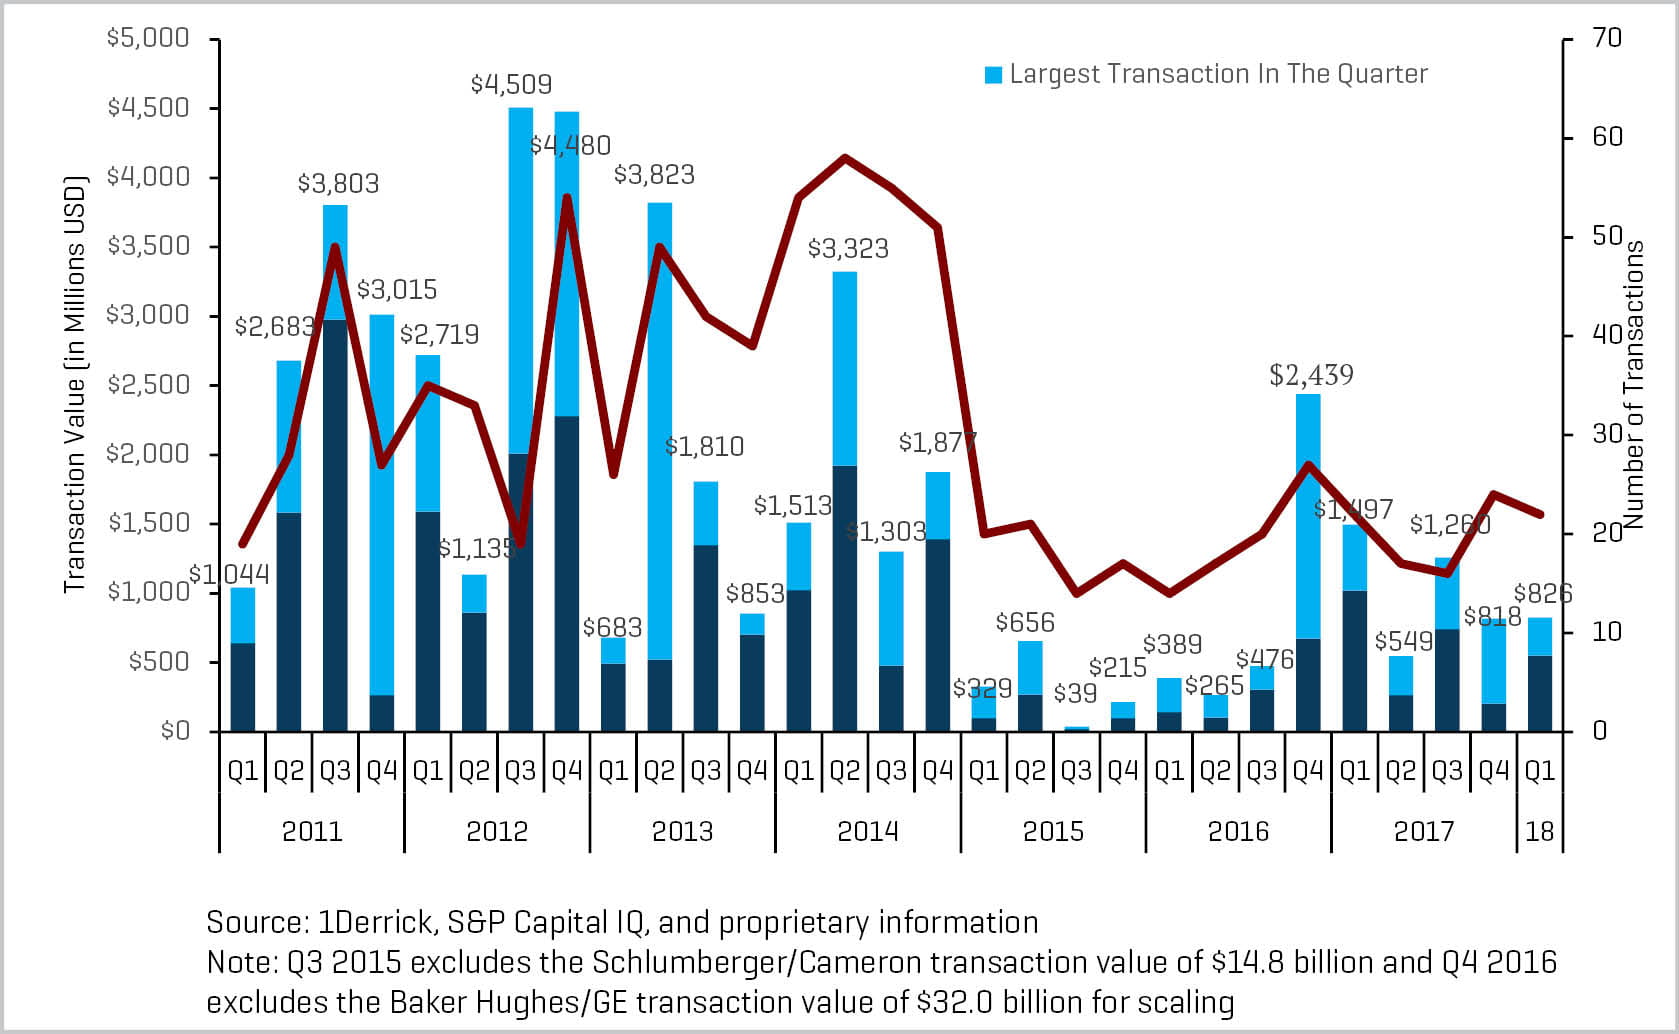
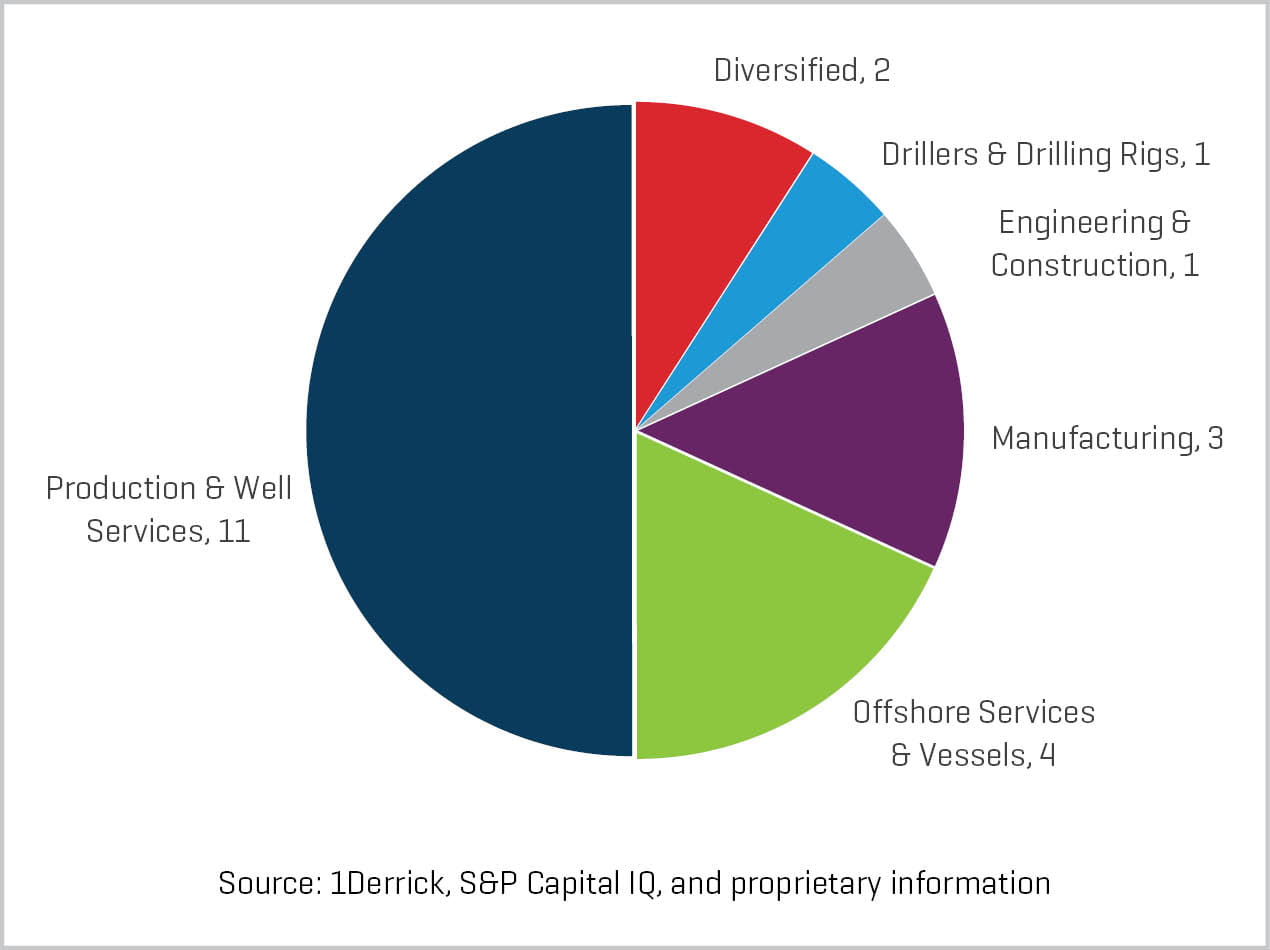
Production and well services transactions have remained the most active OFS sector in North America by transaction count and dollar value. Energy equipment manufacturing also remains very active by number of transactions. Drilling and offshore services have continued to represent the weakest sectors (by transaction count).
Q1 2018 North American Energy Service and Equipment Transaction Count by Sector
Q1 2018 North American Energy Services and Equipment Transaction Value by Sector (Millions USD)

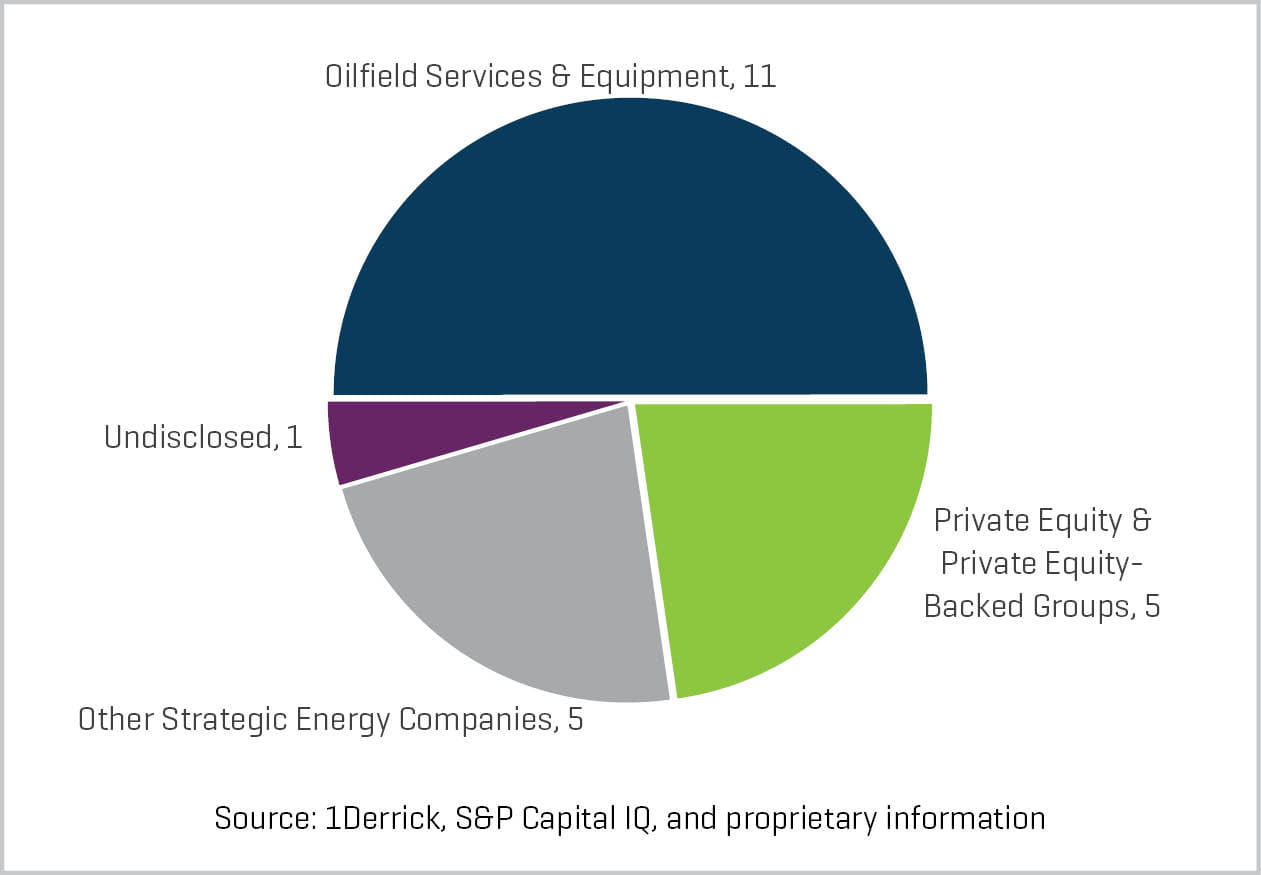
Strategic acquirers were the most active acquirers of energy service & equipment businesses during the first quarter (73% of all transactions) with private equity (PE) and PE-backed groups, the second most active buyer segment, (23% of total deals).
Q1 2018 North American Energy Service and Equipment Transaction Count by Buyer Profile