Deutsch


An updated version of this article is available. Please see "Tuning In to Spectrum Valuation," published in the Spring 2017 Journal.
Radio frequency communication is central to many functions that we take for granted, from the more obvious uses such as mobile phones, televisions (“TV”), cable TV, and radio, to the less obvious uses such as the functioning of microwave ovens, the connection of printers to wireless networks, the sensing of fluids and objects, and the validation of credit card transactions.
Guglielmo Marconi first demonstrated the use of radio frequencies to communicate in 1894. Since then, the technology of radio has grown greatly. While the use of radio expands constantly, the laws of physics have not changed. Like in 1894, and with few exceptions, you cannot transmit on a radio frequency at two points in a single area of operation at the same time without mutually destructive interference. The U.S. Congress realized that a radio spectrum regulator was needed to regulate the use of radio, first in 1927 and once again in 1934. The 1934 act created the Federal Communications Commission (the “FCC”) who was charged then, and remains today, the regulator for the use of the radio spectrum in the U.S. and its territories.
The FCC authorizes spectrum use under two regimes. The “unlicensed” radio spectrum use regime allows select radio frequencies to be used for certain defined and regulated uses without the need for the user to hold a license issued by the FCC. Generally, unlicensed radio operations are confined to lower powers that are not apt to cause interference. Examples of unlicensed use include garage door openers, wireless fidelity (“WiFi”), microwave ovens, and citizen’s band (“CB”) radios. For higher power operations, the FCC generally requires the user of the radio frequencies to obtain a license for the operations. Examples of licensed operations include over-the-air radio and television signals and cellular mobile radio systems. Licensed operations can be subdivided into two classes: those that are on shared frequencies and those that are on frequencies licensed for the exclusive use of a single licensee in an area of operations. As a general rule, the more valuable the frequency, the greater the chance that it will be licensed on an exclusive use basis. Examples of exclusive use licenses include cellular mobile radio, television, AM radio, and FM radio. While FCC licenses are typically issued for a fixed period of time, renewals of FCC licenses are routine, with no legal, regulatory, competitive, or economic reasons that would limit the useful life of the asset. As a result, for financial reporting purposes, licensees generally treat FCC licenses as indefinitely-lived intangible assets under the provisions of Financial Accounting Standards Board (“FASB”) Accounting Standards Codification (“ASC”) Topic 820, Fair Value Measurements and Disclosures (“FASB ASC 820”).1
As indefinitely-lived assets, FCC licenses are subject to impairment testing per FASB ASC 350-30-35, General Intangibles Other than Goodwill – Subsequent Measurement (“FASB ASC 350-30-35”). As a result, companies are required to value these assets on a regular basis. From a valuation perspective, FCC licenses pose a unique challenge, as the high barriers to entry, the scarcity of the assets, and the differences in both application and use among spectrum bands result in a limited amount of data available to the valuation specialist. Note that while we reference FCC licenses, the discussion below also applies to international spectrum licenses.
Value Driver
In today’s world, the most commonly valued spectrum is that used for radio and television broadcasting and for wireless communications, such as the wireless spectrum licensed to wireless operators like Verizon Communications, Inc., AT&T, Inc., Sprint-Nextel Corp., T-Mobile USA, Inc., United States Cellular Corp., and Clearwire Corporation. The wireless spectrum includes cellular mobile radio spectrum in the 800 megahertz (“MHz”) frequency range, Personal Communications Service (“PCS”) spectrum in the 1.9 gigahertz (“GHz”) frequency range, and Broadband Radio Service spectrum in the 2.6 GHz frequency range. While there is an obvious distinction between broadcast spectrum and wireless spectrum in terms of intended use, a combination of factors drives the underlying value. The primary factors include:
Regulatory Use: Restrictions on use can impact the value of spectrum. For example, television licenses are limited to simultaneous transmission of visual and aural digital signals intended to be received by the general public. In contrast, Broadband PCS encompasses a variety of mobile and/or portable radio services, using such devices as multifunction portable phones, portable fax machines, and advanced devices with two-way data capabilities that are competing with existing cellular, paging, and other land mobile services.2 Within a number of spectrum bands, specific spectrum is set aside for noncommercial use. Due to the limited pool of potential buyers, these licenses tend to have a lower value than similar licenses without those restrictions. Spectrum bands with less regulatory restrictions and more flexibility in use typically have greater value.
Spectrum Band Location: A license’s location on the spectrum band can materially impact the value of the spectrum license, which is largely due to the way that the radio spectrum behaves when it is transmitted, or propagated. All else being held equal, very high frequency (“VHF”)3 spectrum is considered to be more valuable than ultra high frequency (“UHF”) spectrum, as a number of industry experts contend that a network built around VHF spectrum costs less to build than a network built around UHF spectrum, as the strength of the signal requires fewer cell sites to be built. As you move up in frequency, more power is necessary to provide a given amount of coverage and the ability of the radio signal to penetrate buildings and other tangible obstacles decreases. With some exceptions, the higher the spectrum band in frequency, the lower the value.
Geographic Location: When valuing spectrum, location is a key value driver for two reasons, both of which relate to the size of the market. The population coverage of the license is one of the largest value drivers, as a licensee’s ability to generate cash flow is typically correlated with the size of the population (“pop”) within the coverage area. Generally speaking, more densely populated markets have greater value. For example, the average radio station in New York City is able to generate higher advertising revenue than the average radio station in Buffalo, New York. As result, potential buyers are willing to pay more for a license authorizing operations in New York City than for one authorizing operations in Buffalo. The same holds true with wireless spectrum. The larger the market, the higher the value.
Competitive Situation: When valuing spectrum licenses, it is very important to consider the competitive situation in the market and to understand the local market dynamics. If a market has a large number of operators, it may be challenging for a new operator to enter the market and gain enough market share to be competitive. From a financial reporting perspective, the competitive situation in the market may also impact the pool of market participants. For example, in the valuation of a PCS license, if all of the existing operators in the market have significant spectrum holdings and are all offering service with similar technology (i.e., CDMA), it may change the pool of market participants willing to acquire the license. The competitive situation may positively or negatively impact the value of the license.
Size of Spectrum Band: The width of the spectrum band also impacts the value of the spectrum to a certain extent. The amount of spectrum in any given market is largely a factor of the use of the spectrum. For example, all television broadcast licenses are six MHz in width. The six MHz licenses are sufficient given that broadcast spectrum is a one-to-many service offering; in short, the amount of spectrum required to provide service is not affected by the number of users of the service. For a cellular or PCS operator, however, the amount of spectrum is far more important, as having too little spectrum in a market can negatively impact the network’s performance, which is directly related to the consumption of the services by the end user. Further, the amount of spectrum available may impact the use (i.e., paired spectrum versus unpaired spectrum). Larger bandwidth licenses generally have greater value.
While there are several other factors that may also impact the value of the spectrum, the forgoing factors highlight those that are most critical. Given the wide range of factors that can impact value, it is commonplace in the industry to convert the prices paid for spectrum into multiples in order to compare prices across bands and in different markets. The most common multiple is a price per MHzPop multiple5, calculated as follows:
Price per MHzPop Multiple = Sales Price / (MHz of license x population covered)
Example: PCS License is 15.0 MHz, Covers 1 million pops; Sales price is $11.4 million;
Price per MHzPop = $11,400,000 / (1,000,000 x 15.0)
Price per MHzPop = $0.76
Regardless of the approach considered, a calculation of the implied price per MHzPop multiple is often used to test the reasonableness of the concluded value. The two most common approaches to value FCC licenses or spectrum are the market approach and the income approach. While the cost approach cannot be directly applied due to the nature of the license, a variation of the approach can be applied in certain circumstances. This article will focus on the application of the market and income approaches in the context of valuing FCC licenses.
The Market Approach
In general, the Market Approach is a valuation technique whereby the value of an asset is calculated based on the prices of actual transactions for similar assets. These observations make it possible to determine the value of assets that have no active market. In the Merger and Acquisition Method, a form of the Market Approach, we examine the terms, prices, and conditions found in actual sales of similar assets. After the relevant transactions are identified, transaction multiples (e.g., price per MHzPop or price per television household) are derived and applied to the corresponding characteristics of the FCC licenses to estimate their implied value.
Ownership of spectrum licenses ultimately lies with the U.S. Government and is controlled by the FCC. The FCC assigns the rights to these licenses through a competitive bidding process or an auction. These auctions are announced in advance and generally require potential participants to put down initial deposits to ensure that only qualified bidders participate. The auction process is the primary market in which one can obtain an FCC license. Once a license has been assigned in the auction process, the secondary or M&A market becomes the active market for the license. Based thereon, we look to both primary and secondary market sales in the valuation of spectrum licenses.
Primary Market Data – Spectrum Auctions
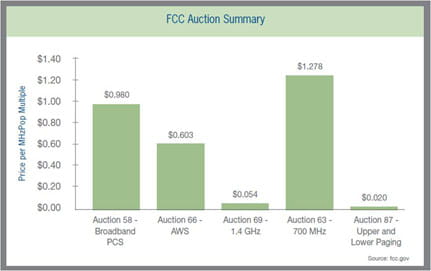
The use of FCC license auction data in spectrum valuation is very common for several reasons: (i) typically there is a substantial amount of spectrum being sold or auctioned at a given time; (ii) the auction results are freely available; and (iii) these auctions generally are open to almost everyone except foreign-controlled companies. Spectrum can be auctioned in a variety of different market sizes and areas. As shown in the summary table, auction prices for spectrum bands can vary substantially based on the type of spectrum, the geographic areas available, the spectrum holdings of existing bidders (competition), the timing of the auction and numerous other factors, some of which were discussed previously. It is important to understand the facts and circumstances surrounding an auction before drawing a value conclusion from the results.
Secondary Market / M&A Data
Like with most M&A transactions, details surrounding the sale of spectrum licenses by private parties are often difficult to obtain. While the fact of the actual sale itself is discoverable through public FCC filings, key details such as price are not required to be disclosed. However, broadcast stations are the exception, as the prices paid can be determined from copies of the asset (or stock) purchase agreement, which the FCC requires the parties to file. Therefore in valuing broadcast licenses, secondary market data is a much more commonly applied valuation approach to the extent that timely, comparable data exists for a given market or a comparable market. With other wireless spectrum transactions, some M&A data can be found in company disclosed public filings (i.e. 10-Ks, 10-Qs, press releases, etc.); however, using a small subset of data can often provide misleading results. Therefore, additional methods must be considered to further support the spectrum value.
The Income Approach (Greenfield Approach)
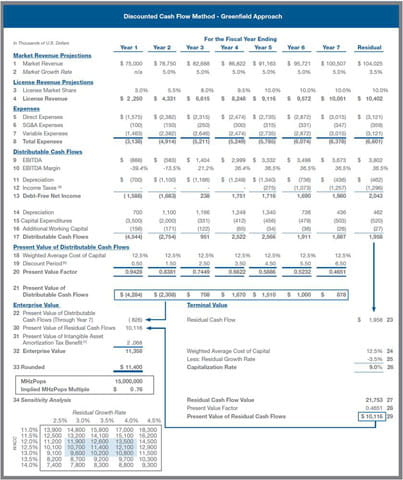
Frequently comparable and recent market data is difficult to ascertain. As a result, appraisers often turn to the income approach to derive a value for the spectrum. Application of the income approach can be challenging, as the value of the FCC license needs to be isolated, excluding any going concern value from the existing business or any other asset. In order to isolate the individual asset, a “Greenfield Approach,” a form of the Income Approach, is often applied. Originating around the time of the Jefferson-Pilot tax court case6, the Greenfield Approach generally mirrors that of a traditional income approach with respect to the discounted cash flow model (“DCF”), with a few notable exceptions, detailed below. Note that the row references relate to the sample DCF model presented on the previous page.
In the hypothetical scenario, a revenue base of zero is assumed, with the assumption that operations would begin on the valuation date.
Because operations are beginning on the valuation date, the ramp-up or growth in revenue will be low in the first few years of the projection term, until a mature level of revenue is achieved (rows 3 & 4). A mature level of revenue is determined based upon what a market participant could achieve given the competitive situation in the market as of the valuation date. This may not necessarily be consistent with the company’s existing market share.
Expenses are forecast based on the market participant’s expectations given the level of revenue and competitive situation as of the valuation date. Operating losses are typically expected in the early years as the hiring of employees, sales and marketing process, tower leasing, etc. take place (rows 5 through 8).
Assumptions are made regarding the cost to build a network or broadcast station given the technical parameters of the license. These figures may be drastically different, depending on the type of station or network being built and the market it serves. Capital expenditures may either be subtracted out of the value produced by the model or subtracted out as capital expenditures in the model, resulting in large distributable cash flow losses in the first few years of the model (rows 15 & 17).
Similar to the M&A Approach, the Greenfield Approach can be limited by the amount of information available. The development of the assumptions used to build up to the mature level of revenue, determine a station or entity’s market share, build a network, or tower site, etc. can often be time consuming and challenging, as these inputs may be materially different than a company’s specific cost and network requirements. Finding data can be particularly challenging for spectrum bands where no traditional, proven business model exists (unlike traditional broadcasting or cellular/PCS spectrum). Despite its flaws, the Greenfield Approach has been readily accepted by the U.S. tax courts and the Securities Exchange Commission (“SEC”), and has been referenced as a method to value intangibles by the American Institute of Certified Public Accountants (“AICPA”), FASB’s Valuation Resource Group, and other respected authorities.
Given the scarcity of spectrum and the consolidation in the communications industry in general, the application of the Market Approach has become increasingly challenging as there are fewer data points in the market upon which we can rely. As a result, the income approach has become more prevalent, particularly in markets with very little M&A activity. While both the income and the market approach have limiting factors, both serve as valid, defensible approaches to valuing spectrum, particularly if appropriate adjustments have been made to account for their shortcomings.
1 Difference in regulatory regimes between the U.S. and other countries may result in different treatment.
2 www.fcc.gov.
3 VHF is the radio frequency range from 30 MHz to 300 MHz. Examples of common VHF applications are FM radio broadcast, television broadcast, land mobile stations.
4 UHF is the radio frequency range between 300 MHz and 3 GHz. Examples of common UHF applications are cellular, PCS, and Worldwide Interoperability for Microwave Access (“WiMax”).
5 Note that in broadcasting valuations, this metric is often condensed to a price per pop or price per TV household, as those licenses all have the same bandwidth (or MHz). In order to compare the license values to other spectrum band licenses, a price per MHzPop would need to be calculated.