Deutsch


Introduction
For estates, too much of a good thing in the form of a large block of stock may provide increasing opportunities for tax savings. Wealthy individuals, particularly those who have created wealth through founding or serving as executives of public corporations, often accumulate blocks of hundreds of thousands or millions of shares in these companies. While a block of shares may have significant face value based on the current market price, realizing cash proceeds equivalent to this value may be unrealistic. For a block of shares that is large relative to either the number of shares outstanding or normal trading volume for that particular stock, gaining immediate liquidity can be difficult. Selling an entire block of shares in a short period will likely depress a public stock price more than the sale of a few hundred or few thousand shares. Gradually selling smaller quantities, or “dribbling out,” the block of shares prolongs an investor’s holding period and subjects the owner to daily price fluctuations. Negotiating the sale of a large block to a private investor or broker is also time consuming and can involve substantial professional fees. Private placement buyers acquiring large blocks recognize the inherent illiquity issues and may be expected to negotiate a price discount reflecting disposal risks. For these reasons, large noncontrolling blocks of public securities must often be sold at a discount, or blockage discount, to the market price.
The illiquidity of a large block presents a problem when these securities are held in an estate that needs to raise cash for estate taxes. The proper valuation of block shares incorporating a blockage discount can be an important tool in gift and estate tax planning.
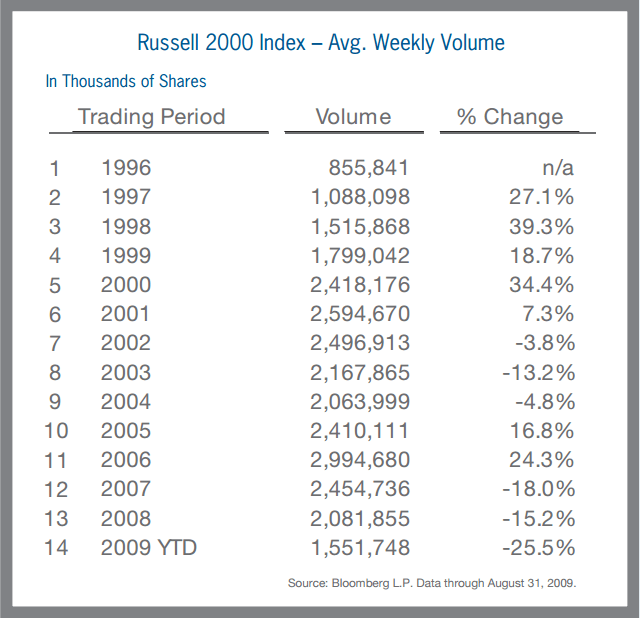
A blockage discount is defined as “an amount or percentage deducted from the current market price of a publicly traded stock to reflect the decrease in the per share value of a block of stock that is of a size that could not be sold in a reasonable period of time given normal trading volume.”1 As this definition implies, the normal trading volume of a stock is an important factor in the quantification of a blockage discount. The previous chart presents the average weekly trading volume of the stocks on the Russell 2000 Index. While trading volume increased between 1996 and 2006, this trend reversed in 2007, 2008, and through the first eight months of 2009. Declining trading activity suggests that disposing of large blocks may be increasingly difficult and that larger blockage discounts may be warranted.
Blockage Discount Analysis
Methods of Disposal
There are various means to dispose of a large block of securities, including dribbling out the shares in the public markets, selling the shares via a private placement transaction, hiring an underwriter to conduct a secondary public offering, and seeking full or partial redemption of the block from its corporate issuer. Each of these alternatives should be considered to determine the most likely method for liquidating the block. The technique or techniques selected should be the most reasonable disposal alternative and the method that yields the greatest proceeds to the owner of the block. Corporate redemptions, private placements, and secondary offerings are circumstance-specific transactions and may not always be available and/or cost-effective options. Because it can be applied in any scenario, we focus our discussion on the disposal of a large block through a series of smaller sales in public markets.
Factors Impacting Blockage Discounts
A number of key factors should be analyzed to determine the presence and magnitude of a blockage discount. Some critical considerations include:
- The size of the block relative to the total shares outstanding
- The normal trading volume of the stock
- The number of shares available for public trading relative to the total outstanding shares, or “float” of the company
- The price volatility of the stock
- The dividend policy of the stock
- Recent trends in the company’s stock price
- Legal restrictions on trading shares
The above factors relate to: 1) the likely time period over which a block can be fully liquidated; and 2) risk that the proceeds from a measured sale of the block may be less than the market price indicates. If these factors are assessed and it is determined that the block is substantial enough that it cannot be sold in a short time period without depressing the market price, then a blockage discount is present and a gradual disposition of the block or other alternative may be the most practical course of action.
While dribbling out the block shares mitigates the risk of a large price decrease from flooding the market with additional shares in an immediate sale, the owner is now subject to a prolonged holding period and risk of a price decline for reasons other than incremental trading volume. Numerous published studies (e.g., restricted stock studies) prove that investors require discounts to purchase investments with long holding periods. Stocks develop normal ranges of trading volume and the sale of a block of shares represents incremental volume over and above these established trading levels. The larger the block, the longer the time period over which incremental shares can be reasonably added to normal trading volume without causing a material reduction in the market price. Similarly, stocks with lower trading volumes will be less able to absorb incremental block sales. Price volatility and recent stock price trends also impact the magnitude of a blockage discount. If a lengthy holding period is probable, stocks that have historically exhibited significant price volatility bear more risk of a price decrease before disposition of the block is completed. A gradual sale is of greater concern when a stock price is declining than if the stock is appreciating. Blockage discounts will generally be lower on dividend-paying stocks than stocks that lack a regular dividend. Dividends represent a current return on investment during the holding period of a block, and the presence of a dividend partially mitigates the exclusive dependence on the proceeds from the gradual sale of the block.
Legal restrictions may impact an owner’s ability to liquidate a large block of shares. If a block is held by a company executive, director, or substantial shareholder, then the owner may be deemed to have “affiliate” status and must sell the block pursuant to Securities and Exchange Commission (“SEC”) Rule 144 (“Rule 144”). Additionally, compliance with insider trading policies of the corporation may further constrain when sales are permitted. Rule 144 requires that a minimum holding period (for restricted stock) and other conditions, including a trading volume formula, be met to sell shares in the open market. After the minimum holding period, if any, has been met, affiliates may not sell more shares of stock during any three month period than the greater of: a) 1% of the outstanding shares of the same class being held or b) the average reported weekly trading volume during the four weeks preceding the sale. During recent periods of reduced trading volume, the first, rather than the second, prong of the Rule 144 volume limitation may set the maximum number of shares permitted to be sold. If the block is subject to sale restrictions under Rule 144, the holding period and associated blockage discount may be significantly greater than if the block were able to be liquidated in accordance with normal market trading volume. An attorney with knowledge of securities law should be consulted to determine legal restrictions that may apply to a large block of shares.
Trends in Blockage Discount Factors
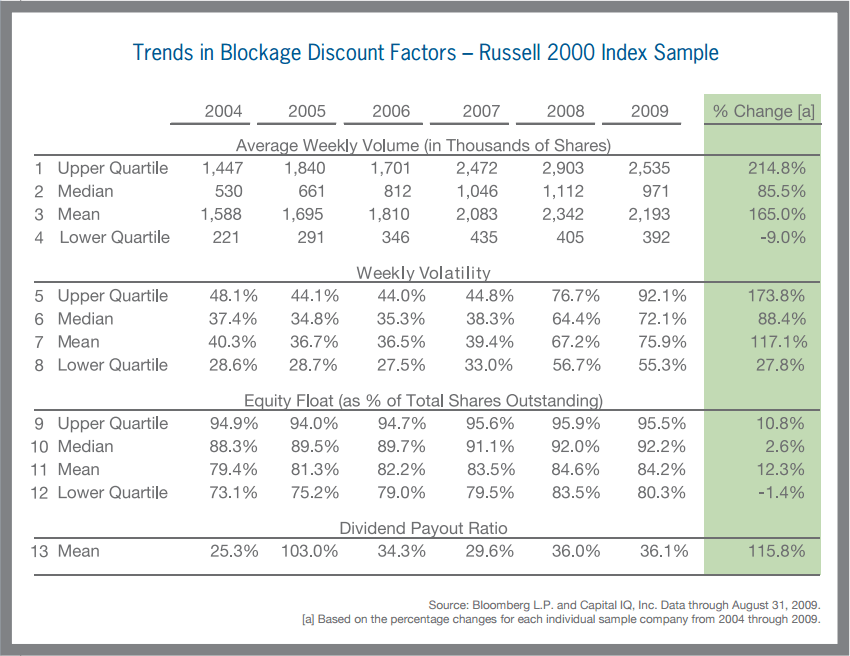
In order to analyze historical trends in certain of the aforementioned blockage discount factors, we utilized a sample of 100 stocks from the Russell 2000 Index (the “Index”) which measures the performance of the “small-cap” segment of the U.S. equity universe. We chose to analyze “small-cap” stocks since they are less widely traded than “large-cap” stocks and are more likely to maintain shareholders with holdings subject to blockage discounts. For each of the 100 Index sample stocks, we analyzed trends in: (a) average weekly trading volume, (b) price volatility, (c) equity “float” (relative to total shares outstanding), and (d) dividend payout ratio using data from 2004 through the first eight months of 2009. The summarized results of our analysis are presented in the chart below.
To ensure that we selected a sample which represents the various sizes of companies within the Index, we sorted the Index companies by market capitalization and selected every 20th stock for inclusion in the sample.
As previously mentioned, the total trading volume of the stocks comprising the Index declined over the prior three years. In contrast, the trend in trading volume of the 100 stocks selected for our sample differed from that of the overall Index. The median weekly trading volume of the stocks included in the sample increased by 86% between 2004 and 2009, with 74 of the 100 stocks demonstrating increased trading volume over this period. The changes in trading volume of the 100 stocks in the sample suggest increased liquidity and potentially lower blockage discounts; however, the declining volume of the broader Index suggests that the opposite may be true (decreased liquidity, greater discounts) for stocks not
included in the sample.
With respect to price volatility (as measured by the coefficient of variation), virtually all of the stocks in the sample (i.e., 90%) experienced an increase in price volatility. In this regard, the median volatility of the stocks included in the sample increased by 88%. The equity “float” of the 100 stocks also increased slightly over the historical measurement period. A larger equity “float” suggests increased liquidity of a stock because relatively more of its shares are available for public trading. Finally, the dividend payout ratio of a security measures the proportion of a company’s earnings that are distributed to stockholders. Of the 100 companies included in the sample, only 55 companies made a dividend payment between 2004 and 2009. The average dividend payout ratio ranged from approximately 21% to 39% between 2004 and 2009. For those stocks which paid dividends historically, the median increase in dividend payout ratio was 48% between 2004 and 2009.
Given the data above, there is no conclusive trend in the factors analyzed that suggest an overall increase or decrease in blockage discounts is warranted. Average trading volume, equity “float,” and the dividend payout ratio increased for many of the stocks included in our sample, which might imply a lower blockage discount. However, the average weekly price volatility increased over the sample period, therefore suggesting an increased risk of price fluctuations over any given holding period. When assessing the presence and magnitude of a blockage discount, it is the characteristics of that particular stock that are relevant, not the trends of a broad index or sample.
Quantifying the Blockage Discount
When estimating a blockage discount for an orderly sale of the block in smaller increments, an assumption will need to be made as to how that sale will transpire. The historical trading volume and price volatility of the stock are analyzed to ascertain the number of shares that can be added to the normal trading volume and the time period over which those shares can be sold without depressing the market price. Once these determinations have been established, the blockage discount can be quantified. There are several methods for estimating a blockage discount including benchmarking the illiquidity of the block relative to restricted stock studies. Another method involves projecting the cash flows expected to be received via the orderly liquidation of the block and discounting them at an appropriate rate of return.2 The implied blockage discount is the calculated difference between the present value of the projected cash flows and the proceeds received if the subject block were able to be sold on the valuation date at the market price.
Restricted stock studies compare the quoted price of freely traded public stock to the price at which restricted (i.e., letter) stock of the same company was purchased. Letter stock is identical to freely traded stock except for temporary restrictions that preclude it from trading on the open market for a certain period of time. The purchase and resale of restricted securities is governed by SEC Rule 144. Holders of the letter stock in the restricted stock studies were required to hold their securities for a defined period (usually one or two years) before being able to sell the shares in public markets. The discounts implied by the restricted stock studies range from 20% to 45%, with larger discounts observed for letter stock with a longer required holding period. The holding period/discount relationship observed from the restricted stock transactions can be used to estimate the discount applicable to a large block.
It should be noted that the illiquidity of a restricted stock differs from that of a block of a securities. Restricted shares legally must be held for a defined period of time, after which they can be sold in public markets without delay. Shares in a large block can be sold immediately (provided any holding period required of an affiliate has been met). The illiquidity of a large block of shares results from the inability to sell the entire block of shares in a reasonable time frame without depressing the current market price. Because the block shares can be sold evenly over the estimated liquidation period, the effective holding period is actually one-half of the liquidation period. The effective holding period of the block is the time period that should be compared to the holding period/discount relationship derived from the restricted stock data.
A second methodology to quantify a blockage discount is to calculate the present value of the cash flows received from liquidating the block shares. The periodic cash flows received from the gradual sale of the block should be projected until the block is fully liquidated as should any dividends on shares owned during the liquidation period. It is assumed that the block shares can be sold at a constant price (the price on the valuation date) and that dividend payments will be consistent with historical levels. The total cash flows received from dividends and the sale of shares should be discounted back to the valuation date at an appropriate equity rate of return. This rate of return should reflect the risk of the owner of the block achieving the projected cash flows. These risks may include a declining stock price during the liquidation period, a reduction or elimination of dividend payments, or a protracted holding period due to lower than anticipated trading volume. The implied blockage discount is calculated as the percentage difference between the present value of the projected cash flows and the face value of the block shares as of the valuation date.
There are variations of these methods for quantifying a blockage discount. As such, it is prudent to utilize as many methods as is practical when estimating the blockage discount. Finally, the strengths and weaknesses of each method should be assessed and ultimately reconciled to an overall concluded discount.
Conclusion
For the majority of the 100 stocks sampled from the Russell 2000 Index, trading volume increased since 2004. However, the average weekly trading volume of the overall index in 2009 was down approximately 50% from the high water mark observed only three years earlier in 2006. This dichotomy may indicate that there are a substantial number of stocks on the Russell 2000 Index, but not in the sample, that are experiencing severe declines in trading volume. The data in our analysis does not suggest that larger or smaller blockage discounts are warranted. Rather, the results of our research emphasize the importance of thoroughly analyzing the factors that influence the liquidity of large blocks because the trends in those factors vary widely from individual security to individual security.
Blockage discounts are not immune from supply and demand conditions of the overall market. During periods when equity buyers pull back from the market as evidenced by reduced trading volume, it may be expected that block transactions are similarly adversely affected by fewer buyers. A smaller pool of potential purchasers leads to a buyer’s market where lower prices are negotiated and blockage discounts increase. In periods of market-wide reduced trading volumes, the volume limitations under Rule 144 may contract to 1% of outstanding shares, increasing the disposition period of the block, and resulting in larger blockage discounts.
1 American Society of Appraisers: Business Valuation Standards: Glossary, 2008.
2 This was the methodology followed by the tax court in Estate of Georgina T. Gimbel v. Commissioner, United States Tax Court, T.C. Memo 2006-270, December 19, 2006. For the decedent who died in 2000, the court determined that the applicable Rule 144 disposal period was 3.25 years and that the present value calculation of sale proceeds plus dividends over the period resulted in a 14.4% discount from the date of death share price.