中文
中文


As the healthcare industry continues to evolve, healthcare organizations often must evaluate different transactions including mergers, acquisitions, and joint ventures. When assessing the financial feasibility of a transaction, healthcare organizations may prepare different pro formas and benefit from knowing how revenue may be impacted assuming healthcare services are billed under certain payor contracts. However, the ability to review another party’s payor contracts is not always possible given confidentiality provisions and anti-trust laws. Therefore, parties to a transaction may engage an independent third-party to prepare a black-box reimbursement analysis that estimates revenue for potential business combinations or joint venture arrangements under different payor contracts. These analyses are prepared in a “black-box” in the sense that reimbursement information by payor and procedure are only shared with the independent third-party and not between the parties to a transaction who may otherwise be competitors.
This article demystifies black-box analyses and delves into the applications, methodology, and important considerations when preparing these assessments.
Use Cases for Reimbursement Analyses
Commercial reimbursement can vary significantly across providers, payors, and geographic regions. U.S. federal regulations require hospitals and health plans to publicly disclose payor-specific negotiated rates in machine-readable formats under the Federal Hospital Price Transparency and Transparency in Coverage rules.1,2 While intended to create a more competitive market where patients can compare costs for certain services, these datasets also provide healthcare providers valuable insight into relative pricing across payors, providers, and markets.
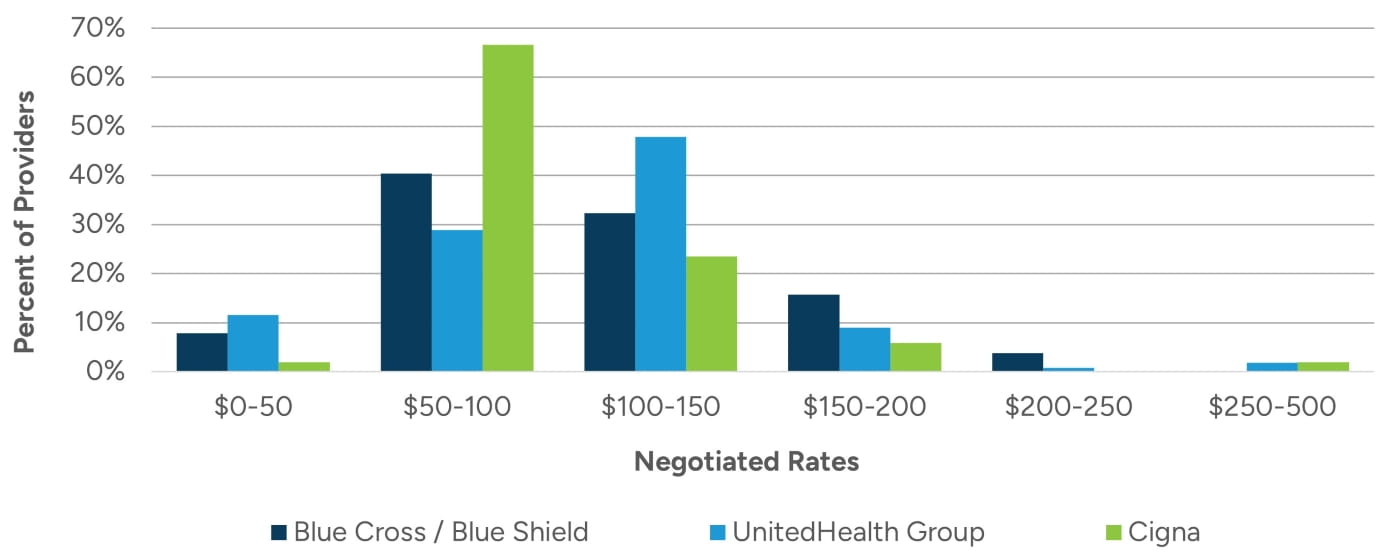
Transparency in Coverage data (TiC Data) has drawn attention to the often-significant variation in prices for the same services. For example, reimbursement for CPT code 99213 in an office setting in the same state can range from $30 to $460 across commercial payors.3 Figure 1 illustrates the distribution of negotiated rates for an established patient office visit in a select state for Blue Cross / Blue Shield, UnitedHealth Group, and Cigna.
The disparity in rates highlights the opportunity to improve revenue through mergers, acquisitions, or the formation of a joint venture. Black-box analyses help organizations evaluate the financial feasibility of new ventures and develop reimbursement expectations when preparing pro formas.
One example of this is in the context of a health system evaluating the potential acquisition of a physician practice. Some physician practices lack leverage to negotiate competitive reimbursement rates on their own, as they often lack scale and geographic coverage. To address these gaps, physician practices may choose to join an independent physician association (IPA), partner with a physician practice management company (PPMC), or affiliate with a health system. By aligning with partners who have stronger contracts, these physician practices may experience revenue improvement even in cases where a practice loses some patients.
A recent study shows that negotiated prices for office visits were 11% higher for hospital-affiliated primary care physicians relative to independent primary care physicians.4 This can translate to thousands of dollars in incremental annual revenue.
Figure 1: 2025 Payor TiC Data in a Select State for CPT Code 99213 for Blue Cross / Blue Shield, UnitedHealth Group, and Cigna
To demonstrate the financial impact of improved reimbursement, Figure 2 presents a simplified income statement for a hypothetical independent primary care practice before and after affiliating with a health system. In this example, the practice historically operates with commercial rates that are lower than its competitors. After joining a larger health system and gaining access to its negotiated rates, the practice experiences an 11% reimbursement lift on its commercial rates. Assuming that 45% of the practice’s payor mix consists of patients with commercial insurance, this results in a weighted 5% increase in patient service revenue (assuming constant reimbursement for all other payors). As outlined in Figure 2, with no changes in expenses, this revenue lift would increase the practice’s earnings by nearly 6x.
In this example, the health system could potentially increase provider compensation. As outlined in Figure 3, assuming the providers continued to be compensated at 59.2% of collections after hospital affiliation, the increase in reimbursement would result in a 5% increase in provider compensation while still increasing the practice’s EBITDA by approximately 2.4x.
Figure 2: Example Income Statement Impact of Improved Reimbursement
|
Income Statement for a Hypothetical Practice |
|
|
|
|
|---|---|---|---|---|
| Practice Payor Contracts | Hospital Payor Contracts | ($) Change | (%) Change | |
| Patient Service Revenue | $6,000,000 | $6,297,000 | $297,000 | 5.0% |
| Total Revenue | 6,000,000 | 6,297,000 | 297,000 | 5.0% |
| Provider Compensation | 3,550,000 | 3,550,000 | 0 | 0.0% |
| Staff Wages & Benefits | 1,400,000 | 1,400,000 | 0 | 0.0% |
| Occupancy Costs | 700,000 | 700,000 | 0 | 0.0% |
| Other Operating Expenses | 300,000 | 300,000 | 0 | 0.0% |
| Total Expenses | 5,950,000 | 5,950,000 | 0 | 0.0% |
| EBITDA | $50,000 | $347,000 | $297,000 | 594.0% |
Figure 3: Example Income Statement Impact of Improved Reimbursement With Increased Provider Compensation
|
Income Statement for a Hypothetical Practice |
|
|
|
|
|---|---|---|---|---|
| Practice Payor Contracts | Hospital Payor Contracts | ($) Change | (%) Change | |
| Patient Service Revenue | $6,000,000 | $6,297,000 | $297,000 | 5.0% |
| Total Revenue | 6,000,000 | 6,297,000 | 297,000 | 5.0% |
|
Provider Compensation (59.2% of Collections) |
3,550,000 | 3,725,725 | 175,725 | 5.0% |
| Staff Wages & Benefits | 1,400,000 | 1,400,000 | 0 | 0.0% |
| Occupancy Costs | 700,000 | 700,000 | 0 | 0.0% |
| Other Operating Expenses | 300,000 | 300,000 | 0 | 0.0% |
| Total Expenses | 5,950,000 | 6,125,725 | 175,725 | 3.0% |
| EBITDA | $50,000 | $171,275 | $121,275 | 242.6% |
While simplified, Figures 2 and 3 demonstrate how reimbursement can drive value in transactions. Black-box analyses are helpful in connection with acquisitions, as they allow a buyer to understand what revenue potential looks like post-acquisition. These analyses can be performed for all entity types ranging from hospitals and physician practices to ambulatory surgery centers and imaging centers.
These analyses are also commonly applied in situations such as:
- Modeling income repair for physicians in transactions where there is a compensation scrape;
- Evaluating relative payor contract strength between two parties who are forming a joint venture;
- Analyzing the potential revenue impact to a physician practice from participation in a clinically integrated network;
- Benchmarking reimbursement against other providers in the market utilizing TiC Data; and
- Assessing the financial impact of going in-network or out-of-network with select payors.
In all of these scenarios, having a black-box analysis will help with making informed business decisions.
Black-Box Reimbursement Analysis Methodology
A black-box analysis begins with historical procedural data (e.g., CPT code/HCPCS volume) which is repriced under different payor contracts. Depending on the availability of data, one or both of the following analyses are considered.
Compare a group’s expected and actual collections, by payor, to the expected reimbursement assuming the same historical procedures were billed under the second party’s fee schedules.
Apply both group’s fee schedules directly to the historical procedural data.
Comparison to Expected and Actual Collections
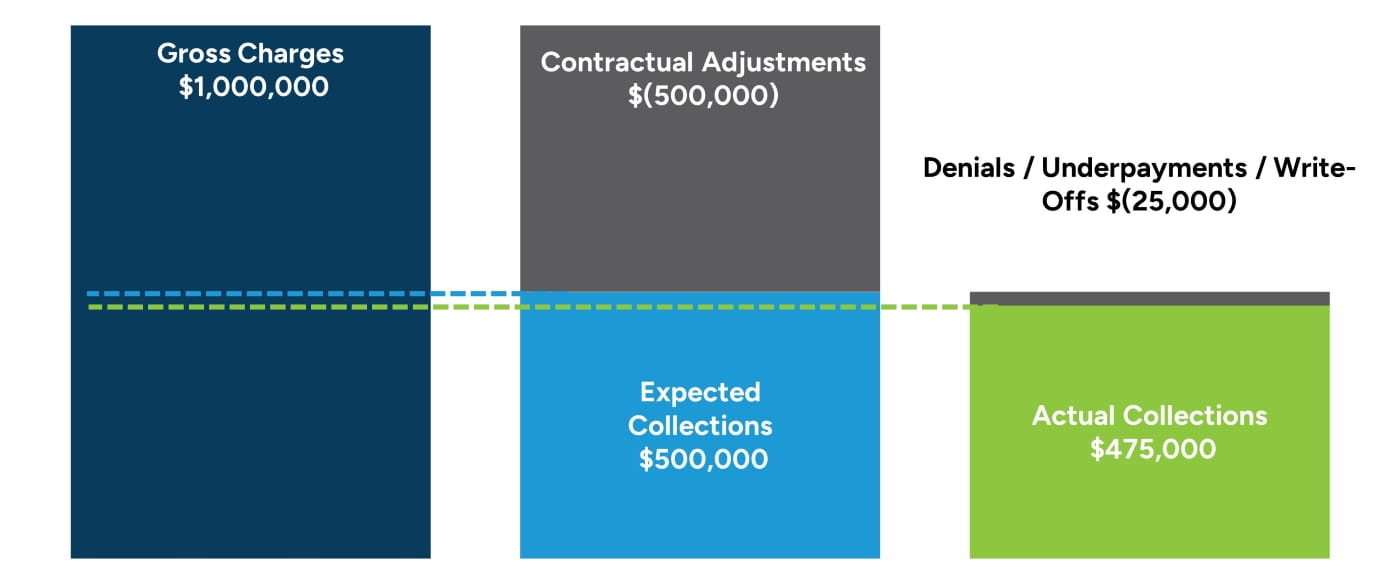
This approach compares one party’s fee schedules to the target’s actual and expected collections, by payor. Actual collections represent payments the target received, whereas expected collections reflect what the practice should collect under its contractual rates (i.e., calculated as the difference between charges and contractual adjustments).
While one might anticipate actual and expected collections to closely align, gaps between these two metrics may indicate operational inefficiencies that impact realized reimbursement. Such operational inefficiencies include delays in claim submission, coding errors, denied claims, or ineffective follow-up processes. Comparing expected versus actual collections allows us to isolate changes in reimbursement from the claims adjudication process. Figure 4 illustrates the differences between gross charges, expected collections and actual collections. The chart shows the impact of contractual discounts (charges to expected collections) and operational inefficiencies (expected to actual collections).
Figure 4: Relationship of Gross Charges to Expected and Actual Collections
Comparison of Fee Schedules
Another approach that can be utilized is to apply both parties’ fee schedules to the target’s historical procedural data to estimate expected revenue. This comparison evaluates payment rates by payor and is weighted by the actual mix of procedures.
For both approaches, black-box analyses need to account for the reimbursement methodologies and payment mechanics relevant to each care setting/entity type as discussed herein. Figure 5 outlines common entity types evaluated and some of the contract structures observed for each entity type.
Figure 5: Common Entity Types & Key Reimbursement Considerations
|
Entity Types |
Reimbursement Considerations |
|---|---|
| Clinically Integrated Networks (CINs) | Assess whether these groups have value-based contracts and review how the groups have performed under these contracts historically. |
| Physician Practices/Medical Groups | Billed using Level I and Level II Healthcare Common Procedure Coding System (HCPCS) codes. Specialty-specific reimbursement considerations, coding patterns, and site-of-service often play meaningful roles in financial outcomes. |
| Physical Therapy Providers | Fee schedule variation and utilization impacts. Time-based versus per-visit billing. |
| Diagnostic Imaging Centers | Modality-specific payment policies, site-of-service considerations, and bundling rules. |
| Ambulatory Surgery Centers (ASCs) | Grouper rate logic, multiple-procedure discounting, and implant reimbursement. |
| Hospital Inpatient & Outpatient Departments | Diagnosis Related Group (DRG), Ambulatory Payment Classification (APC), and grouper rate payment logic. |
Impact of Modifiers on Reimbursement
Black-box analyses should account for modifier-specific adjustments. Some of the most common modifiers with payment adjustments include the -TC and -26 modifiers, which split a global service into its technical and professional components. For example, the -TC modifier reimburses only the technical portion of a diagnostic test (e.g., equipment, supplies, and technician time), while -26 reimburses only the professional component (e.g., physician interpretation). Figure 6 details other common modifiers and their adjustments.
Figure 6: Common CPT Code Modifiers
|
Modifer |
Adjustment |
Description |
|---|---|---|
| 20 | 1.25 | Microsurgery |
| 21 | 1.25 | Prolonged Evaluation & Management Services |
| 22 | 1.25 | Unusual Procedural Services |
| 50 | 1.50 | Bialteral Procedure |
| 51 | 0.50 | Multiple Procedures |
| 52 | 0.50 | Reduced Services |
| 53 | 0.50 | Discontinued Procedure |
| 54 | 0.80 | Surgical Care Only |
| 55 | 0.10 | Postoperative Management Only |
| 56 | 0.10 | Preoperative Management Only |
| 62 | 0.63 | Two Surgeons |
| 66 | 0.33 | Surgical Team |
| 78 | 0.80 | Return to Operating Room During Postoperative Period |
| 80 | 0.16 | Assistant Surgeon |
| 81 | 0.16 | Minimum Assistant Surgeon |
| 82 | 0.16 | Assistant Surgeon (When Qualified Resident Not Available) |
Billing Versus Rendering Provider
Procedure and claim records typically list both a billing provider and a rendering provider. For reimbursement analyses, the rendering provider is important because it indicates whether a service was performed by a physician or an advanced practice provider (APP). APP services can be billed incident-to a supervising physician or under the APP directly. Because physician and APP rates often differ, understanding who performed the service, and how the practice bills those services, can affect estimated revenue.
Incident-to billing allows APPs to report services as if they were performed by a physician. Under Medicare rules, covered services provided by APPs are typically reimbursed at 85% of the professional fee amount when billed directly by an APP and not incident-to a physician. However, services properly reported incident-to are reimbursed at the full value.
Out-of-Network Volume and Pricing Impacts
Financial outcomes can also be materially affected by out-of-network (OON) payors, particularly when parties have differing payor participation. To avoid overstating expected revenue, our analyses consider both volume attrition assumptions and expected pricing dynamics for retained OON encounters. According to findings published in Health Affairs, approximately 4% to 5% of primary care spending occurs out of network.5 Further, the same study found that OON reimbursement rates can exceed in-network levels, with ratios ranging from 109% to 227% of contracted rates for certain high-volume services in primary care. However, the degree of volume attrition can vary by specialty, with higher retention often observed for mental health services or those with a shortage of providers in the community.6,7
Site of Service Impacts
Reimbursement for many CPT codes vary depending on the site of service. Medicare and commercial payors typically have separate rates depending on whether a service was performed in a facility (e.g., hospital) or non-facility (e.g., physician office) setting. Some CPT codes may only have a facility rate if the procedure is only performed in a facility setting. Facility rates assume that the hospital incurs the overhead costs associated with the visit, so the overall reimbursement paid to the clinician is lower. Non-facility rates include reimbursement for both the professional services and practice expenses (e.g., staff and equipment). For example, an established patient office visit at level four (CPT code 99214) is reimbursed 34% higher in a non-facility setting compared to a facility setting.8 When modeling reimbursement, applying the correct place-of-service rate is important, as shifting a provider’s service mix toward or away from facilities can materially change projected revenue.
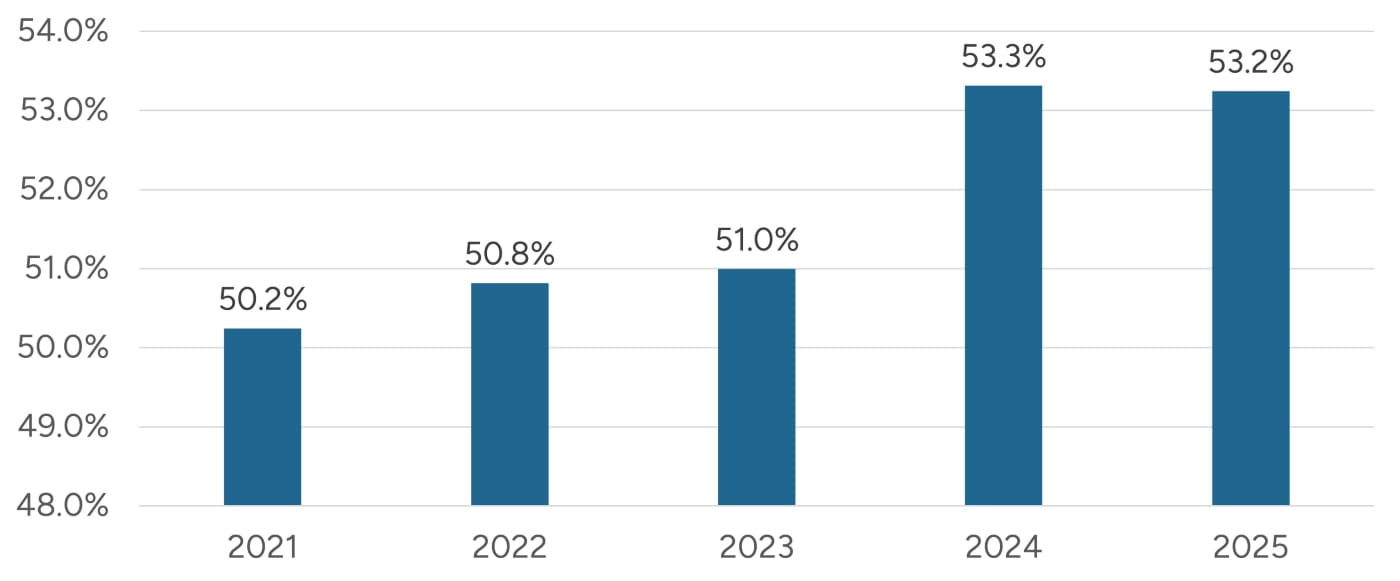
Reimbursement differentials between sites of service can also be seen when comparing hospital outpatient departments (HOPDs) to ambulatory surgery centers (ASCs). HOPDs often receive higher reimbursement for the same procedure relative to ASCs, sometimes 1.5x to 2.0x depending on the code group.9 For example, Medicare payments for a diagnostic colonoscopy are $831 when performed in an HOPD versus $426 when performed in an ASC. This difference is largely due to HOPDs having higher overhead costs since they are part of a larger hospital system, while ASCs are freestanding facilities with lower overhead.
Figure 7 illustrates that ASC Medicare rates have ranged from 50% to 55% of HOPD rates. Despite the higher reimbursement in a HOPD setting, many health systems have converted HOPDs into ASCs as a move to preserve physician relationships and retain procedural volume. A 2025 survey reports that 82% of hospitals and health systems owned at least one ASC, up from 48% in the prior year, and that 90% plan to increase ASC affiliations.10 Stout has observed a similar trend of hospitals and health systems placing a focus on growing their ASC strategy.11
There are many factors impacting the reimbursement that a provider receives. It is important that these are all accounted for to ensure that an apples-to-apples comparison is made when preparing black-box analyses. Black-box analyses can be an important input in developing pro formas.
Figure 7: Freestanding ASC Medicare Rates as a Percent of HOPD Rates11
Pro Forma Revenue
Organizations expanding into new service lines or geographic markets can use black-box reimbursement analyses to forecast expected revenue based on projected case mix and payor mix. Revenue potential can be impacted by various factors including auto-down coding, provider type differentials, market-specific adjustments, case mix, and payor mix shifts. These variables all impact revenue and should be evaluated alongside rate comparisons.
Automated Down-Coding
One emerging factor influencing realized reimbursement is the accelerating use of automated down-coding by commercial payors. Historically, down-coding occurred primarily through manual audit processes. However, since 2022, payors have increasingly used machine-learning and AI-powered algorithms to adjust evaluation and management (E/M) services and other professional claims. Recent industry research has documented a sharp rise in automated down-coding, particularly for higher-level E/M services (e.g., adjusting from 99214 down to 99213, and from 99215 down to 99214) and certain telehealth and split/shared visits.12 These automated edits benchmark provider billing patterns against peer cohorts and may trigger reclassification even when documentation supports the original code selection. As a result, practices report revenue erosion, increased administrative burden associated with appeal cycles, and extended collection timelines.
An assumption in black-box analyses is that groups are accurately documenting and coding procedures. While a formal coding audit is necessary to assess the accuracy of coding, comparing a practice’s E/M service distribution to industry benchmark data can help provide high level insights into coding practices. Figures 8 and 9 illustrate E/M services distribution for both new patients and established patients for family medicine practices, as benchmarked against data published by Medicare and MGMA.13, 14 In both datasets, the majority of E/M CPT codes were billed at levels three and four for both new patients and existing patients. Practices whose E/M mix skews toward higher-level services may be more likely to experience automated down-coding.
Figure 8: New Patient E/M CPT Codes
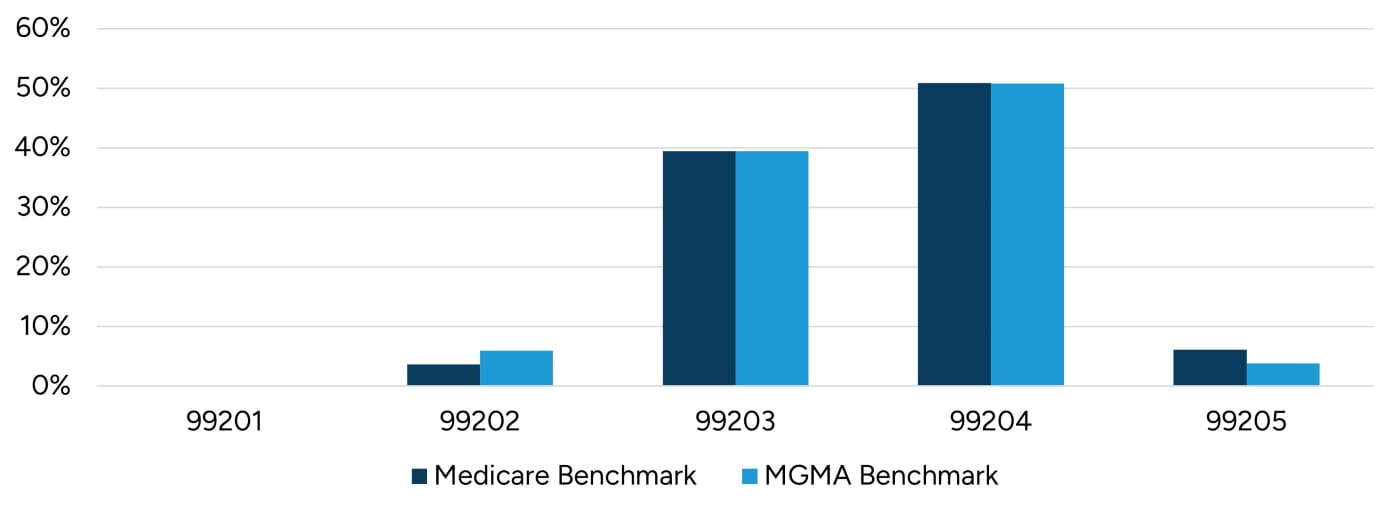
Figure 9: Existing Patient E/M CPT Codes
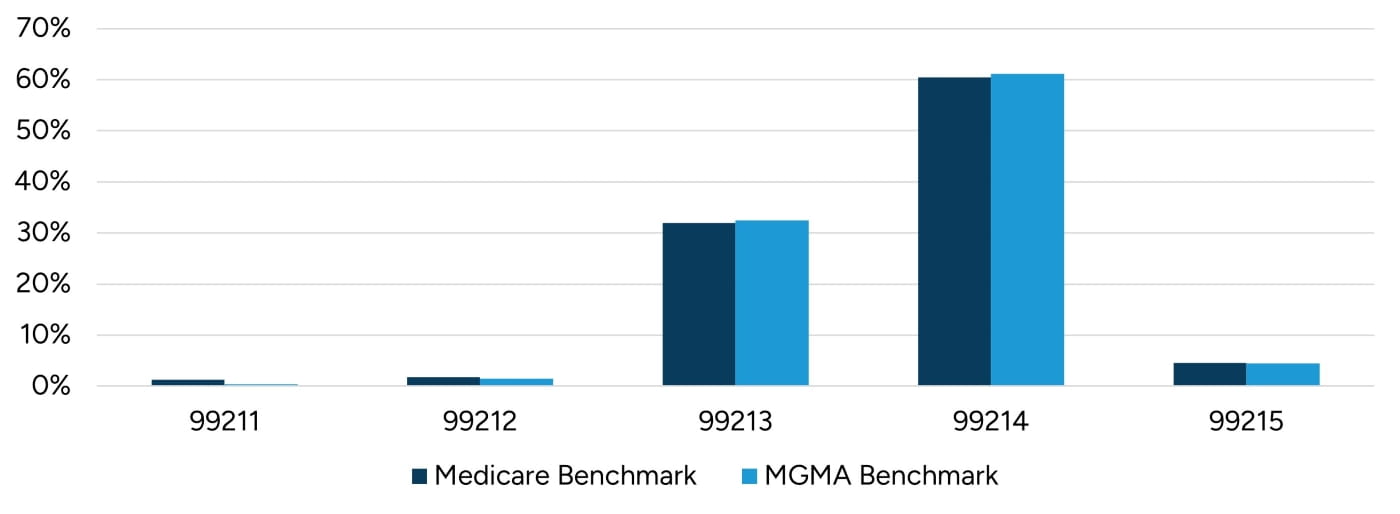
In cases where a practice’s E&M code distribution varies significantly from benchmark data, multiple pro formas may be prepared to understand the financial impact of billing E&M codes at levels that mirror industry levels.
Contract Timing/Assignability
It’s important to understand payor contract terms that may impact the timing and ability to add facilities or providers to existing payor contracts post-transaction. In many cases, payors may permit a subsidiary to use its parent’s contracts when the parent owns at least 51% (or has control) of the subsidiary. These terms should be confirmed early when structuring a transaction to ensure pro forma revenue is modeled accurately. If a payor contract cannot be assigned to the acquirer, new contracts would have to be negotiated, which could result in a provider losing in-network status and may cause further patient disruptions and revenue loss.
Contract Structure & Case Mix
Revenue potential is also shaped by how a payor contract is structured, and the strength of that contract depends on how the reimbursement rates apply to a target’s actual service mix. Payor contracts are typically negotiated on an aggregate basis, with providers and payors evaluating the expected total revenue generated across the anticipated mix of services rather than considering reimbursement for each individual code. As a result, a provider may accept lower reimbursement for certain services, such as E/M visits, in exchange for higher rates on other services, such as procedures or surgeries that are more heavily utilized within its practice. Accordingly, a provider’s contracts may perform well for their existing case composition, but results may differ when applied to another organization’s service mix, geography, or payor mix. Even among similar specialties, variations in the mix of procedures and site-of-service utilization can materially shift realized collections. Additionally, payment methodologies frequently differ between organizations and across payors, impacting how services are priced. Factors such as bundling logic and implant or drug carve-outs can cause nominally better contracts to underperform when applied to new utilization patterns.
Conclusion
Black-box reimbursement analyses provide healthcare organizations with a practical way to understand revenue performance, even when contract details are not fully accessible. These analyses offer ways to compare payment outcomes and identify revenue opportunities. The examples and considerations discussed in this article illustrate how even modest rate changes can materially affect earnings. Therefore, clear reimbursement insights support organizations in planning and forming more reliable pro formas.
At Stout, we combine healthcare valuation expertise with detailed black-box reimbursement analyses to help organizations better understand financial performance. If you would like to learn more about how reimbursement analyses can support your organization, please contact us.
- The Centers for Medicare & Medicaid Services (CMS), “Hospital Price Transparency,” Code of Federal Regulations Title 45 Part 180, effective January 1, 2021; see also CMS, “Hospital Price Transparency.”
- Common machine-readable formats include .XML (extensible markup language), .JSON (JavaScript Object Notation), and .CSV (comma-separated values).
- Current Procedural Terminology (CPT) is a uniform coding system that consists of 5 numeric digits that is maintained by the American Medical Association (AMA).
- Yashaswini Singh et al., “Growth of Private Equity and Hospital Consolidation in Primary Care and Price Implications,” Jama Health Forum, January 17, 2025.
- Zirui Song et al., “Out-Of-Network Spending Mostly Declined In Privately Insured Populations With A Few Notable Exceptions From 2008 To 2016,” Health Affairs, June 2020.
- Marcia Frellick, “Top Reasons Patients Go Out of Network,” MedCentral, March 31, 2024.
- Grace McCormack and Erin Trish, “Out-Of-Network Utilization and Plan Selection Among Medicare Advantage Cost Plan Enrollees,” Health Services Research, January 14, 2025.
- National average reimbursement for CPT 99214 in a non-facility setting is $125.88 compared to a $93.80 in a facility setting (2025 Medicare Physician Fee Schedule).
- Miho J. Tanaka, “Ambulatory Surgery Centers Versus Hospital-based Outpatient Departments: What’s the Difference?”, AAOS Now, September 1, 2019.
- Avanza Healthcare Strategies, “6th Avanza Intelligence Hospital Leadership ASC Survey,” May 2025.
- Based on comparison of Medicare reimbursement for CPT code 66984 (Extracapsular cataract removal with insertion of intraocular lens prosthesis (1 stage procedure)). According to the MedPAC March 2025 Report to the Congress: Medicare Payment Policy, this procedure represents the most common FFS Medicare procedure performed in ASCs.
- Cathy McDowell, “The Rise of Automated Downcoding: Trends, Causes, and Strategies for Physician Practices,” Karen Zupko & Associates, Inc., August 2025.
- Industry benchmark data is based on the allowed services for the specialty of family practice in the Medicare Part B Physician/Supplier National Data CY 2023 - Evaluation and Management Codes by Specialty. The 2023 industry benchmark data is the most recent data available.
- Industry benchmark data is based on the evaluation and management code data for the specialty of family medicine (without obstetrics) from MGMA DataDive. We have utilized the available 2024 report that is based on 2023 data.