Italiano


In recent years, hospitals and health systems across the U.S. have encountered mounting challenges in securing crucial anesthesiology coverage necessary to support surgical, obstetric, and procedural care delivery. While anesthesiology staffing challenges certainly existed prior to the COVID-19 pandemic, recent market dynamics have intensified, resulting in heightened competition for anesthesiologists and certified registered nurse anesthetists (CRNAs), extraordinary increases in provider compensation, and greater financial strain for hospitals.
The anesthesiology labor market has been impacted by a combination of factors, including post-pandemic surgical volume normalization and increased demand from an aging demographic, ongoing workforce attrition among practicing providers, and insufficient supply of newly trained anesthesiologists and CRNAs to offset rising demand. At the same time, private equity (PE) investment in anesthesia management companies has accelerated consolidation, increasing negotiating leverage for large national staffing platforms and intensifying competition for scarce clinical labor. These dynamics were accompanied by increasing federal and state scrutiny of consolidation in anesthesia providers, including recent antitrust actions involving large national anesthesia platforms.
As a result, hospitals that have historically relied on independent anesthesiology groups operating under exclusive professional services arrangements are increasingly finding it necessary to agree to intricate financial arrangements to secure required coverage. These arrangements have grown more complex both operationally and financially, raising questions as to the long-term sustainability of the current paradigm.
This article examines the evolving anesthesiology and CRNA marketplace, focusing on supply and demand dynamics, declining reimbursement trends, the prevalence of PE investment, and the implications of these forces on hospital-anesthesiology provider staffing arrangements. Particular emphasis is placed on how these market conditions are reshaping compensation expectations, employment models, and the future alignment strategies between hospitals and anesthesia providers.
Surging Demand and Constrained Provider Supply
Demand Growth Drivers
First, the continued expansion of ambulatory surgery centers (ASCs), now totaling approximately 11,500 nationwide and reflecting roughly 15% growth over the past decade, has shifted surgical case volume away from the hospital setting.1 This expansion has increased the number of distinct care sites requiring anesthesia coverage, resulting in surging provider staffing demands. When compared with hospital OR platforms which can redeploy anesthesia providers across multiple rooms and procedural areas, ASCs generally have less flexibility, leading to lower utilization of anesthesia labor and, consequently, higher per-case economics. Stout has increasingly observed an increased prevalence of financial support payments to anesthesia groups covering ASCs.
Second, the aging U.S. population is associated with higher per-capita surgical and interventional procedures.2 Given that anesthesia care is required for most of these interventions, aging trends translate directly into increased case workloads and have contributed to steady, volume-driven growth in demand for anesthesiologists and CRNAs.
Third, demand pressure is compounded by expanding coverage requirements. Hospitals nationwide have experienced growing difficulty securing coverage for off-hours, trauma call, obstetrics, and non-operating room anesthesia locations. Because these coverage obligations require continuous provider availability regardless of surgical volume, they place additional strain on an already limited anesthesiology workforce. These pressures are not evenly distributed, as shortages remain particularly acute in rural markets, independent practice states, and regions with high outpatient surgical volume. These coverage obligations often generate limited professional fee revenue relative to staffing costs, further intensifying reliance on financial support arrangements. Compensation benchmarks historically predicated on balanced labor markets may no longer reflect prevailing economic realities, particularly in regions experiencing acute provider scarcity.
Lastly, growth in non-operating room anesthesia (NORA) procedures has increased anesthesia staffing demand. Studies report that NORA procedures have more than doubled over the past two decades and now represent up to half of anesthetic workload in some hospitals, particularly across gastroenterology, interventional radiology, cardiology, and electrophysiology service lines.3
Anesthesiologist Supply Shortages
Physician workforce shortages remain a persistent challenge across the U.S. healthcare system, with anesthesiology emerging as one of the most acutely constrained labor markets for hospital-based specialties. While current supply shortages exist even with an estimated 52,300 practicing anesthesiologists nationwide, a shortage of 10,660 anesthesiologists is predicted by 2038 according to The Health Resources and Services Administration (HRSA).4 This shortage is primarily due to limited residency capacity, an aging population demographic, and growth in procedural demand.5
Figure 1 – Anesthesiologist Supply and Demand Projection (HRSA)
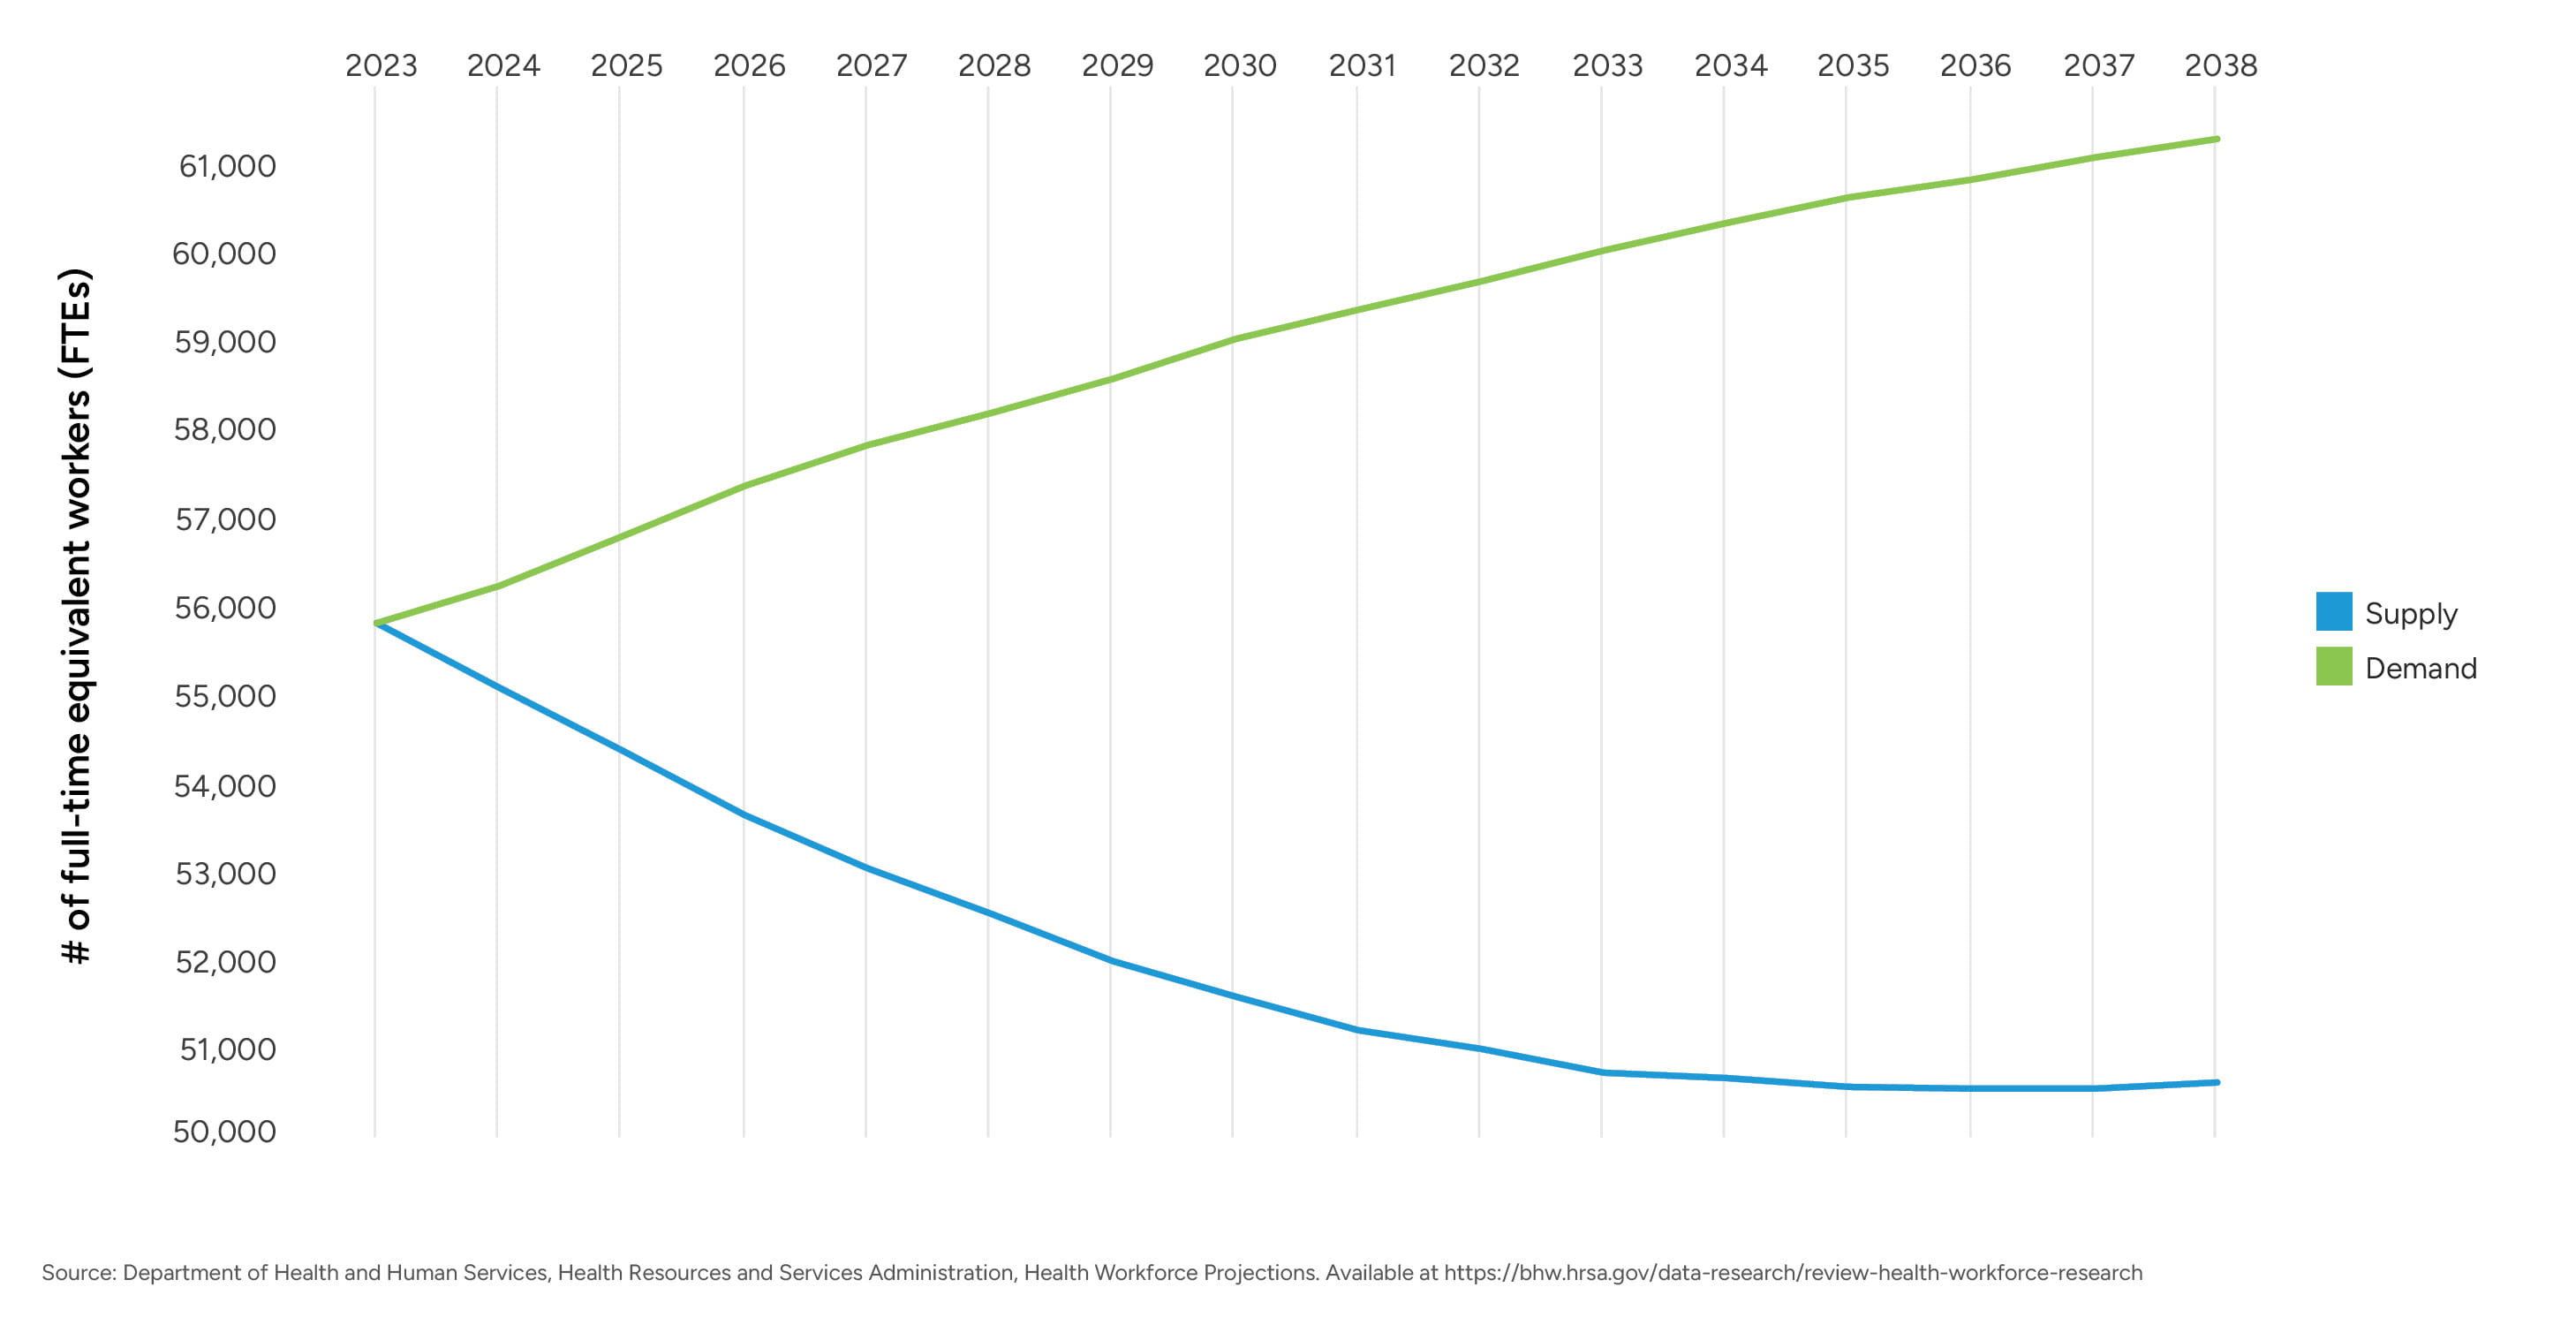
Despite modest increases in anesthesiology residency positions over the past decade, the training pipeline for anesthesiologists remains relatively fixed due to residency slot limitations, with approximately 1,700 anesthesiology residency positions offered annually nationwide.6 At the same time, projected workforce models estimate that approximately 30% of practicing anesthesiologists will exit clinical practice by 2033, equating to roughly 2,000 retirements or departures per year.7 This suggests that annual graduate output is unlikely to offset workforce attrition.
Further compounding these constraints, approximately 57% of active anesthesiologists are age 55 or older, and more than 17% are identified as nearing retirement age, underscoring that anesthesiology workforce shortages are structural rather than cyclical and likely to intensify absent meaningful expansion in training capacity and retention initiatives.8
Employment and Practice Structure Trends
Historically, anesthesiology has been characterized by a mix of independent physician groups, hospital-employed providers, and national anesthesia management companies. However, over the past decade, this distribution has shifted meaningfully toward greater consolidation and employment. National physician practice trend data from the American Medical Association (AMA) demonstrates a sustained decline in physician-owned practices, falling from approximately 60% in 2012 to 42% in 2024, while hospital-owned practices and direct hospital employment increased from approximately 23% to 35% and from 6% to 12%, respectively.9 Specialty data from the AMA further reported that approximately 46% of anesthesiologists practiced in private practice settings in 2024, indicating that anesthesiology has followed the broader national trend toward reduced independent practice and increased alignment with hospital employment models or large multi-state anesthesia management companies.
This consolidation pattern mirrors developments in other hospital-based specialties and carries important implications for hospital contracting and employment structure trends. National anesthesia management companies, many of which are supported by private equity investment, have expanded aggressively, leveraging centralized staffing infrastructure, standardized operational models, and multi-market contracting strategies. As a result, local anesthesia markets increasingly reflect the economics and contract pricing of these large platforms rather than localized independent community-based practices. This shift has reduced hospital negotiating leverage and contributed to rising coverage costs, particularly in markets with acute provider scarcity.
At the same time, the locum tenens market for anesthesiologists and CRNAs has expanded significantly, becoming a material driver of workforce instability. Industry data indicates that approximately 10% of anesthesiologists and 4% of CRNAs now work locums either in addition to their full-time role or exclusively, lured by premium compensation shift rates and increased schedule flexibility.10
Such locums dynamics are reinforced by broader workforce pressures: the average anesthesiologist is 52.6 years old, placing a substantial portion of the workforce near transitional career stages; approximately 50% report experiencing burnout, depression, or both; and 61% of anesthesiologists express a preference for improved work-life balance over higher compensation, contributing to declining interest in call coverage and other high-intensity scheduling demands.11 Collectively, these factors increase turnover, elevate reliance on premium labor, and make long-term staffing stabilization increasingly challenging for hospitals.
The widening differential between permanent compensation rates and locums market rates has also placed upward pressure on contractual anesthesia coverage arrangements. Hospitals must now balance budget constraints against the operational necessity of uninterrupted anesthesia coverage, often paying locums-level premiums to avoid coverage gaps that would otherwise constrain OR capacity and revenue. As a result, consolidation, burnout, lifestyle preferences, and the rapid expansion of the locums market have become central variables in evaluating anesthesia coverage models and determining appropriate levels of hospital financial support.
CRNA Supply and Role Expansion
CRNAs continue to serve as a critical component of anesthesia care delivery models, particularly in community and rural hospital settings and in states permitting independent CRNA practice. As of 2025, the United States had an estimated 67,700 practicing CRNAs, representing one of the largest and most geographically distributed advanced practice provider workforces.12 Despite this sizable workforce, CRNA supply growth has not kept pace with rising demand requirements from hospitals, ASC sites, and anesthesia management organizations.
Figure 2 – CRNA Supply and Demand Projection (HRSA)
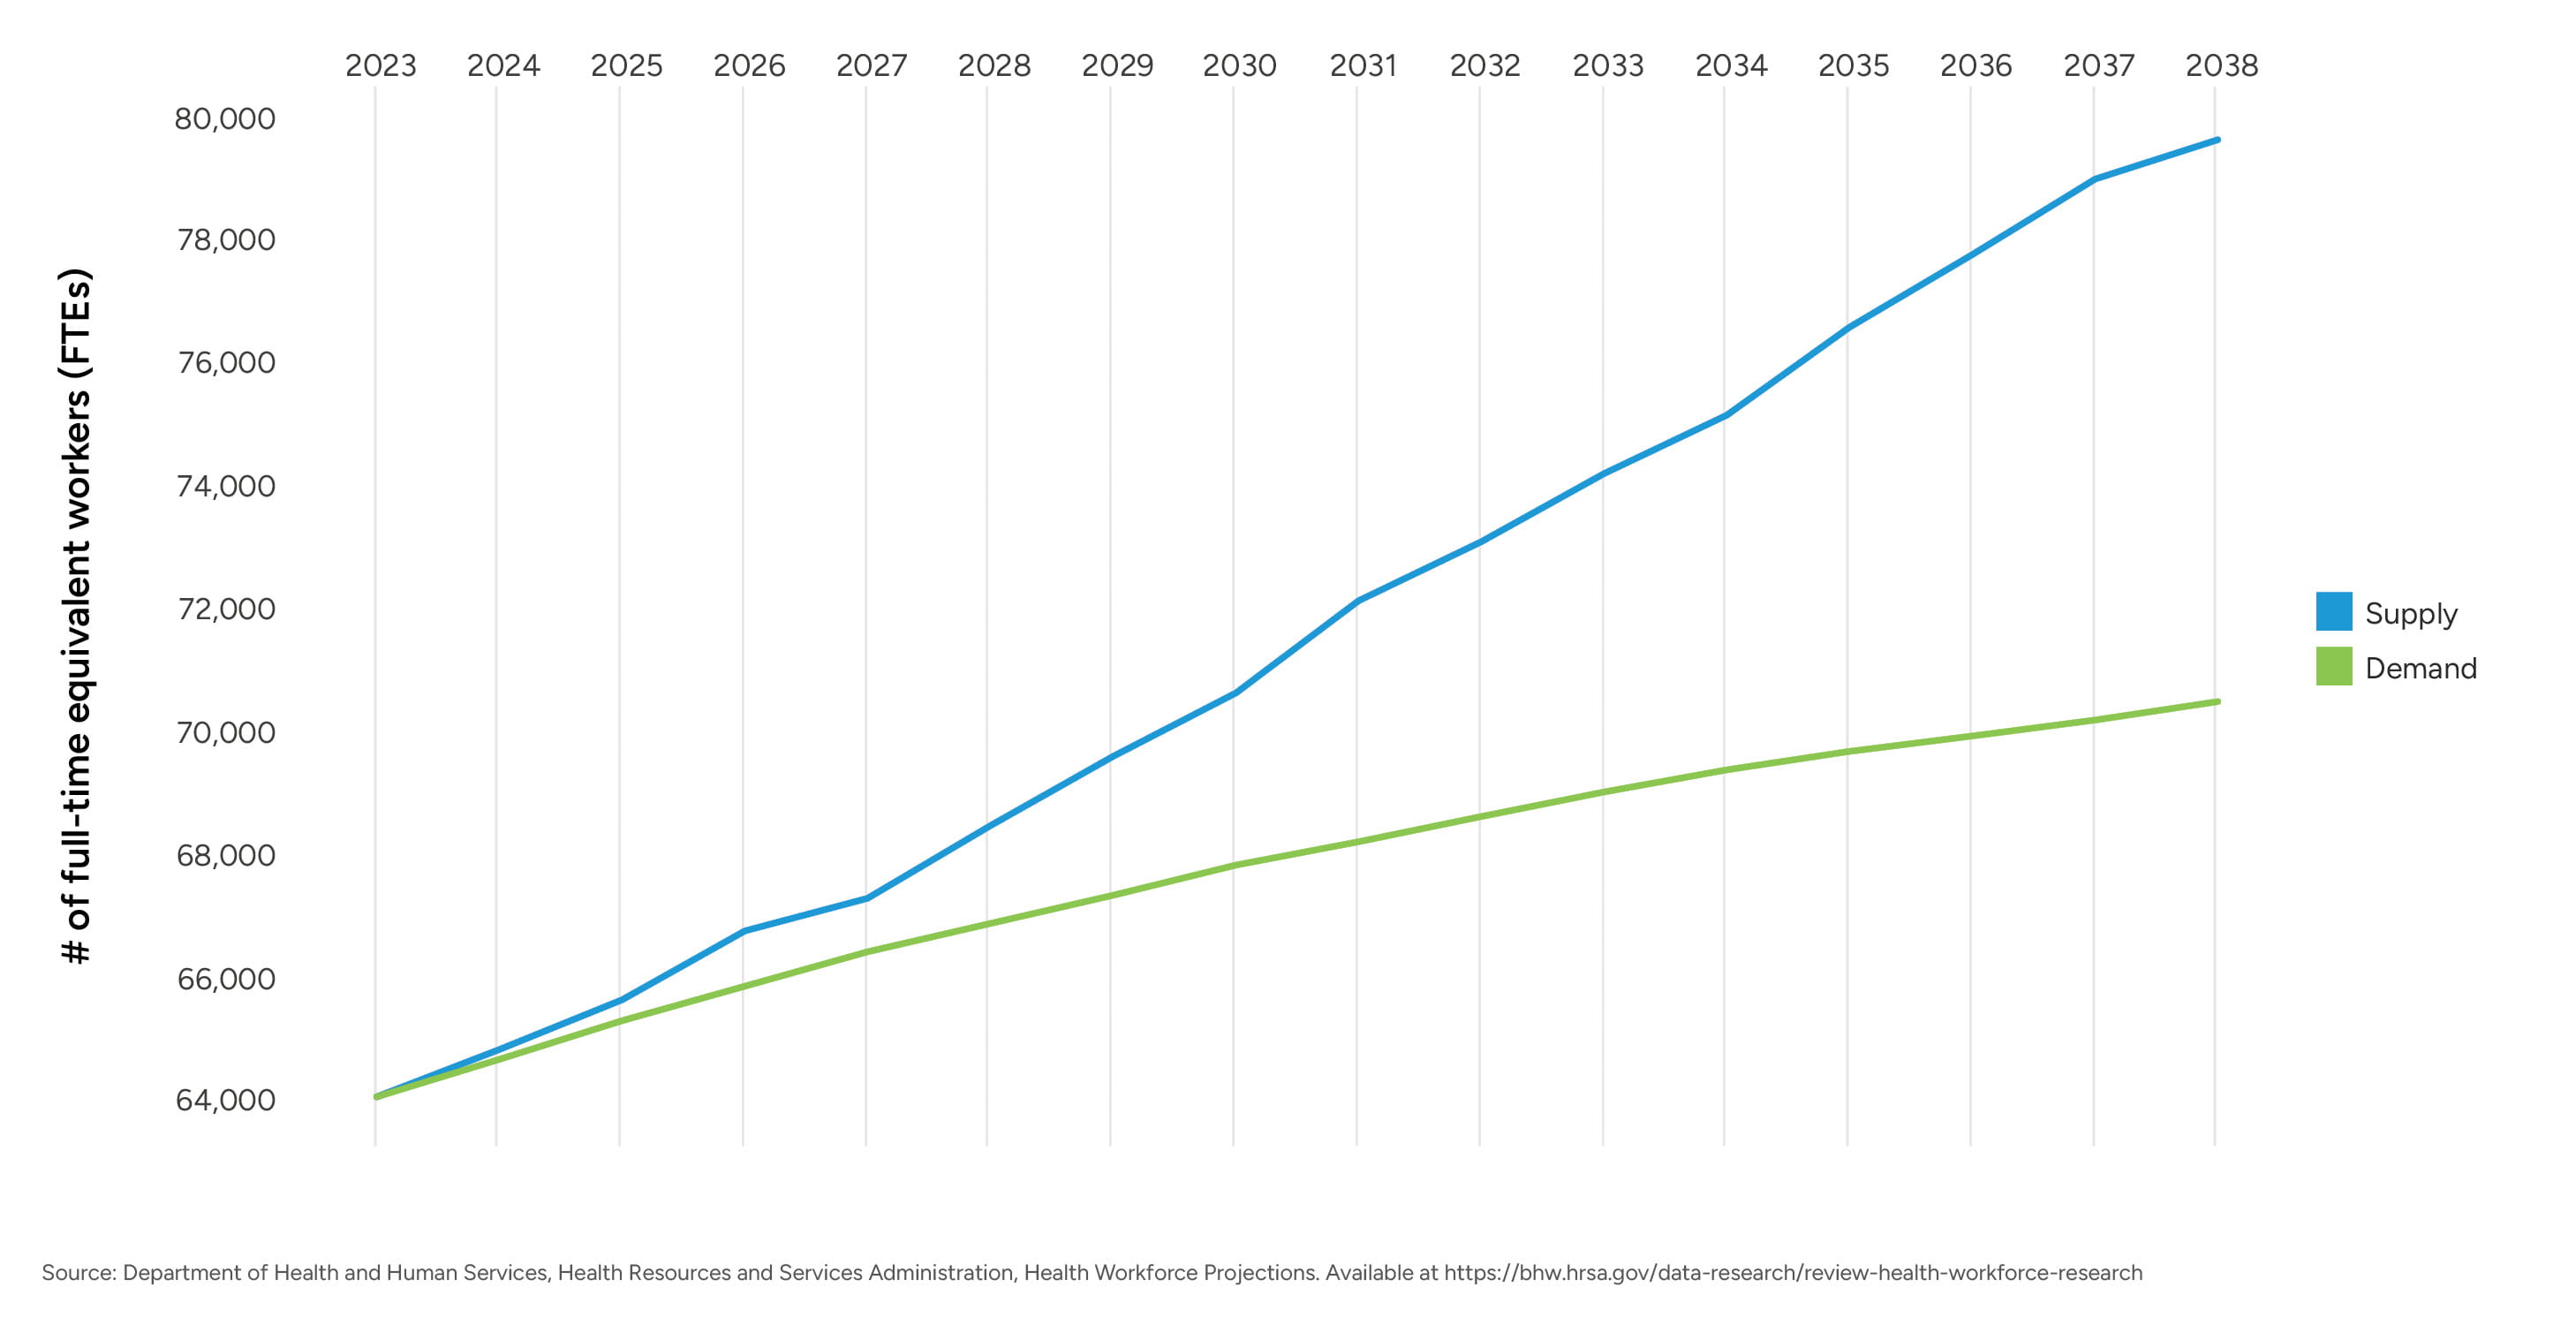
Although HRSA’s supply-and-demand model projects that national CRNA supply will outpace modeled demand through 2038, these projections rely on assumptions that differ meaningfully from real-world anesthesia market conditions. HRSA models assume constant productivity, full geographic distribution, and predominantly full-time schedules, and they do not incorporate the downstream effects of anesthesiologist shortages or the accelerating shift of surgical volume to outpatient settings. As a result, hospitals continue to experience persistent CRNA shortages, particularly in rural markets, independent-practice states, and ASC-heavy regions, evidenced by elevated vacancy rates, rising compensation, and intensified competition for available clinicians.
CRNA educational capacity has expanded over the past decade, driven in part by the 2025 requirement that all new CRNA graduates complete a doctoral-level program.13 The transition to doctoral-level entry increased both training duration and educational costs, which may constrain CRNA provider output in the short-term.
The Council on Accreditation of Nurse Anesthesia Educational Programs (COA) reports over 150 accredited nurse anesthesia programs, collectively graduating approximately 2,400 newly trained CRNAs annually.14,15 However, these new entrants merely offset workforce attrition. AANA workforce projections indicate that 12% of the CRNA workforce will retire by 2027, representing roughly 8,000 total retirements, or approximately 2,700 retirements per year over the 2025-2027 period.16 Additionally, 49.2% of the CRNA workforce is aged 50 or older, further intensifying retirement risk and placing pressure on training programs and hospitals to retain experienced clinicians.17 Although the CRNA workforce is demographically younger than the anesthesiologist workforce, with a larger share of Millennial and late Gen X clinicians, the pace of retirement continues to exert pressure on net workforce growth.
Demand factors further amplify these constraints. Vacancy data reported by the AANA shows elevated CRNA vacancy rates across multiple regions, with rural hospitals disproportionately affected. Intensified competition for CRNAs has led health systems, anesthesia groups, and staffing companies to deploy increasingly aggressive recruitment tactics in the form of high sign-on bonuses, retention bonuses, and premium differential pay. These dynamics contribute to rapid increases in CRNA compensation, particularly in states permitting independent CRNA practice and in markets experiencing simultaneous anesthesiologist shortages.18
As a result, limited net workforce growth, expanding procedural demand, and strong competition for CRNA labor have positioned CRNAs as central to the long-term stability of anesthesia coverage models. These trends have direct implications for workforce reliability and long-term anesthesia service planning for hospitals and health systems.
CRNA Scope of Practice Variability
Since 1966, Medicare has required anesthesia services to be performed either directly by an anesthesiologist, or by a CRNA or a certified anesthesiologist assistant (CAA) under the supervision of a physician. In 2001, a final rule amended the Medicare and Medicaid Anesthesia Conditions of Participation for hospitals, critical access hospitals (CAHs), and ambulatory surgery centers, providing state governors the ability to “opt-out” of such requirement. Figure 3 illustrates those states which have opted out thereby allowing CRNAs to practice independently.19
Figure 3 – States that Opted Out from Federal Supervision Requirement (CRNA Practice Independent from Anesthesiologists)
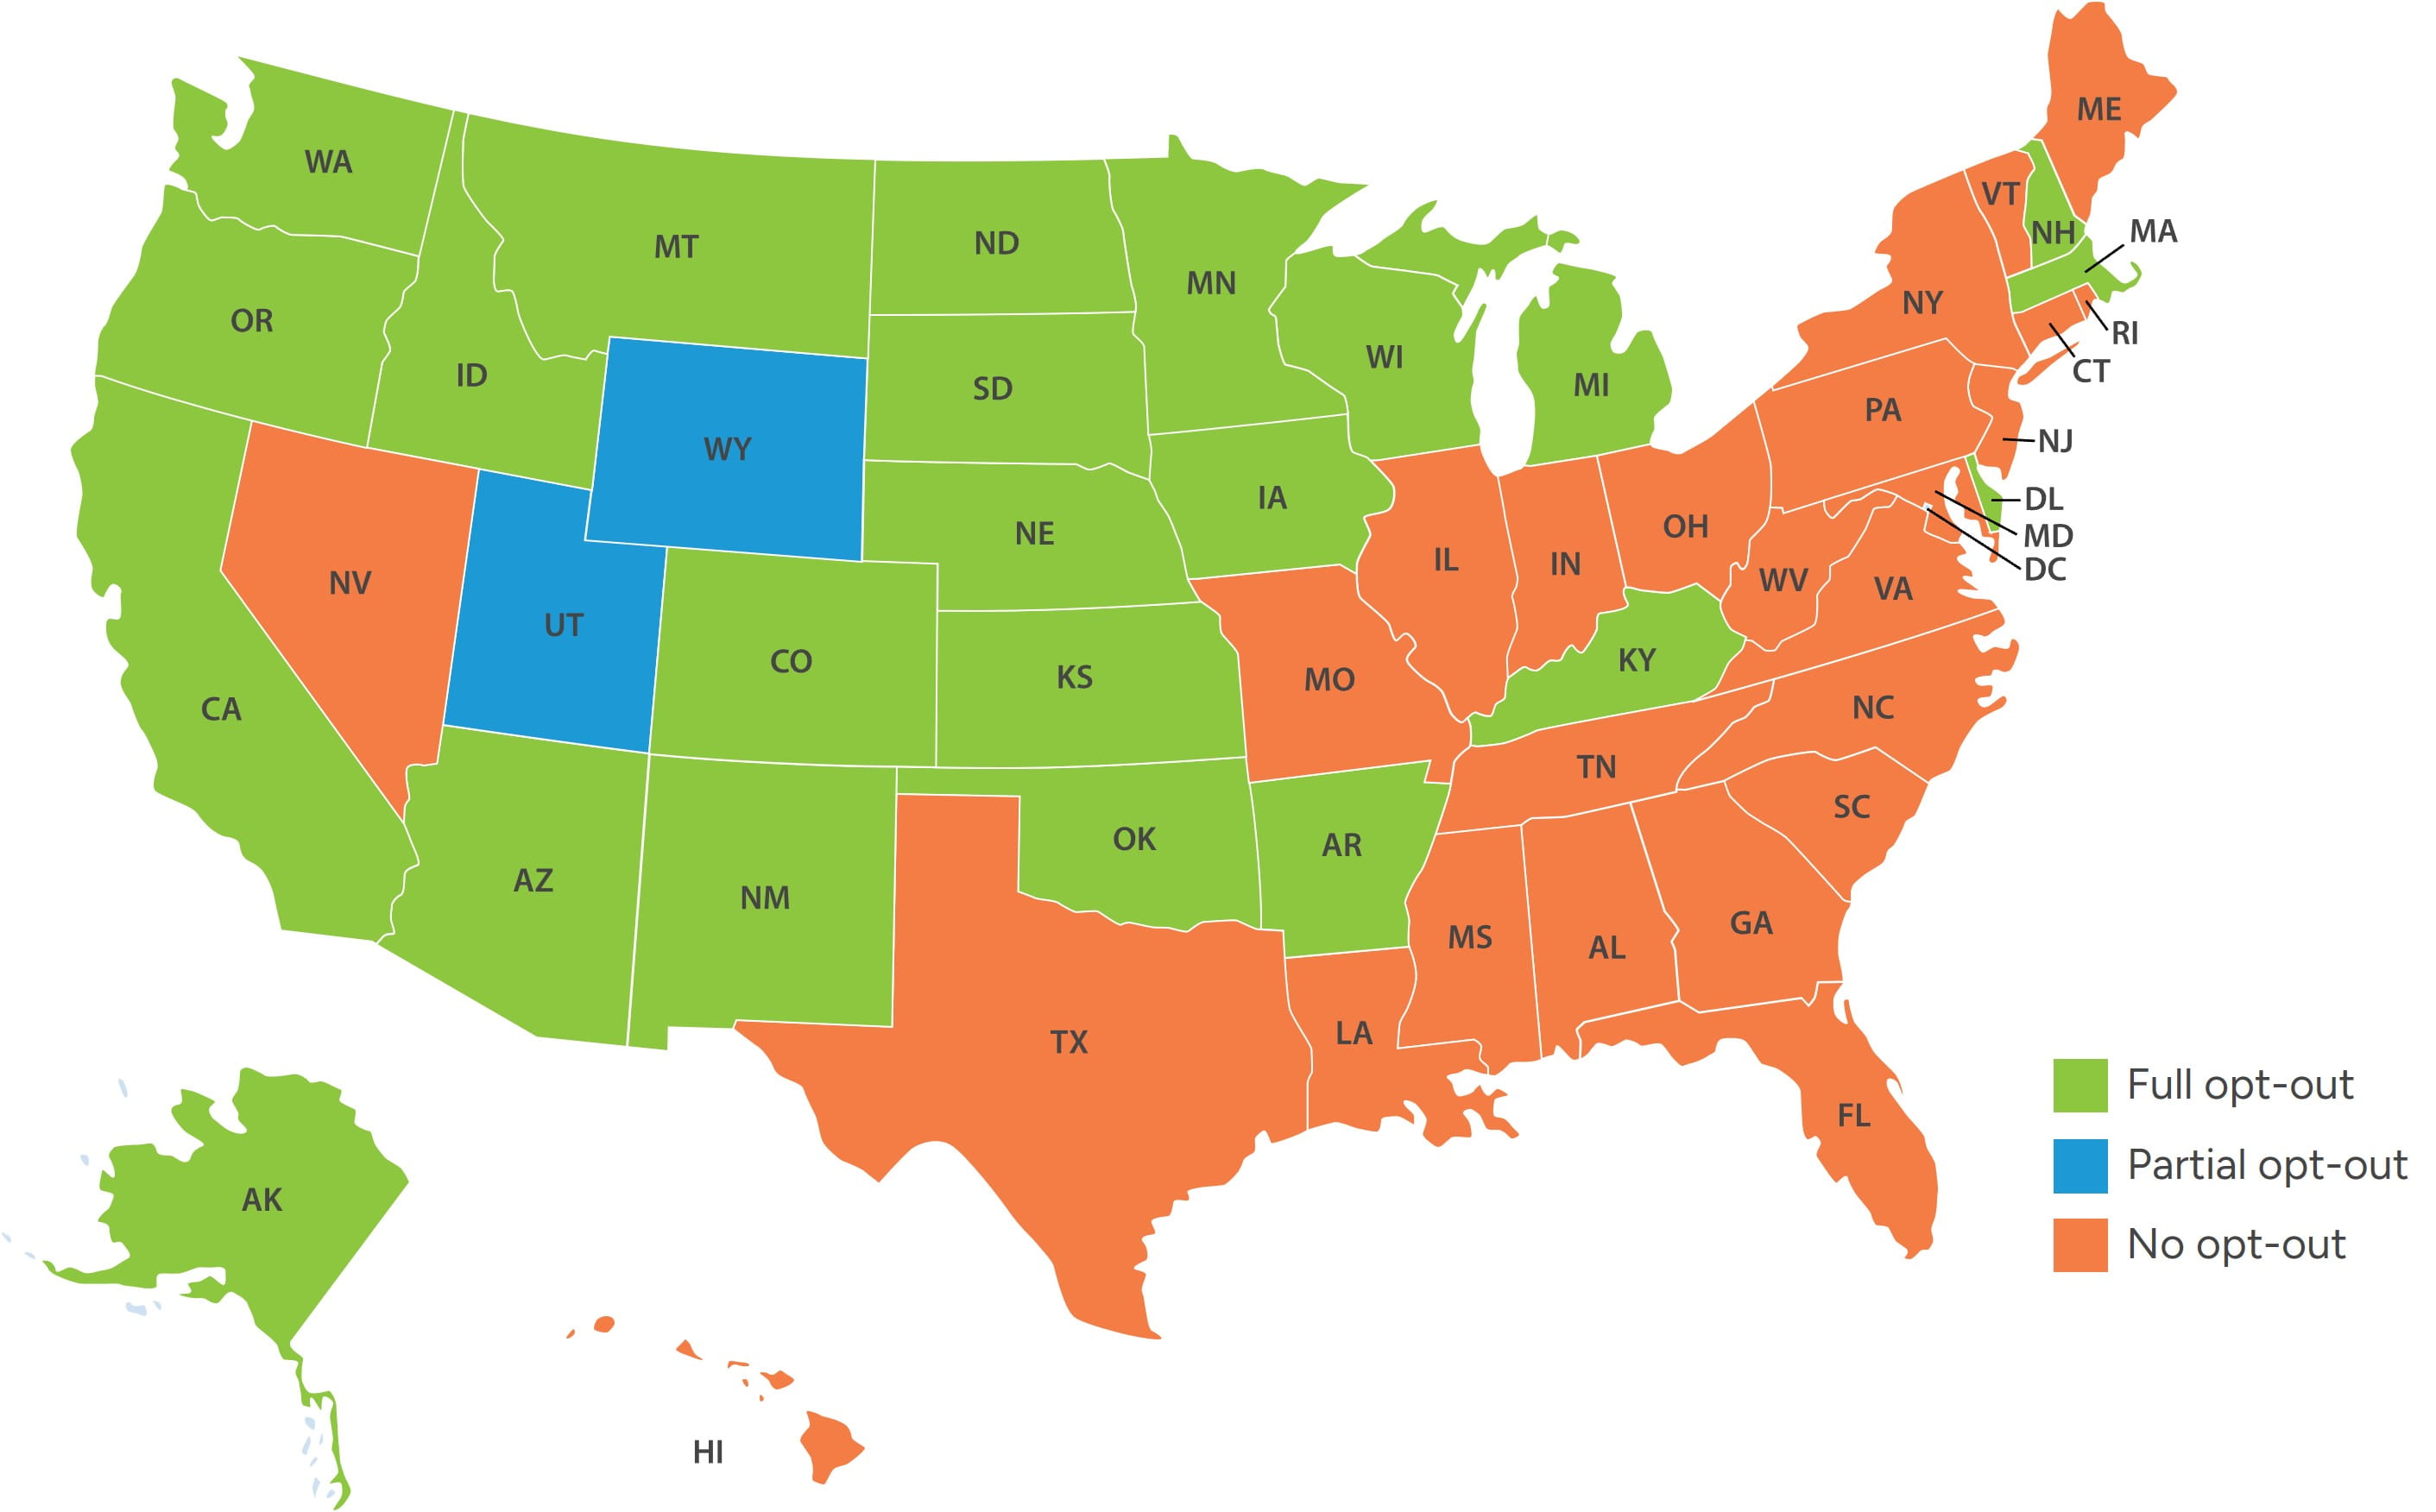
In these states, hospitals may deploy CRNA-only or CRNA-heavy care models, often at lower aggregate staffing costs relative to physician-only or physician-supervised models. Conversely, states maintaining supervision or collaboration requirements limit staffing flexibility and place greater reliance on anesthesiologists, thereby exacerbating provider supply shortages and cost pressures in already constrained markets.
Certified Anesthesia Assistants
The CAA profession was established in the late 1960s by several anesthesiologists to address staffing shortages and increased case complexity. However, CAA adoption was slow to proliferate with approximately 500 active CAAs in 2005. Due to the growing demand of anesthesia services combined with nationwide anesthesiologist and CRNA provider shortages, health systems and provider groups have increasingly turned to utilizing CAAs in states where permitted. As a result, the number of active CAAs has grown considerably in the last decade, doubling from approximately 2,000 CAAs in 2015 to over 4,000 in 2025.20
CAAs obtain a master’s-level education from accredited CAA programs and possess clinical training to assist in all areas of anesthesia, and like CRNAs, are recognized by CMS as qualified non-physician anesthesia providers. Figure 4 summarizes the key educational, training, and practice autonomy differences between CAAs and CRNAs according to the American Academy of Anesthesiologist Assistants (AAAA) and the American Association of Nurse Anesthetists (AANA).
Figure 4 – Training and Educational Differences: CAAs and CRNAs21
|
Area |
CAAs |
CRNAs22 |
|---|---|---|
| National Organization | American Academy of Anesthesiologist Assistants (AAAA) | American Association of Nurse Anesthetists (AANA) |
| Practice Autonomy | Licensed to practice in 22 states (plus DC and Guam) but required to work under the direct, physical supervision of a physician anesthesiologists, as noted in Figure 5 below. | Licensed to practice in all 50 states, with full independent practice authority in over 20 states as noted in Figure 3 above. |
| Number of Active Providers | ~4,40023 | ~69,000 CRNAs in all 50 states (including DC and Puerto Rico) |
| Training Timeline to Practice | ~6-7 years | ~8-9 years |
| Undergraduate Degree | Bachelor's degree with pre-medical course work | Bachelor of Science degree in nursing (BSN) |
| Clinical Experience Requirement | N/A | At least one year of full-time work experience (or its part-time equivalent) as a registered nurse in a critical care setting |
| Program Length | 24-29 months | 36-48 months |
| Clinical Education | Minimum of 2000 clinical hours (average > 2500) | Minimum of 600 cases (average ~2000+ hours – including Master’s or DNAP trained) |
| Clinical Rotations | All subspecialties of anesthesia | All subspecialties of anesthesia |
| Recertification | 50 CMEs submitted biennially and sit for Continued Demonstration of Qualifications Exam (CDQ) after initial 4 years and every 10 years thereafter | Eight-year two-part recertification process began August 2016: First four years: Submission of 40 CMEs. Second four years: Inclusion of recertification exam (first exam to commence in 2024 with no pass/fail. First pass/fail exam to administered in 2032). |
| Accredited Programs | 23 | 152 |
| Program Accreditation | Commission for Accreditation of Allied Health Education Programs (CAAHEP) Accreditation Review, and Committee for Anesthesiologist Assistants (ARC-AA) | Council on Accreditation of Nurse Anesthesia Programs |
| Certifying Body | National Commission for Certification of Anesthesiologist Assistants in collaboration with National Board of Medical Examiners | Council on Certification of Nurse Anesthetists |
One of the primary differences between CRNAs and CAAs noted in the previous table is that CAAs must practice as part of the physician-led Anesthesia Care Team (ACT) model, whereas CRNAs may practice independently from an anesthesiologist in the opt-out states noted in Figure 3. CAAs are granted state-license authority to practice in those states illustrated in Figure 5, and in Kansas, Michigan, Pennsylvania, and Texas, CAAs are permitted to practice under the delegatory authority of the physician.
Figure 5 – States Permitting CAA Practice Authority
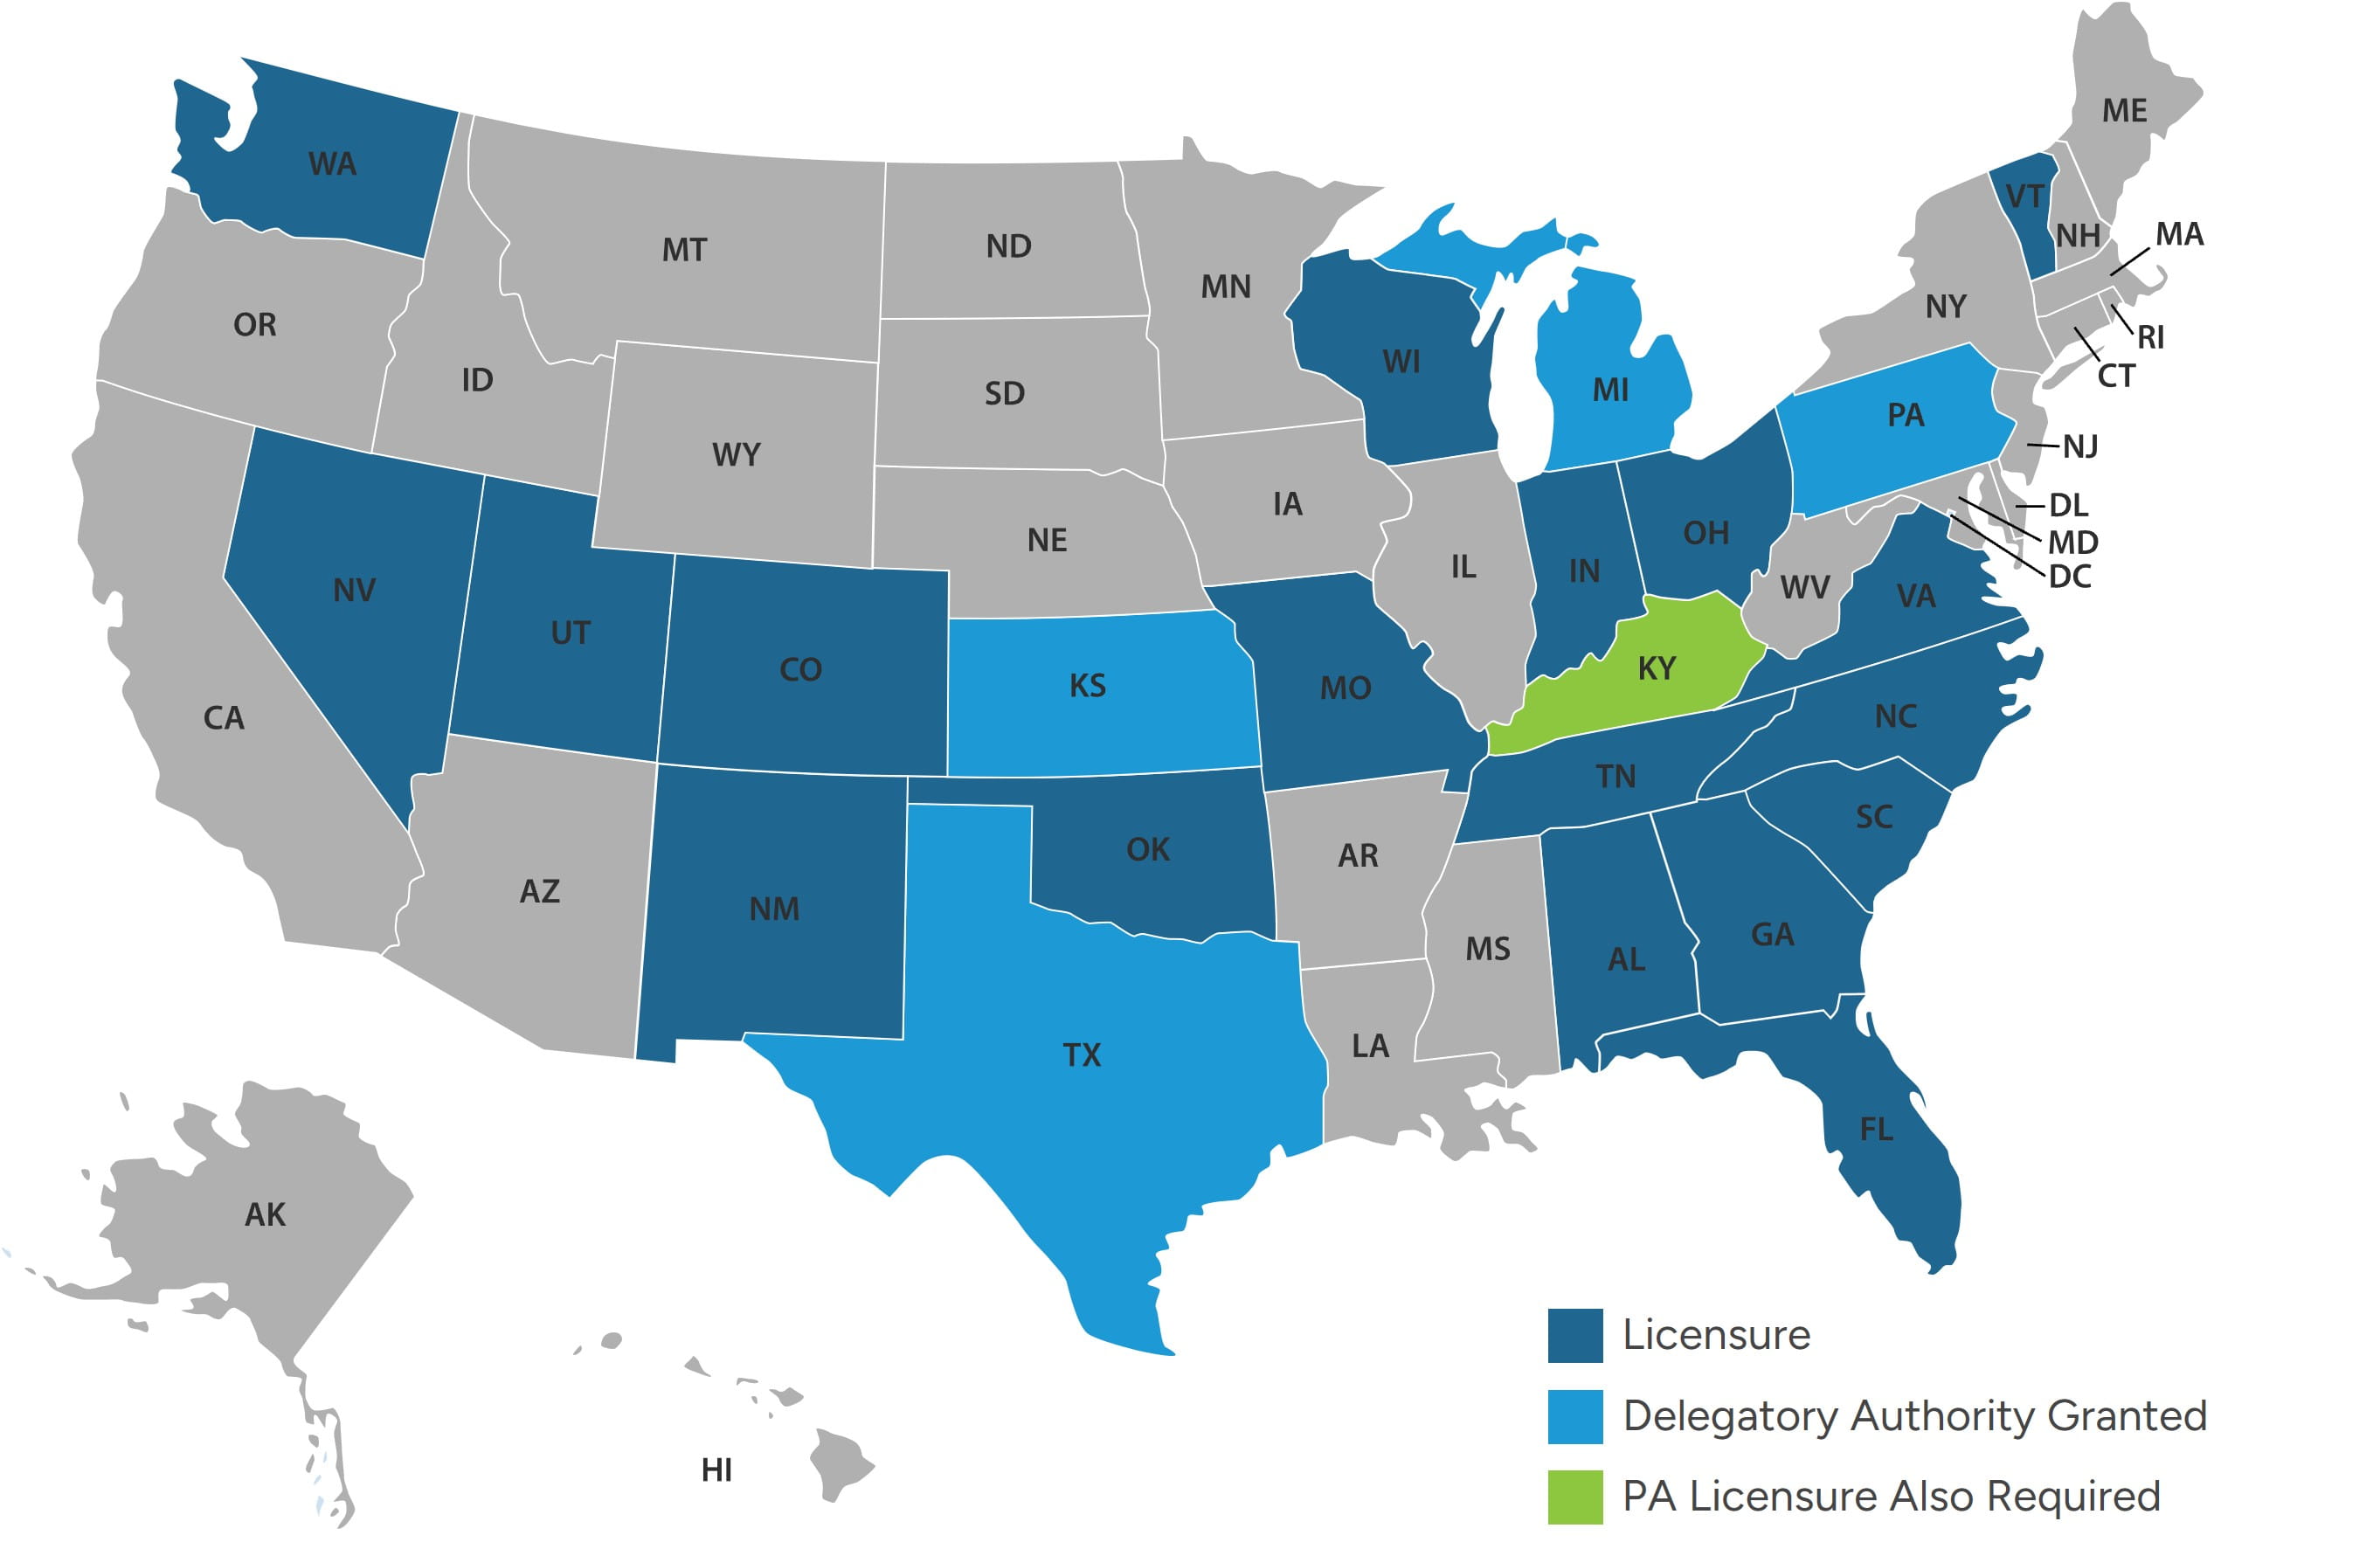
Due to systemic provider shortages, increased adoption of CAAs can be expected in permitted states, and legislative measures may be enacted in non-permitted states to enable CAAs to practice under the ACT care model in attempts to alleviate provider shortages.
Reimbursement Trends
2026 CMS Medicare Physician Fee Schedule (MPFS) Final Rule
Anesthesia services are reimbursed by Medicare via a methodology that differs from other physician specialties. For instance, Medicare establishes reimbursement for anesthesia based on base units established by CMS for each anesthesia HCPCS code, and time units, which are calculated based on the number of minutes the anesthesia practitioner is present with the patient and ends when such patient is safely placed under postoperative care, divided by 15-minute increments.24 The base units and calculated time units are added and multiplied by the locality-specific Medicare anesthesia conversion factor, as illustrated in Figure 6.
Figure 6 – Illustrative Medicare Reimbursement (CPT/ASA Code: 0140225)
|
Description |
Medicare Reimbursement |
Formula |
|---|---|---|
| Base Units | 7 | A |
| Start Time | 0700 | B |
| End Time | 0909 | C |
| Total Minutes | 129 | D = C - B |
| Time Units | 8.6 | E = D / 15 |
| Total Units | 15.6 | F = A + E |
| Anesthesia Conversion Factor (National - QAPM) | $20.3178 | G |
| Medicare Reimbursement | $316.96 | H = F x G |
Medicare, unlike certain commercial payors, does not permit “modifier units” accounting for factors such as patient health, risk, age, or unusual circumstances. Furthermore, certain commercial payors may require calculated time units to be reported to the nearest whole number whereas Medicare requires time units to be calculated to one decimal.
As of January 1, 2026, Medicare established two alternative anesthesia conversion factors, depending on whether providers participate in an Advanced Alternative Payment Model (APM), as shown in Figure 7.
Figure 7 – CY 2026 National Medicare Anesthesia Conversion Factors (CF)26
|
Description |
2025 Anesthesia CF |
2026 Anesthesia CF |
$ - Variance |
% - Variance |
|---|---|---|---|---|
| Qualified APM Participants | $20.3178 | $20.5998 | + $0.2820 | + 1.39% |
| Non-Qualified APM Participants | $20.3178 | $20.4976 | + $0.1798 | + 0.88% |
Although the Medicare anesthesia CF increased by 0.88% to 1.39%, such increase is significantly below Medicare’s 2026 increases to the RBRVs27 conversion factor applicable for non-anesthesia specialties, which increased by 3.26% for non-APM participants and 3.77% for APM participants. This is due to CMS applying a 2.3% reduction to the anesthesia practice expense and malpractice adjustment factor in establishing the 2026 anesthesia CF.28 Furthermore, the anesthesia base units have largely remained unchanged since 2022. Accordingly, the CMS 2026 Final Rule provides negligible Medicare reimbursement increases for anesthesia providers.
Profitability Impacts Based on Care Delivery Models
Medicare reimbursement for anesthesia services provided by CRNAs is not adjusted by an 85% payment factor, as is applicable for non-anesthesia advanced practice providers. For example, Medicare reimbursement is equal whether the service was personally performed by a CRNA or by an anesthesiologist. However, in care delivery models where an anesthesiologist provides medical supervision (less than four concurrent cases) or medical direction (up to four concurrent cases), Medicare reimbursement applies a 50% payment adjustment, as shown in Figure 8.
Figure 8 – Care Delivery and Medicare Reimbursement
|
Billing Category |
Physician Allowed Amount |
CRNA Allowed Amount |
CAA Allowed Amount |
Billing Modifier |
|---|---|---|---|---|
| Anesthesiologist Personally Performed | 100% | N/A | AA | |
| CRNA Personally Performed | N/A | 100% | N/A | QZ |
|
Anesthesiologist Medical Direction (Up to 4 concurrent cases) |
50% | 50% | QX, QY, QK | |
|
Anesthesiologist Medical Supervision (> 4 concurrent cases) |
3 Units (+1 unit for induction) | 50% | N/A | AD |
Although a care delivery model involving anesthesiologist medical direction yields equivalent aggregate Medicare reimbursement (e.g., equal to reimbursement if performed by CRNAs with no medical direction), provider staffing costs are greater due to the anesthesiologist’s medical direction which reduces per case profitability. Further, care delivery models involving anesthesiologist medical supervision results in lower aggregate Medicare reimbursement than if such cases were performed solely by CRNAs without medical direction. CAAs may only practice under medical direction in applicable states, which can impact the optimal staffing model as operators seek to maximize reimbursement.
Payor-Mix Demographic Shifts
In 2025, the 65-and-older demographic was approximately 62.7 million and is projected to increase by over 14%, to 71.6 million in 2030, representing over 20% of the U.S. population.29 The 65-and-older demographic has notably higher utilization of healthcare services compared to younger demographics. Since Medicare eligibility begins at age 65, the anticipated demographic shift of commercially insured patients transitioning to Medicare is expected to significantly impact overall reimbursement for anesthesia providers.
Commercial Reimbursement
In recent years, commercial reimbursement for anesthesia professional services has shown concerning downward trends, a development that threatens a critical revenue source for anesthesia providers. The No Surprises Act, effective January 1, 2022, prohibits balance billing — the difference between a provider’s charges and the insurer’s payment — when anesthesia services are furnished by out-of-network providers at in-network facilities. Importantly, the No Surprises Act requires that the consumer’s cost-sharing requirement for out-of-network services cannot be greater than the requirement that would apply if the services were provided in-network (i.e., the patient’s costs for such out-of-network service would be determined using in-network copay amounts or coinsurance percentages).
As a result, in applicable situations, commercial insurers instead reimburse near the Qualifying Payment Amount (QPA), which is defined generally as the median of contracted rates for a given service in the same geographic region within the same insurance market (i.e., nongroup, fully-insured large group, fully-insured small group, or self-insured group) across all of an issuer’s health plans as of January 31, 2019, inflated forward in perpetuity by the Bureau of Labor Statistics’ (BLS) Consumer Price Index for All Urban Consumers (CPI-U). Provider groups unsuccessful in negotiating payment disputes with insurers after a 30-business day open negotiation period can initiate the federal Independent Dispute Resolution (IDR) process, where an independent arbiter selected randomly by HHS and CMS determines either the provider’s offer or the plan’s offer in full, with no splitting the difference. The party whose offer is not selected by the IDR entity is then responsible for paying the IDR fees, which for 2026 range up to $800 for single determinations and up to $1,150 for batched determinations.30
This change in commercial reimbursement for services provided to out-of-network patients has particularly impacted the business model of many private equity (PE) backed anesthesia groups, whose strategy relies on acquiring market share in key geographic areas. For instance, Envision Healthcare, a national PE-backed hospital-based staffing company, filed for Chapter 11 bankruptcy on May 15, 2023, with one contributing factor being Envision’s overreliance on an aggressive out-of-network pricing strategy. In the same year, American Physician Partners, another PE-backed hospital-based staffing company, filed for bankruptcy for similar reasons.
In addition, commercial insurers have been reevaluating overall reimbursement for anesthesia services. For example, in the fall of 2025 UnitedHealthcare implemented a 15% reduction in reimbursement for cases personally performed by CRNAs (QZ modifier) in select states and eliminated special modifying units for high-risk patients as well as other payment escalators previously attributable to emergency cases and patient age. Furthermore, commercial insurers have increased claims scrutiny, often with the use of advanced artificial intelligence software, resulting in increased denials and associated revenue loss for providers.
Such legislative changes enacted to protect patients’ financial interests have not only eroded commercial reimbursement that anesthesia providers depend on for financial viability but have also heightened both the billing complexity and administrative burden from the IDR process.
Compensation Trends
Over the last several years, anesthesiologist and CRNA staffing costs have significantly increased, and such cost increases are often absorbed by health systems either through their direct employment of such providers or through increased financial support payments to staffing companies. The following Figures 9 and 10 demonstrate national weighted average total compensation reported by national survey data sources at the median and 90th percentiles for anesthesiologists and CRNAs.
Figure 9 - National Weighted Average Total Compensation for Anesthesiologists
|
Survey Year |
Median |
YOY % Change |
90th Percentile |
YOY % Change |
|---|---|---|---|---|
| 2025 | $551,000 | 7.6% | $748,000 | 7.8% |
| 2024 | $512,000 | 4.7% | $694,000 | 5.3% |
| 2023 | $489,000 | 8.4% | $659,000 | 2.8% |
| 2022 | $451,000 | 1.6% | $641,000 | 6.5% |
| 2021 | $444,000 | -5.5% | $602,000 | -5.3% |
| 2020 | $470,000 | Base Year | $636,000 | Base Year |
Figure 10 – National Weighted Average Total Compensation for CRNAs
|
Survey Year |
Median |
YOY % Change |
90th Percentile |
YOY % Change |
|---|---|---|---|---|
| 2025 | $259,000 | 9.7% | $341,000 | 13.3% |
| 2024 | $236,000 | 7.3% | $301,000 | 4.9% |
| 2023 | $220,000 | 8.4% | $287,000 | 13.0% |
| 2022 | $203,000 | 3.0% | $254,000 | 8.1% |
| 2021 | $197,000 | -0.5% | $235,000 | -1.3% |
| 2020 | $198,000 | Base Year | $238,000 | Base Year |
Stout notes that the survey data year is based on data from the prior year (e.g., 2025 Survey Year is based on calendar year 2024 data). In the past five years, median total compensation for anesthesiologists increased at a compound annual growth rate of 3.2%, whereas total compensation for CRNAs exceeded this with a compound annual growth rate of 5.5%. Additionally, for the two most recent survey years, CRNA total compensation increased year over year by 7.3% and 9.7% at the median.
Without meaningful changes in reimbursement, health systems have footed the bill by increasing compensation levels to retain providers or indirectly via increased financial support payments to staffing companies.
While compensation increases have been significant, there are other factors leading to higher staffing costs. Increasingly, anesthesiologists and CRNAs are requesting employment arrangements with attractive paid time off allowances or shift requirements that require fewer work hours than a typical full-time equivalent, resulting in higher staffing costs on a per shift basis.
Largest National Anesthesia Staffing Companies
Health systems frequently contract with large anesthesiology providers to secure one of the most vital specialties enabling hospital and ASC operations. Figure 11 summarizes several of the largest national anesthesiology staffing companies in the U.S.
Figure 11 – National Anesthesiology Staffing Companies
|
Name |
Number of Anesthesiologists |
Total Providers (Incl CRNAs) |
Corporate Office (City, State) |
Ownership Structure Note |
|---|---|---|---|---|
| 1. Envision Healthcare | 5,800 | ~25,00031 | Nashville, TN | PE backed for-profit |
| 2. U.S. Anesthesia Partners (USAP) | 2,800 | >5,000 | Dallas, TX | PE backed for-profit, partially physician-owned |
| 3. North American Partners in Anesthesia (NAPA) | 1,000 | ~5,000 | Melville, NY | PE backed for-profit |
| 4. NorthStar Anesthesia | 600 | ~4,000 | Irving, TX | PE backed for-profit |
| 5. Sound Physicians (Sound Anesthesia) | Unknown | Unknown | Tacoma, WA | PE backed for-profit |
Unsurprisingly, the largest anesthesiology staffing companies are all PE-backed and have generally adopted a strategy of expanding market share strategically in key states or markets to increase negotiating leverage with both payors and hospitals.
Private Equity Investment
PE investment has played a prominent role in reshaping the anesthesiology landscape. A 2023 peer-reviewed study published in Health Affairs Scholar referenced Medicare Fee-For-Service claims linked to a novel ownership dataset to estimate that PE or publicly traded-owned groups accounted for 18.8% of the national anesthesia market in 2019, up from 3.2% in 2009.32 Such study also observed higher concentrations by location, with over 40% of the anesthesia market controlled by PE and publicly traded companies in Florida, Texas, Nevada, and Washington, DC. in 2019. Additionally, within certain states, PE-backed anesthesiology market share was found to be dominated by single entities.
In 2019, U.S. Anesthesia Partners (USAP) controlled 30% of the Nevada and Colorado markets, and 36% of the Texas market. The large PE firm Kohlberg, Kravis, Roberts, which took Envision private in 2018, controlled 23% of the Arizona market, 27% of the Florida market, and 19% of the New Jersey market at the end of our study period.
Other studies conducted in 2020 and 2022 confirm similar trends with respect to PE investment in anesthesiology as well as notable financial impacts. From 2013–2016, anesthesiology accounted for about one-fifth of PE physician-practice acquisitions and roughly one-third of physicians within acquired practices, and from 2012–2017, contracting with a PE-backed anesthesia management company was associated with ~26% higher commercial allowed amounts for anesthesia services.33,34 Importantly, the Zhu et al study was based on publicly announced transactions which likely undercounts the overall magnitude of PE-backed anesthesiology practice consolidation associated with smaller, non-public deals.
Notably, although these studies were published recently, their underlying data is pre-2020, and anesthesia-specific, peer-reviewed analyses that quantify PE investment using post-2020 claims or transaction data remain limited. As a result, post-2020 consolidation in anesthesiology is more commonly evaluated using broader physician-ownership surveys and market or regulatory signals rather than national anesthesia datasets. Based on Stout’s market experience, anesthesiology continues to be an active area for PE-driven consolidation.
The original investment thesis for anesthesia rested on several structural features: high and relatively predictable procedural volume, historically strong margins, and a fragmented physician group landscape amenable to roll-up strategies in which multiple smaller groups are consolidated under a single platform to gain scale and negotiation leverage.35 However, recent market dynamics have placed increasing pressure on this model. Escalating labor costs for anesthesiologists and CRNAs, heightened competition for scarce providers, and reimbursement headwinds, including out-of-network billing constraints following the federal No Surprises Act, have compressed operating margins across many anesthesia platforms.36 The 2023 Chapter 11 bankruptcy of Envision Healthcare, a large PE-backed physician staffing company with significant anesthesia operations, has often been cited as an example of how high leverage, dependence on aggressive billing tactics, and rising labor costs may undermine the sustainability of PE-backed entities.37
As margins have tightened, many PE-backed anesthesia groups have become more reliant on hospital financial support through coverage guarantees, subsidies, or hybrid payment structures to maintain contractual coverage obligations and achieve targeted margins. From a valuation perspective, this evolution warrants heightened scrutiny when subsidy levels or support payments significantly exceed what would be required to secure comparable coverage in a competitive, less concentrated market. Valuation professionals must distinguish between support driven by genuine coverage requirements and local labor conditions and support that primarily reflects contract leverage or financial structures unique to a particular PE platform.
In a more recent development, regulators have increased scrutiny of PE-backed anesthesia consolidation, as evidenced by the following examples:
- In 2023 the Federal Trade Commission (FTC) sued U.S. Anesthesia Partners (USAP) and its private equity sponsor, Welsh, Carson, Anderson & Stowe, alleging a multiyear anticompetitive roll-up strategy to consolidate anesthesiology practices in Texas to force price increases.38
- In early 2024, the Colorado Attorney General separately resolved allegations that USAP’s conduct in that state was anticompetitive, enabling several Colorado hospitals to terminate long-term contracts with the group.39
- In 2025, Welsh Carson reached a settlement with the FTC that imposes ongoing limits on its involvement with USAP and requires advance notice of specified future acquisitions in anesthesia and other hospital-based specialties, signaling a more cautious regulatory environment for large anesthesia roll-up strategies.
These developments align with broader federal and state initiatives to scrutinize PE ownership and corporate consolidation among provider groups.
Parallel to regulatory actions, some hospitals have begun reassessing their relationships with large, PE-backed anesthesia groups. Reports in 2024 described multiple health systems severing longstanding contracts with national anesthesia firms, sometimes building in-house departments and sometimes shifting to alternative groups, citing concerns about costs, staffing reliability, and alleged anticompetitive practices.40 While PE investment in anesthesiology is likely to persist, future activity appears increasingly conditioned on market selection, labor availability, regulatory risk, and the ability to forge sustainable, partnership-oriented arrangements with hospitals rather than relying solely on scale and contract leverage.
Hospital-Anesthesiology Provider Staffing Agreements
Historically, hospitals have provided financial support payments to independent anesthesiology providers through the following two contractual mechanisms:
- Subsidy: This is a fixed annual subsidy payment, intended to cover the shortfall between a staffing company’s budgeted cost and projected professional revenue, paid in monthly installments. In this model, a staffing company incurs risk relative to unexpected staffing cost increases as well as achieving the anticipated level of professional revenue.
- Income Guarantee: This is a financial payment calculated based on a staffing company’s mutually agreed upon fixed annual cost less actual professional revenue. A monthly “draw” payment is typically made to the staffing company with quarterly or annual reconciliation based on actual professional revenue relative to the fixed cost amount. In this model, a staffing company bears risk should staffing costs increase, but experiences limited risk should actual collected revenue fall below anticipated levels.
In recent years, the financial commitment in hospital-anesthesiology provider staffing agreements has significantly escalated, as nearly all hospital operators will attest. Due to the negative reimbursement trends along with provider shortages, staffing companies have been successful in commanding higher financial support payments from hospitals.
However, the rising magnitude of the financial commitment is not the only factor troubling hospital administrators. Contractual arrangement terms have become substantially more intricate, as groups seek to offload virtually all risk, not only from a top line revenue standpoint but also from the operating expense side of the income statement. Figure 12 summarizes key examples of these heightened contractual complexities.
Figure 12 – Increased Hospital-Anesthesiology Contractual Complexities
|
Income Statement Risk-Focus |
Contractual Mechanism |
Description |
|---|---|---|
| Revenue | Case Volume or ASA Unit Adjustments |
Contractual term requiring hospitals to provide additional remuneration if case volume or ASA units fall below an agreed upon quarterly or annual threshold. For example, the parties mutually agree to an expected 50,000 annual ASA units, but if actual annual ASA units fall below this level, the hospital provides an additional support payment intended to cover the decline in revenue due to lower-than-expected volumes. |
| Revenue | Annual Revenue Threshold |
Requires hospitals to provide additional remuneration should a group’s actual revenue fall below an agreed upon quarterly or annual revenue target. For example, the parties mutually agree to an expected $5,000,000 in annual professional collections, but if actual revenue falls below this level, the hospital provides an additional support payment to cover the revenue decline. |
| Revenue | Minimum Staffing Guarantee | Requires hospitals to compensate the group when actual staffing costs resulting from the agreed-upon coverage schedule (e.g., “8 rooms + OB 24/7”) exceeds the revenue that such staffing can generate under applicable payor mix conditions. |
| Revenue | Payments for Unfunded / Self-Pay Payor Classes |
This contractual mechanism targets low-funded payor categories, such as self-pay or Medicaid. Arrangement terms may require hospitals to provide additional support payments based on one of the following for anesthesia services rendered to financially disadvantaged payor classes:
|
| Revenue | Changes in Financial Payor Mix | While this contractual mechanism generally does not directly result in an additional support payment to a group, it may provide groups with the option to renegotiate increased financial assistance due to unfavorable shifts in financial payor categories. |
| Revenue | Transition / Ramp-up Guarantee | During program expansion or ramp-up, hospitals guarantee a revenue floor for a short-term period (e.g., 6–18 months) until surgical volumes stabilize. Common when hospitals are building new ORs and ASCs, the addition of new service lines, or after replacing a prior anesthesia vendor. |
| Operating Expense / Profit Margin | Actual Costs Plus |
Such mechanism provides remuneration to a group based on the difference between their actual total cost of the coverage services and actual total professional revenue, resulting in an unpredictable financial support commitment from a hospital’s perspective. For example, if in Year 1 a group’s total actual cost equals $20M with actual revenue of $12M, the hospital would compensate the group $8M. In Year 2, if a group’s total actual cost is $24M but revenue remains relatively static at $8M, the hospital would provide financial support to the group of $16M. Additionally, in certain cases the group’s actual costs may be adjusted to provide group with a guaranteed profit margin or return (e.g., actual costs plus a margin markup of 5%). |
| Operating Expense | Locum Tenens Expenses | As groups struggle to recruit and retain providers, they often turn to third-party party locums providers to meet contractual coverage obligations. As the cost of locums is significantly higher than permanent staff, groups seek additional reimbursement to cover pricier locums staffing either through passthrough reimbursement of actual locums costs or additional fixed per locum-shift payments. |
| Operating Expense | Annual CPI Adjustments | Establishes year-over-year subsidy payment increases based on a set percentage or a percentage tied to a then-current CPI index. |
| Operating Expense | Provider Recruitment Cost Payments | During the agreement’s ramp-up phase, groups often need to recruit additional providers, passing associated recruitment and relocation costs to the hospital either based on actual expenses or a fixed per-recruited provider payment. |
| Operating Expense | Benefits Pass-Through | Requires the hospital to pay differences arising from increases in health insurance, malpractice premiums, retirement contributions, or disability insurance. Common in PE-backed groups with rising benefit expense. |
| Operating Expense | Shift Premium Differentials | Higher contractual reimbursement for staffing nights, weekends, or holidays, often tied to a formula (e.g., 1.5x or fixed hourly differential). Often observed in high-call-burden markets. |
| Operating Expense | Technology / EMR Integration Cost Reimbursement | Hospitals pay or provide reimbursement for the cost of system integration, billing system changes, and anesthesia information management systems. |
| Hybrid | Productivity Adjustment | Provides upside/downside adjustments based on surgical throughput or operating room efficiency metrics (turnover times, on-time starts). Designed to align anesthesia incentives with OR performance. |
| Hybrid | Quality Performance Payments | Additional payments tied to quality benchmarks or outcomes (e.g., QPP associated metrics, block time utilization, patient satisfaction) and observed in value-based care alignment. |
These unique and often formula-based contractual mechanisms negotiated by staffing companies seek to holistically reduce their financial exposure and require a higher level of administrative oversight and compliance review from the hospital’s perspective. In many cases, hospital administrators negotiate to allow for a more balanced risk sharing among the parties. For example, with respect to annual revenue thresholds, while a hospital may be required to provide additional remuneration should a group’s actual revenue fall below a revenue target, if the group’s actual revenue exceeds the target such excess collections would be counted as a credit applied to offset future subsidy payments, thereby reducing the hospital’s overall financial support payment.
Future State
Looking forward, several prevailing trends within the anesthesiology and CRNA marketplace are expected to continue. Workforce supply constraints are unlikely to abate meaningfully in the near term, suggesting ongoing cost pressures stemming from securing highly compensated anesthesiologists and CRNAs. As these trends unfold, compensation benchmarks may lag real-time market conditions, requiring a more nuanced valuation analysis that accounts for local recruitment difficulty, care team configuration, and the cost of alternative coverage models.
Health systems are expected to increasingly evaluate direct employment of anesthesia providers as an alternative to outsourcing to third-party staffing arrangements. Employment models may offer enhanced operational control, improved care integration, and greater transparency in compensation structures. However, they also shift recruitment risk, workforce management and administrative complexity, as well as long-term cost exposure to the hospital.
Conversely, while outsourced models may continue to offer scalability and recruiting infrastructure, it can be at the expense of higher aggregate costs and reduced local governance. Ultimately, the optimal staffing model will remain market-specific, influenced by provider availability, payor mix, state regulatory frameworks, and facility risk tolerance. Health systems are increasingly turning to technology-based scheduling and preoperative optimization tools to improve anesthesia staffing efficiency, though these solutions are unlikely to fully offset underlying workforce constraints and associated costs.
Hospitals should expect continued evolution in anesthesia staffing arrangements, though the ongoing prevalence of multi-variable and complex financial arrangements is expected to persist.
Closing
The anesthesiology and CRNA marketplace is undergoing a period of sustained structural change driven by persistent labor shortages, shifting care delivery settings, and evolving economic alignment models. As hospitals seek to secure reliable anesthesia coverage in an increasingly competitive environment, these forces have materially altered the financial relationship between hospitals and anesthesia providers, elevating both the complexity and importance of staffing arrangements.
Successfully navigating this landscape requires careful understanding of national and local market dynamics, regulatory requirements, and the valuation principles underlying compensation benchmarks. Hospitals, anesthesia providers, and their advisors must continue to adopt alignment strategies that balance clinical coverage requirements with economic sustainability and compliance objectives.
Thoughtfully structured anesthesiology arrangements, supported by defensible fair market value analyses and informed by local market realities, will remain critical to long-term viability and the preservation of patient access to high-quality anesthesia services. In this environment, hospitals and health systems benefit from partnering with experienced valuation and advisory professionals to align anesthesia arrangements with both regulatory expectations and evolving market realities.
Tate Masse co-authored this piece.
- “ASC Industry Overview,” BH Sales Group, May 2024.
- U.S. Census Bureau. Demographic Projections for the United States.
- Aaron Primm and Diana Anca, “Updates in Non-Operating Room Anesthesia,” National Library of Medicine, June 2025.
- “The Anesthesia Provider Shortage,” Medicus Healthcare Solutions, May 21, 2025.
- Department of Health and Human Services (HHS), Health Resources and Services Administration, Health Workforce Projections.
- National Resident Matching Program. Results and Data: 2024 Main Residency Match.
- Sophie Eydis, “Anesthesia workforce under pressure: Shortages, pay cuts, burnout,” Becker’s ASC Review, September 3, 2025.
- Sophie Eydis, “The anesthesia provider shortage in 10 numbers,” Becker’s ASC Review, November 25, 2025.
- Georgia Garvey, “Smaller share of doctors in private practice than ever before,” American Medical Association, June 24, 2025.
- “The Anesthesia Provider Shortage,” Medicus Healthcare Solutions, May 21, 2025.
- Ibid.
- Patsy Newitt, “The CRNA workforce in 10 numbers,” Becker’s ASC Review, August 28, 2025.
- “Standards for Accreditation of Nurse Anesthesia Programs – Practice Doctorate,” Council on Accreditation of Nurse Anesthesia Educational Programs, May 21, 2025.
- “List of Accredited Educational Programs: Current Status as of December 5, 2025,” Council on Accreditation of Nurse Anesthesia Educational Programs.
- “Become a CRNA,” American Association of Nurse Anesthesiology, webpage.
- “2025 Job Market Outlook for CRNAs/Nurse Anesthesiologists,” Journal of Nursing Administration, American Association of Nurse Anesthesiology, February 26, 2025.
- Bryan A. Wilbanks and Betsy Effinger, “Workforce Assessment of Nurse Anesthetists to Mitigate Intent to Leave and Improve Labor Participation,” National Library of Medicine, February 17, 2025.
- American Association of Nurse Anesthesiology. 2025 Job Market Outlook for CRNAs/Nurse Anesthesiologists.
- “Opt-Out Map,” American Association of Nurse Anesthesiology, web resource.
- “Certified Anesthesiologist Assistants (CAAS),” American Academy of Anesthesiologist Assistants, web resource.
- “CAAs vs. CRNAs,” American Academy of Anesthesiologist Assistants, web resource.
- “Become a CRNA,” American Association of Nurse Anesthesiology, webpage.
- “Number of CAA’s,” National Commission for Certification of Anesthesiologist Assistants,” webpage.
- “42 CFR § 414.46 - Additional rules for payment of anesthesia services,” Legal Information Institute, Cornell Law School.
- Anesthesia for open or surgical arthroscopic procedures on knee joint; total knee arthroplasty
- “CY 2026 PFS Summary Final Rule,” American Association of Nurse Anesthesiology, December 17, 2025, web resource.
- Resource-Based Relative Value Scale, the physician payment system used by CMS.
- Table D-B5 and Table D-B6 of the CMS 2026 Final Rule
- Jasmine Castroverde and Ronamil Portes, “1 in 5 Americans to be 65 years old or older by 2030,” S&P Global, November 14, 2024.
- “List of certified independent dispute resolution entities,” Centers for Medicare & Medicaid Services, webpage.
- Includes all specialties, not exclusive to anesthesiology or CRNA providers
- Adler L, Milhaupt C, Valdez S. Measuring private equity penetration and consolidation in emergency medicine and anesthesiology. Health Affairs Scholar. 2023;1(1):qxad008. doi:10.1093/haschl/qxad008.
- Zhu et al., JAMA, February 18, 2020.
- La Forgia et al., JAMA Internal Medicine, February 28, 2022.
- “Major Shifts in Anesthesia Groups,” Xenon Health, webpage.
- Cristian Lieneck, Mario Gallegos, et al., “Rapid Review of “No Surprise” Medical Billing in the United States: Stakeholder Perceptions and Challenges,” National Library of Medicine, March 5, 2023.
- Mary Bugbee, “It should come as no surprise that KKR-owned Envision Healthcare has finally declared bankruptcy,” Private Equity Stakeholder Project, June 6, 2023.
- Federal Trade Commission v. U.S. Anesthesia Partners, Inc. et al., Complaint for Injunctive and Other Equitable Relief.
- Michael Fenne, “FTC secures settlement against PE in antitrust roll-up case,” Private Equity Stakeholder Project, March 19, 2025.
- Ashleigh Hollowell, “Why US hospitals are breaking up with anesthesiology groups,” Becker’s Hospital Review, February 27, 2024.