 Italiano
Overview
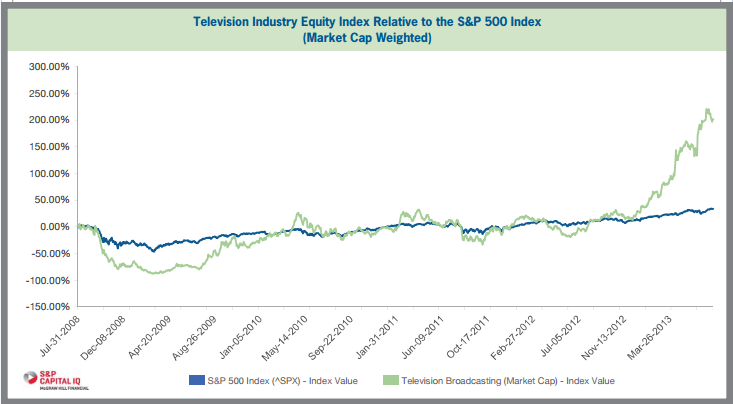
The flurry of television (“TV”) station sales activity has escalated substantially in 2013, with more than $8.0 billion in proposed transactions announced in the first seven months of the year. In comparison, 2011 and 2012 deals totaled $1.2 billion and $2.8 billion, respectively. Led by Gannett Co. Inc.’s $2.2 billion proposed acquisition of Belo Corp. (the “Belo Transaction”), the TV broadcasting industry is experiencing a period of consolidation, as companies have finally emerged from the post-recession deal market draught. The drivers behind the renewed interest include the combination of a robust debt market, increasing compensation fees (“retransmission revenue”) received from multichannel video programming distributors (“MVPD”), and a healthier advertising market. As shown in the chart below, prior to 2012, the TV industry’s equity performance was relatively correlated with the S&P 500 Index (“S&P”). However, for the majority of the last year, the industry outperformed the S&P with significant growth in market capitalization, due in large part from sizable transactions in late 2012 by Sinclair Broadcast Group, Inc., and Nexstar Broadcasting Group, Inc.
Value Drivers in Today’s Television M&A Market
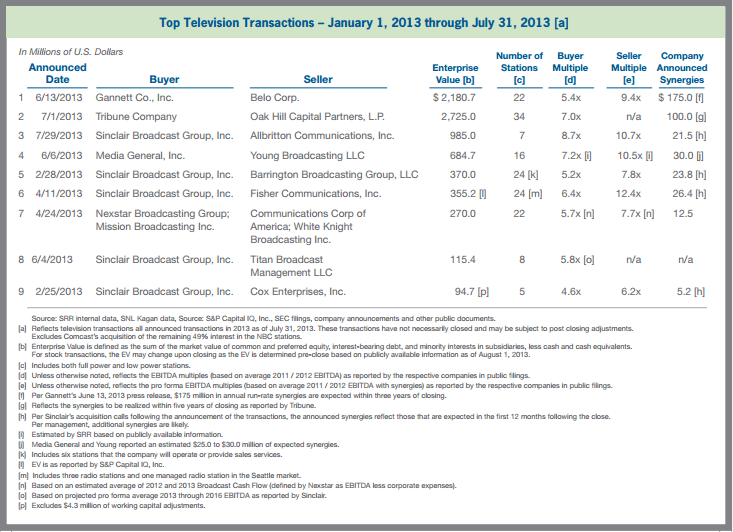
According to SNL Kagan, the Belo Transaction represents the sixth largest TV transaction in history and the largest since News Corp.’s $3.65 billion acquisition of Chris-Craft Industries in 2000. In fact, the nine largest deals to date in 2013 have accounted for more than 95% of the total deal volume, with the four largest accounting for more than 80%. The following table outlines the largest transactions to date in 2013, along with the implied earnings before interest, depreciation, and amortization (“EBITDA”) multiples and the estimated synergies expected to be realized in the transaction.
When acquiring companies, buyers generally look to potential cost savings, financing benefits and potential revenue synergies that can be realized by the combined entity. In nearly every transaction listed on the table, the potential synergies to be realized by a buyer in the TV industry are substantial, as indicated by the average spread between buyer and seller multiples of nearly three (3.0) turns of EBITDA. For the nine transactions, the average and median buyer EBITDA multiples were 6.2x and 5.8x, respectively, compared to average and median seller multiples of 9.2x and 9.4x, respectively. Unless otherwise noted, average EBITDA is based on fiscal years 2011 and 2012. An average level of EBITDA is used to help smooth the fluctuation from the significant inflow of revenue from the sale of political advertising in election years and best represents a normalized level of cash flow to be received (and therefore capitalized), on average, by stations in future periods.
Generally, the parties to these transactions focused public discussions on those potential synergies having a high probability of being achieved in the very near term (i.e., the 12 months following the close). On investor calls, examples of synergies provided by management were: (i) increased retransmission revenues; (ii) elimination of public company costs; and (iii) reduced operating costs and programming fees. For the past several years, gross retransmission revenue (i.e., excluding any payments to the networks for the programming, or “reverse compensation”) has become an increasing percentage of total revenue for TV broadcasters and, according to research published by SNL Kagan, will grow from an estimated 1% of total TV revenue in 2006 to 19% of total TV revenue by 2018 (estimated at 13% in 2013). As a result, retransmission revenues have become increasingly important in deal negotiation and can result in divergent expectations between buyers and sellers, as the buyer is not always willing to pay the seller for synergies it brings to the table and the seller may expect to be paid for higher retransmission dollars in the future based on current industry trends (double digit growth in retransmission dollars is expected through 2018). For those broadcast operators with relatively new agreements, synergies related to increased retransmission revenues are almost immediate, as the “after-acquired” clauses being written into broadcasters’ retransmission consent agreements with MVPDs allow buyers to roll the newly acquired stations into their existing agreement. In situations where the buyer does not have new or favorable retransmission agreements, increased size and scale can be leveraged in future negotiations.
Retransmission agreements are becoming more important, not only to broadcasters, but also to the content providers. In the past, the major TV networks monetized their product by utilizing advertiser slots and even paid TV stations to carry their programming. However, as network affiliation agreements have come up for renewal, reverse compensation is being requested whereby the network operator is demanding a portion of the retransmission dollars, either through a flat percentage or through a fixed fee or minimum guaranteed payment. For broadcasters, the reverse compensation is an offset to the significant cash flow increases resulting from the retransmission revenue.
Other Valuation Impacts
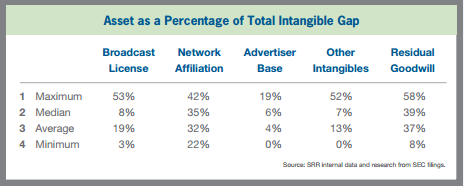
Aside from driving M&A activity, the recent shifts in revenue and expense streams for TV broadcasters impact other factors of TV valuations. Per U.S. generally accepted accounting principals (“GAAP”), companies are required to allocate the purchase price of the various acquired assets (and liabilities) at their Fair Value. For TV stations, the acquired assets typically include working capital items, fixed assets, and intangible assets. While financial assets and fixed assets have not changed with respect to their relative importance to the overall business, there has been a shift in the relative importance of certain intangible assets. Typically, the acquired intangible assets of a TV station include the broadcast license, the network affiliation agreements, the advertiser base, and other intangibles (retransmission consent agreements, etc.). These assets, together with goodwill, are referred to as the “intangible gap.” The table below shows the percentage that each intangible asset contributes to the total intangible gap” based on publicly disclosed allocations for recent TV broadcasting transactions. As indicated, the primary intangible asset of the business is the network affiliation agreement, which accounted for 35% of the total intangible gap based on the median of the researched transactions (despite being an amortizable asset, with a finite term). The broadcast license was next at 8%, followed by the advertiser base and other intangibles. Residual goodwill represented approximately 39% of the intangible gap based on the median of the researched transactions.
As evident by the range of percentages allocated to the different intangible assets, there appears to be divergence in practice as to the relative importance of the broadcast license and the network affiliation. This divergence can result from a number of factors, several of which may be transaction specific and result in the transactions not being directly comparable. For example, stations that do not have a “Big 4” network affiliation might have a materially lower network affiliation value, pushing more of the allocation into the broadcast license or goodwill (on a relative basis). Another area of debate relates to where the retransmission revenue value should be captured. Some argue that the broadcast license gives you the right to those dollars, while others believe the content drives the value, which relates to the network affiliation. Additionally, a case can be made that the retransmission consent agreement is a separable asset and should be valued independent of both the broadcast license and the network. Unfortunately, publicly available information did not provide details to definitively determine the assumptions made by each entity. Further complicating the methodology and valuation of these assets is the introduction of reverse compensation, which “ties” the network affiliation and retransmission agreements. Because these assets have different useful lives for accounting purposes (this has no tax implications, as all intangible assets have a 15-year tax life), the impact on the company’s income statement can be material. For example, assigning more value to the broadcast license, an indefinite lived asset, results in a higher GAAP net income, whereas more value in the network affiliation increases the level of amortization (and reduces net income), as it is an amortizing asset. On the other hand, indefinite lived assets must be tested annually for impairment. Given the shifting industry dynamics it is important to understand how these changes may impact a company’s financial statements.
Conclusion
As the deal market intensifies, the multiples paid for companies are often driven up, as increased competition forces a portion of the synergies to be paid for by the buyer. However, in the TV industry, these multiples have held fairly steady over the past few years, with no material appreciation or return to pre-recession levels. As the pent-up demand for TV deals continues, the industry may see upward pressure on multiples as less inventory becomes available.
Editor’s Note: This article has been published in the September-October 2013 issue of Media Finance Management’s The Financial Manager (TFM).