Italiano


The global energy landscape has been reshaped over the past five weeks. Since the U.S.-Israeli military campaign against Iran began on February 28 and the current effective closure of the Strait of Hormuz, energy markets have entered a period of historic volatility. But beneath the oil price headline numbers lies a more nuanced story, one in which oil and natural gas are moving in different trajectories. Oil markets are pricing in a potentially reversible, temporary price shock while gas markets are pricing in infrastructure damage, storage risk, and LNG competition.
Diverging Paths: Oil Prices Down, Natural Gas Prices Up, And What It Means for Electric and Gas Utilities
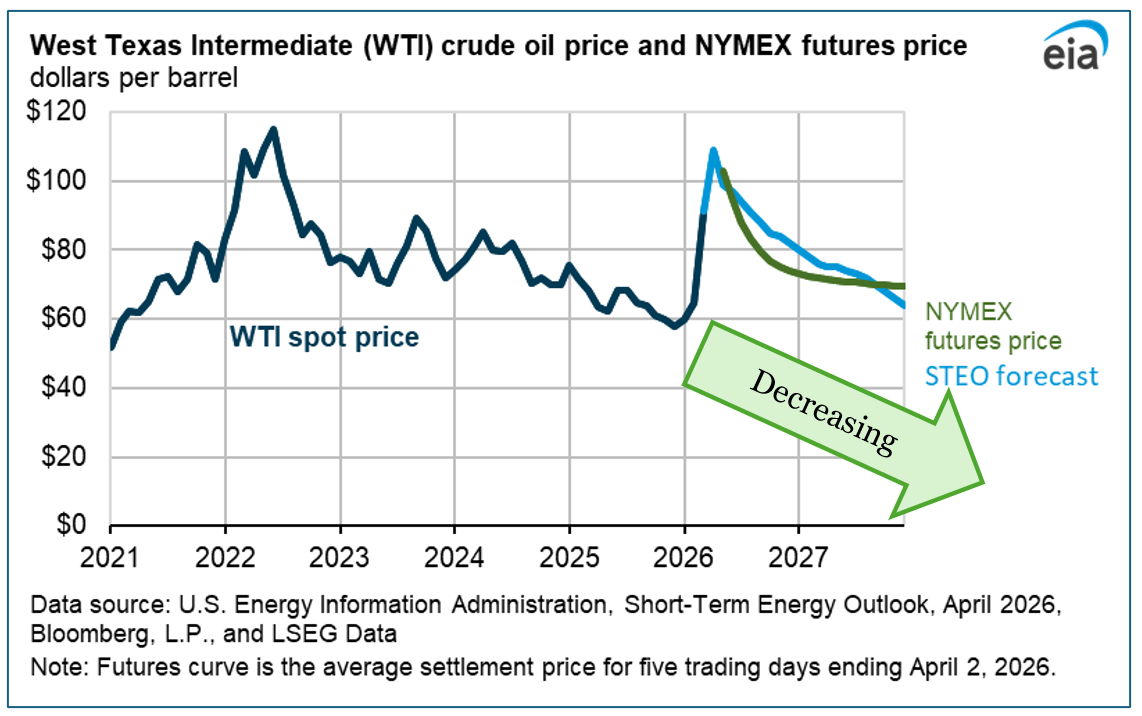
The EIA forecasts Brent crude to peak at $115/BBL in Q2 2026 before easing to $88/BBL by Q4 2026 and averaging $76/BBL in 2027.1 This decline is predicated on the assumption that the conflict does not persist past April and that Strait of Hormuz traffic gradually resumes. Also, OPEC+’s shut-in production, estimated at 9.1 million b/d in April, is expected to slowly return.2
Natural gas, however, is impacted by a different set of value drivers. The physical destruction of Qatari LNG infrastructure cannot be resolved by a ceasefire. Even if Hormuz were to reopen tomorrow, the two damaged LNG trains and the Pearl GTL facility will be offline for years. Industry observers have characterized this as potentially the most significant supply-side event since the Fukushima disaster in 2011.3
The current 10% reduction in global LNG supply is at a time when European storage levels are already low:4
Storage Levels
| Europe Overall | 28.4% |
| Germany | 22.3% |
| The Netherlands | 6% |
For European utilities, this divergence is deeply challenging. Natural gas remains the dominant fuel for electricity generation in much of Europe, and the power sector is the marginal buyer of LNG. Goldman Sachs now expects European inflation to average 2.9% in 2026, peaking at 3.2% in Q2, with energy costs feeding through into services prices and transport costs.
In the U.S., the electricity sector faces its own version of this dynamic, though less severe. The EIA forecasts residential electricity prices to grow 5.1% in 2026 and 2.4% in 2027, with natural gas remaining the largest generation source at 40% of the mix.5 Commercial electricity demand is also expected to grow notably, rising 5.8% in the summer of 2027, driven in part by data center expansion. While U.S. natural gas prices are far lower than European benchmarks, the direction is the same: upward, and increasingly coupled to global LNG market conditions.
Goldman Sachs: Forecasting a European Natural Gas Crisis That Could Last Years
Goldman Sachs has been steadily ratcheting up its European natural gas forecasts as the conflict has unfolded. In early March, Goldman raised its April TTF forecast to €55/MWh, up from €36/MWh previously.6 In an adverse scenario where Hormuz energy flows remain depressed for ten weeks rather than six, Goldman sees summer TTF averaging above €89/MWh (over $100/MWh). A severely adverse scenario incorporating lasting Qatari infrastructure damage could push prices above €100/MWh throughout the summer months, levels not seen since the worst of the 2022 Ukraine crisis.7
Goldman Sachs has warned that European gas markets may be underpricing the duration of supply disruptions. In an April 2, 2026, research note, Goldman observed that European LNG imports have remained “relatively resilient” only because China has absorbed the bulk of the negative supply shock, reducing its own imports.8 That dynamic is unlikely to persist if Asian demand recovers or if the conflict extends.
The structural damage to Qatar’s LNG infrastructure makes this crisis categorically different from a temporary shipping disruption. Missile strikes on March 18 and 19, 2026, damaged two of QatarEnergy’s 14 LNG trains at Ras Laffan Industrial City, knocking out approximately 17% of Qatar’s total LNG export capacity.9 QatarEnergy’s CEO, Saad al-Kaabi, confirmed that repairs could take three to five years.
The Pearl GTL facility in Qatar, a joint venture with Shell, also suffered significant damage, with at least one of its two trains expected to remain offline for a minimum of one year.10
EIA’s U.S. Natural Gas View: Stable, But with Upward Pressure Given Increased AI and Data Center Demand
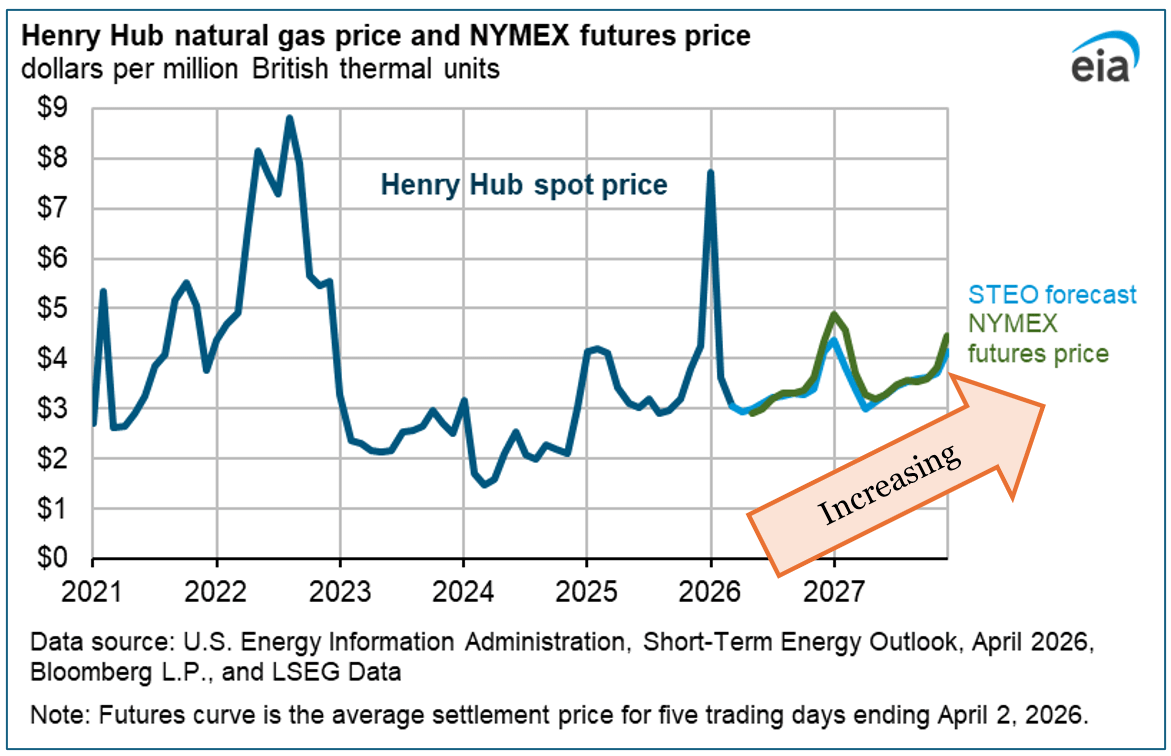
The EIA’s April 2026 Short-Term Energy Outlook presents a notably different picture for U.S. natural gas prices. Henry Hub spot prices averaged $3.53/MMBtu in 2025 and are forecast to be $3.67/MMBtu for 2026 and $3.59/MMBtu for 2027.11 These are very modest prices by historical standards, and they reflect the fundamental reality that the U.S. is a massive natural gas producer that is increasingly well-supplied.
But the calm headline forecasts mask growing upward pressure to export natural gas in the form of liquified natural gas (LNG). U.S. LNG exports hit 17.9 Bcf/d in March, the second-highest monthly volume on record, as the widening spread between Henry Hub and international benchmarks incentivized maximum export throughput.
The EIA forecasts full-year 2026 LNG exports to be 17.0 Bcf/d and 2027 exports at 18.6 Bcf/d, both well above the 2025 record of 15.1 Bcf/d.12 Looking ahead, the EIA expects Henry Hub prices to settle around $3.10/MMBtu through the summer.13
Looking Ahead
The current energy crisis is both temporary and structural. The temporary component is the Hormuz closure and associated production shut-ins, which are expected to resolve as the conflict winds down, bringing oil prices back toward the mid-$70s by 2027 if the EIA’s assumptions hold.
The structural component, however, including lasting damage to Qatar’s LNG infrastructure, depleted European gas storage, and an increasingly LNG-coupled U.S. natural gas market, will persist well beyond any ceasefire.
WTI Strip Prices Drop Almost $20 Per Barrel Following Announced Cease Fire
WTI oil prices experienced a significant reversal on Tuesday/Wednesday (April 7–8, 2026), as President Trump announced a two-week ceasefire with Iran brokered through Pakistani mediation. WTI cratered from above $106 to below $90 per barrel, its sharpest intraday decline since the conflict began.
WTI had surged from approximately $67 on February 27 (before coordinated U.S.-Israeli strikes began) to highs near $112–$117 by April 7, building in what Goldman Sachs characterized as the largest supply disruption in crude market history. Even after Tuesday’s crash, WTI remains roughly 55% above its pre-war level. All eyes will be on the Strait of Hormuz over the next few days; if tankers began to move through the Strait unmolested, the end could be in sight. However, this outcome is anything but certain.
Note — given the significant volatility in prices over the last few days, we will not try and produce the one and two standard deviation-move chart this month, as prices are in a state of flux.
- EIA STEO April 2026, Overview table, p. 2. Brent crude oil spot price: $96/b (2026 average), $76/b (2027 average). Peak of $115/b forecast for Q2 2026, graph is from https://www.eia.gov/outlooks/steo/ accessed April 7, 2026.
- EIA STEO April 2026, Table 1 (Estimated Strait of Hormuz Closure-Related Disruptions), p. 7. Total shut-ins: 7,526 kb/d (March), 9,096 kb/d (April forecast).
- Offshore Energy, “Missile Strikes Leave Fires and Extensive Damage at QatarEnergy’s LNG Assets,” March 2026. Vivek Chandra (CEO, Gulfstream LNG) quoted: “This could be our industry’s most significant Black Swan event since Fukushima fifteen years ago.”
- Euronews, March 27, 2026. EU gas storage at 28.4% as of March 24; Germany at 22.3%; Netherlands at 6.0%. Goldman Sachs revised Euro area GDP growth to 0.7% and inflation to 2.9% for 2026. The chart below reflects the EIA’s current natural gas outlook for Henry Hub: https://www.eia.gov/outlooks/steo/ accessed April 7, 2026.
- EIA STEO April 2026, Electricity section, pp. 12–13. Residential electricity price growth: 5.1% (2026), 2.4% (2027). Natural gas share of electricity generation: 39–40%.
- Goldman Sachs, as reported by Investing.com, “Goldman Raises First-Half European Natural Gas Price Forecast Amid Iran Strikes,” March 3, 2026.
- Goldman Sachs Research note dated March 22, 2026, as reported by Euronews, “Is Europe Sleepwalking Into Its Worst Gas Crisis Since 2022?” March 27, 2026.
- Goldman Sachs note dated April 2, 2026, as reported by BOE Report, “Europe Gas Underprices Hormuz Disruption Risk, China Demand Masks Impact, Goldman Says,” April 6, 2026.
- QatarEnergy CEO Saad al-Kaabi, interview with Reuters, March 19, 2026. See also CNBC, “Iran Attack Wipes Out 17% of Qatar’s LNG Capacity for Up to Five Years,” March 19, 2026.
- Shell confirmed one of two Pearl GTL trains was damaged and all production ceased pending damage assessment. Pearl GTL is a joint venture producing 140,000 BOE/d from 1.6 Bcf/d feed gas. See JPT (Society of Petroleum Engineers), “QatarEnergy Reports Major Damage to LNG, GTL Assets After Strikes,” March 2026.
- U.S. Energy Information Administration, Short-Term Energy Outlook, April 2026, Table 2 (Energy Prices).
- EIA STEO April 2026, Table 5a. Full-year 2026 LNG exports forecast at 17.0 Bcf/d; 2027 at 18.6 Bcf/d. New capacity includes Corpus Christi Stage 3 Train 5 and Golden Pass Train 1.
- EIA STEO April 2026, Natural Gas Storage section, p. 11. October 2027 inventories forecast at ~3,800 Bcf, 1% below the five-year average, the lowest pre-withdrawal-season level since 2022.