Energy Industry Update - Q2 2019
Subscribe to Industry UpdatesEnergy Industry Update - Q2 2019
Subscribe to Industry UpdatesLearning lessons from the past?
In the second quarter of 2019, the energy markets exhibited signs of self-moderating. WTI crude oil prices experienced several days of significant volatility, while remaining largely range bound between the mid-$50s and mid-$60s per barrel. U.S. drilling rig counts continued to decline while production set new high-water marks as the quarter progressed. Although production remains at all-time highs, U.S. producers are cutting rigs and frac spreads due to concerns around not only excess supply, but also demand, which is being driven by trade war issues and concerns of a global slowdown. U.S. producers also continue to remain focused on price stability and living within cash flows, which may serve as a moderate headwind to local production. Takeaway capacity remains a constraint in moving production to market, particularly in the Permian Basin; however, the downstream market continues to benefit from ample feedstock supply. Oilfield service and equipment activity remains very competitive in key regions (Permian), which is driving margin compression. The quarter also experienced an increase in oil majors moving into the Permian Basin (e.g., Chevron, Exxon, etc.), which is not expected to provide margin relief, but could smooth cyclical production volatility as the majors, relative to the independent producers, are less likely to pull production when prices fluctuate. Natural gas remains a challenged market, with no signs of price recovery in the foreseeable future.
Key Q2 Takeaways:
- Recovering late in the quarter, crude oil prices closed the quarter slightly lower down 2.8% ($58.47 per barrel)
- Natural gas prices continued its downward trend, ending 13.3% down for the quarter ($2.31 per million Btu)
- Permian Basin remains the primary source of North American (“NAM”) E&P activity
- Financial performance, including revenue growth and margin expansion, stalled in the first quarter of 2019. Performance expectations remain flat for the remainder of 2019 as commodity prices remain range bound, and equity markets respond accordingly. Land Drilling has become the leader year-over-year while offshore activity (which is showing signs of recovery) remains depressed and Production & Well Services and Equipment Manufacturers decline
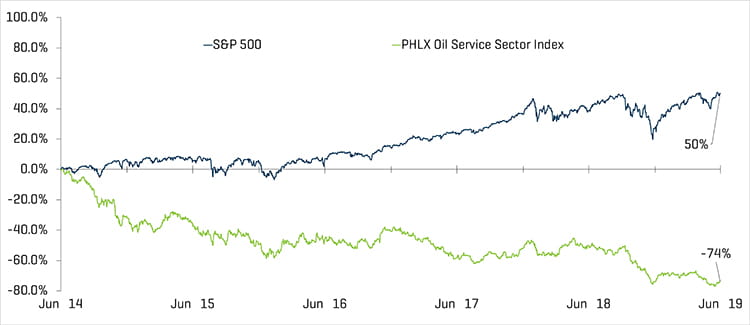
- Public market valuations for OFS companies decreased during the quarter (Philadelphia Oil Service Sector Index (OSX) decreased 14.1%)
- Production & Well Services and Manufacturing transactions remain most active
Crude Oil and Natural Gas
After a quarter marked by several days of significant price declines, WTI crude oil prices closed the second quarter remarkably level with the end of the first quarter, decreasing slightly from $60.14 per barrel to $58.47. WTI crude prices fluctuated relatively significantly during the quarter reaching a high of $66.30 early in the quarter (April 23) then steadily declining to a low of $51.14 on June 12. Prices recovered late in the quarter, increasing more than 14% from June 12, reversing declines experienced through the five most volatile days of downward movement, which accounted for a total price decline of more than 22%. The relative stability has been driven by a couple of factors: 1) tighter crude oil supplies due to outsized OPEC production cuts (particularly from Saudi Arabia and Venezuela); and 2) stronger than expected global growth (recent manufacturing data from China and the United States have been positive) which have bolstered crude oil demand expectations.
Following suit with the first quarter of 2019, natural gas experienced less daily volatility in the second quarter; there were two days during the quarter in which natural gas prices moved more than 3%. However, natural gas prices continued to decline throughout the quarter. The EIA expects relatively stable prices in the second half of 2019 as the impact of increasing demand driven by industrial, petrochemical and LNG end users is anticipated to be moderated by continued record production.
Crude Oil (WTI) Prices and Natural Gas (Henry Hub) Prices
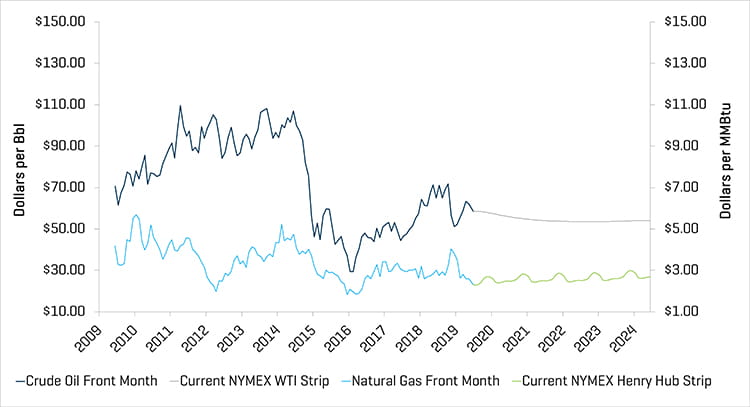
Source: Bloomberg, as of June 30, 2019
The North American market continues to witness drilling and completion efficiency and growth in production. U.S. crude oil output surpassed 12 million barrels per day in April 2019 and has remained above 10 million barrels per day since February 2018. However, a number of producers are focused on living within cash flows and have tempered drilling and completion plans for 2019. The average U.S. land rig count decreased by 39 rigs, from 1,006 to 967 rigs during the quarter. With the exception of the Utica Basin, most regions experienced declines in their rig counts, most notably the Eagle Ford and Marcellus, both down by seven rigs, and the Permian down 13.
Historical U.S. Land Rig Count
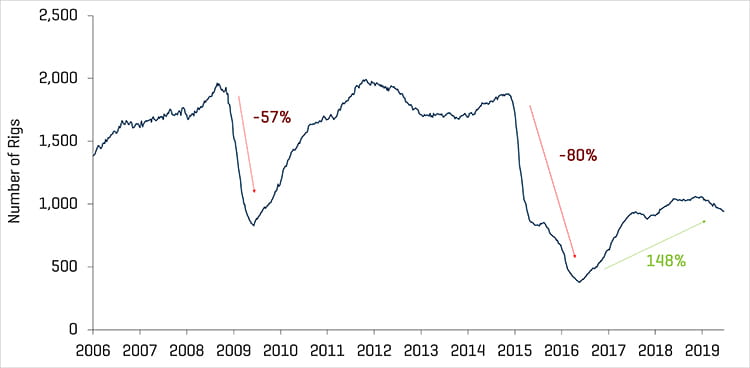
Source: Baker Hughes
Increase in U.S. Land Rig Count Since May 2016
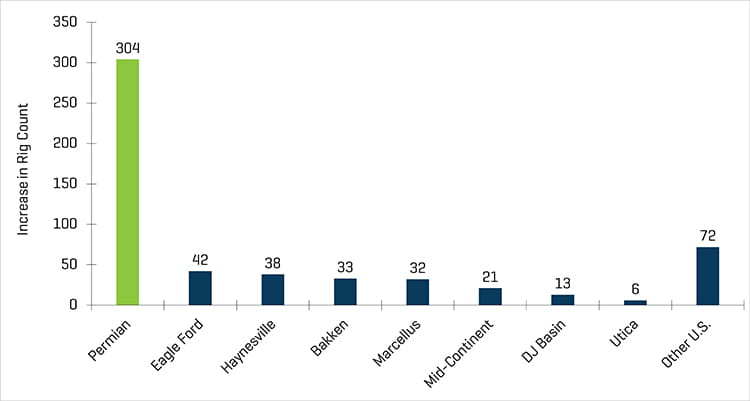
Source: Baker Hughes
Q1 Financial Results Modestly Declined
Revenue and EBITDA margins experienced mixed results by OFS sector in the first quarter of 2019. Although the overall market has rebounded year-to-date (S&P 500 rising approximately 17%) and crude prices rallied through the first quarter, Energy Equipment Manufacturers, Offshore Drilling, and Production and Well Services, experienced declines in revenue and EBITDA quarter over quarter, while Land Drilling experienced growth in revenue and EBITDA. EBITDA margins have been compressed due to higher employee costs in a tightening labor market and increased material prices. Crude prices bounced back in the first quarter of 2019, but performance is expected to remain moderated until later in the year due to the uncertainty in the market. Production levels in the U.S. and specifically from the Permian Basin are expected to grow in 2019, which should continue to support activity in the sector even if prices remain range-bound.
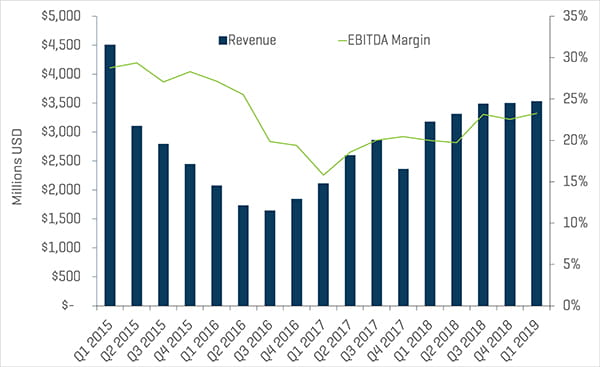
Production and Well Services Quarterly Revenue and EBITDA Margins
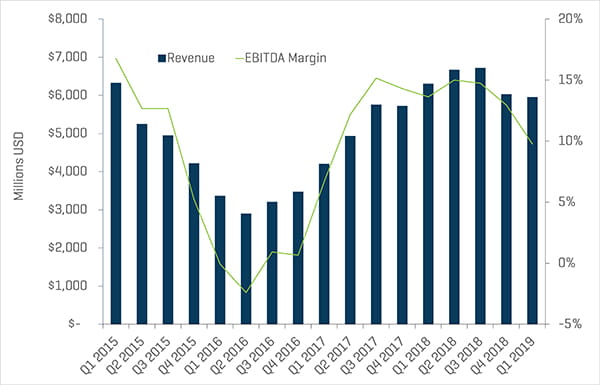
Source: S&P Capital IQ
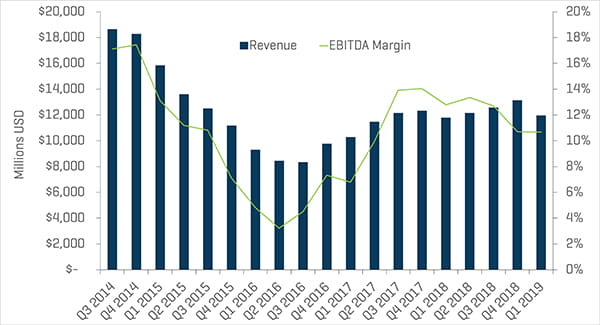
Land Drilling Quarterly Revenue and EBITDA Margins
Source: S&P Capital IQ
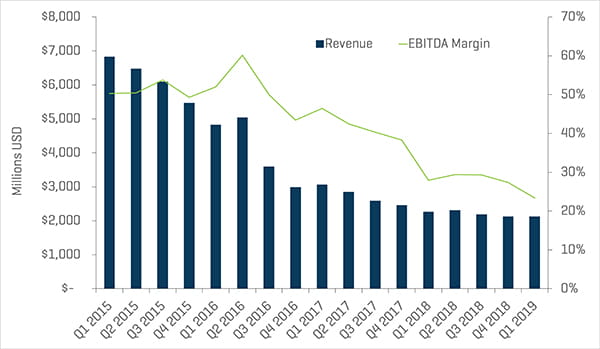
Energy Equipment Manufacturers Quarterly Revenue and EBITDA Margins
Source: S&P Capital IQ
Valuation Levels Continue to Lag Broader Market
Public valuations for OFS companies declined during the quarter (OSX decreased 14.1%), and year over year continues to lag the overall market. From June 30, 2018, the OSX has declined 47.5% compared to the S&P 500, which was up 8.2% over the same period. The energy sector, as a whole, continues to underperform the broader market. Wall Street analysts expect energy stocks to continue to lag S&P performance throughout 2019, with investors remaining focused on a select group of quality stocks with operations in key basins such as the Permian.
Energy Equipment Manufacturers, Offshore Drilling, and Production and Well Services experienced margin contraction in the first quarter of 2019, with EBITDA declining by 9.3%, 15.6%, and 25.5%, respectively. Quarter over quarter, Land Drilling revenue grew slightly by 0.7%, and EBITDA grew by 10.1%, faring better than each of the other sectors.
Offshore Drilling Quarterly Revenue and EBITDA Margins
Equity Index Performance - OSX
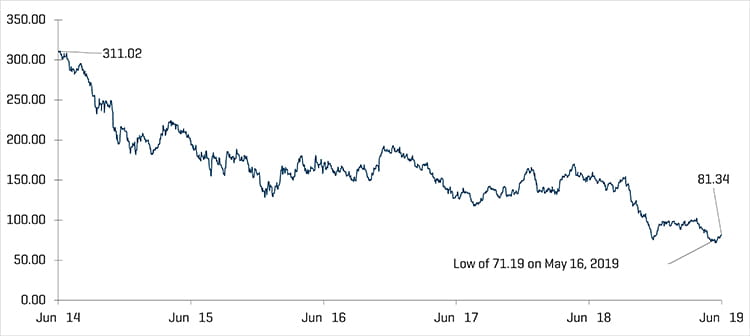
Source: S&P Capital IQ, Inc.
Equity Index Performance
Source: S&P Capital IQ, Inc.
Recent M&A Trends
M&A Activity Weakened Likely Due to Continued Volatility in 2019
Energy service and equipment M&A activity declined by transaction count in the second quarter 2019, totaling 38 transactions, down from 52 transactions in the first quarter. However, the second quarter’s transaction value reached $3.0 billion, up from first-quarter transaction value of $2.8 billion. Transaction dollar value was led by NGL Energy Partners acquiring all the assets of Mesquite Disposals Unlimited for $890 million. Excluding the largest transactions in the first and second quarters of 2019, transaction value increased by $523 million from $1.6 billion to $2.1 billion.
NAM Oilfield Services and Equipment Transactions
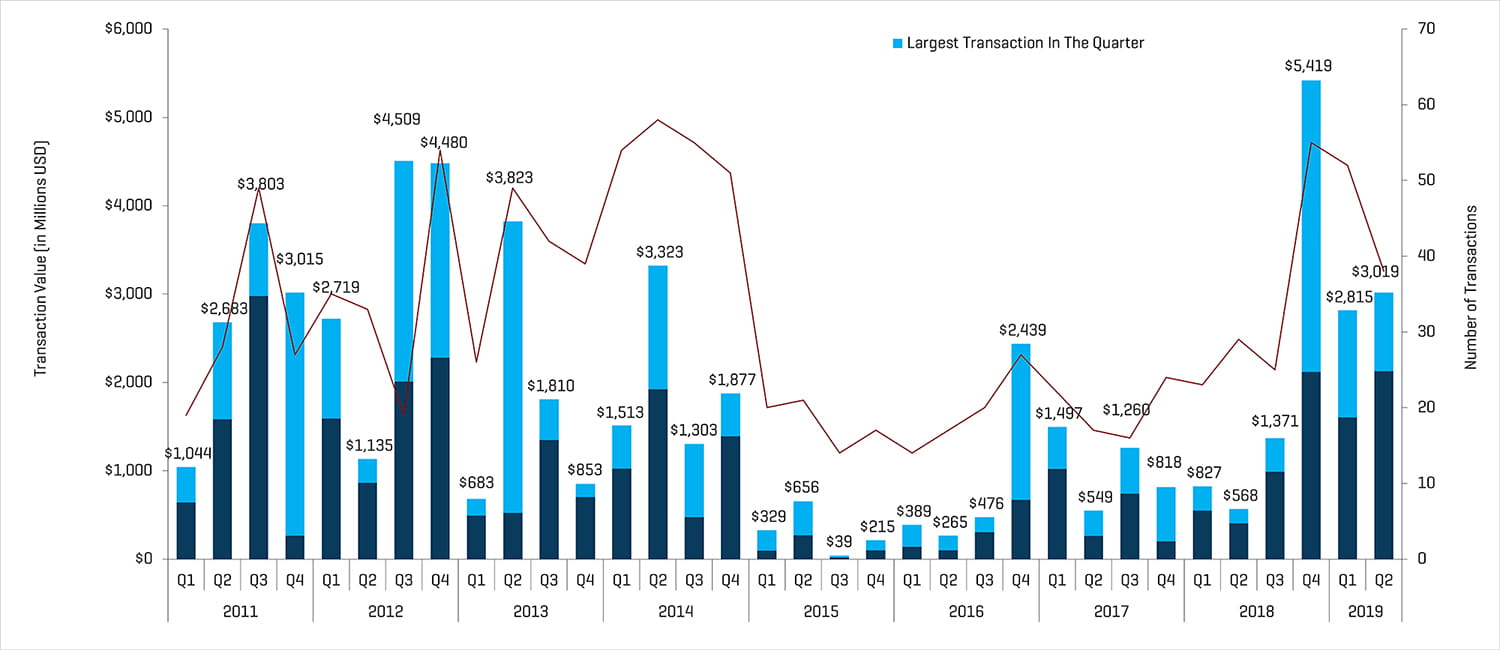
Source: 1Derrick, S&P Capital IQ, and proprietary information
Note: Q3 2015 excludes the Schlumberger/Cameron transaction value of $14.8 billion and Q4 2016 excludes the Baker Hughes/GE transaction value of $32.0 billion for scaling
Production and Well Services led the way in transaction quantity and value in the second quarter of 2019, followed more distantly by Manufacturing. The decrease in the total number of transactions was driven by Geophysical and Reservoir Services, which declined from 11 to four transactions quarter over quarter, and Production and Well Services, which declined from 28 to 21 transactions over the same period. Other sub-sector transaction volume remained relatively in-line with the first quarter.
Q2 2019 NAM Energy Service And Equipment Transaction Count by Sector
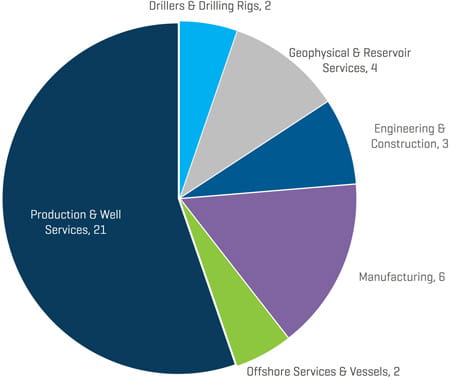
Source: 1Derrick, S&P Capital IQ, and proprietary information
Q2 2019 NAM Energy Service and Equipment Transaction Value By Sector (Millions USD)
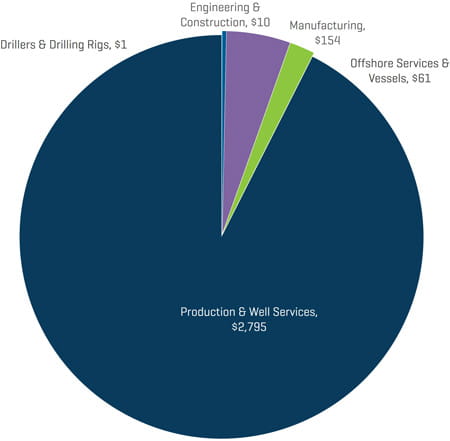
Source: 1Derrick, S&P Capital IQ, and proprietary information
Strategic acquirers were the most active acquirers of energy service and equipment businesses during the second quarter of 2019 (76% of all transactions) with private equity (PE) and PE-backed groups representing 18% of total second-quarter deals, while representing just under 25% of total transaction value.
Q2 2019 NAM Energy Service And Equipment Transaction Count by Buyer Profile
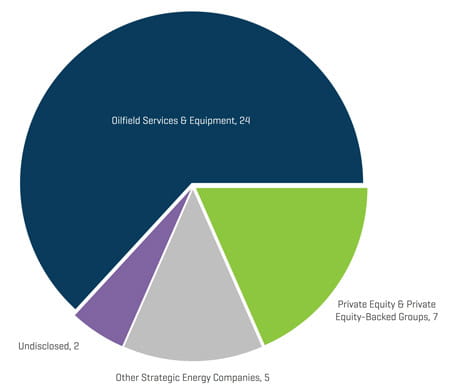
Source: 1Derrick, S&P Capital IQ, and proprietary information
Q2 2019 NAM Energy Service and Equipment Transaction Value by Buyer Profile (Millions USD)
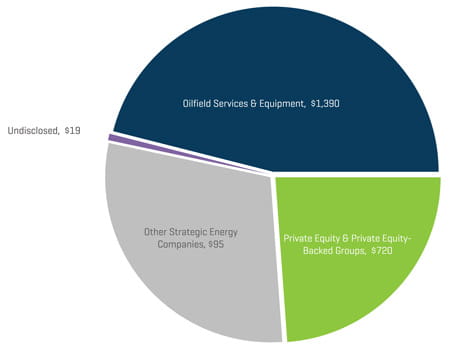
Source: 1Derrick, S&P Capital IQ, and proprietary information
The outlook for M&A and financing activity in the sector is likely to remain somewhat muted during the second half of 2019 due to uncertainty regarding activity levels and E&P budgets, as well as commodity price volatility and geopolitical/trade concerns.