M&A Market Update Is History Repeating Itself?
M&A Market Update Is History Repeating Itself?
With leverage, capital availability, and multiples at all-time highs, what’s not to like?
“History doesn't repeat itself, but it often rhymes.” – Mark Twain, American writer, humorist, publisher, and lecturer.
“What, me worry?” – Alfred E. Neuman, fictitious mascot and cover boy of the American humor periodical Mad magazine.
We are now in the midst of the second-longest period of economic expansion in recent memory (Figure 1).
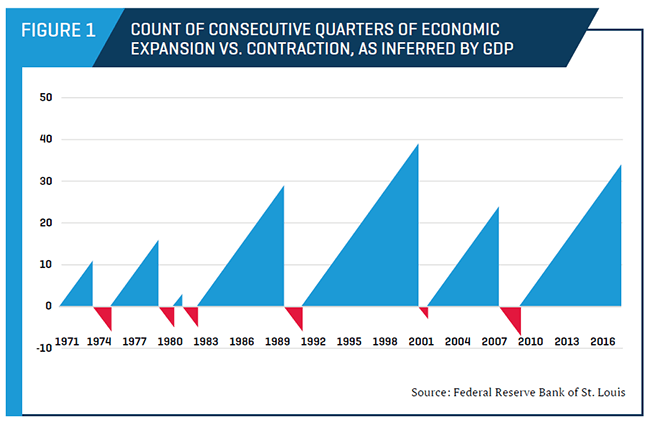
The current economic cycle, which began in the third quarter of 2009 and which at last count stands at 34 quarters long, has only been eclipsed in length once in the past 50 years.[1]
How much longer can this market last?
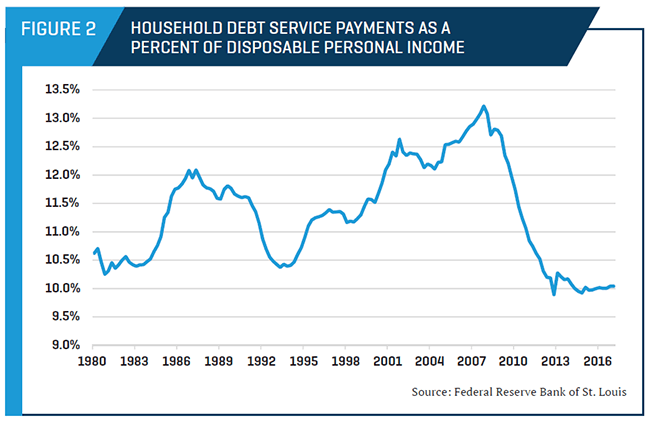
The last recession was created, in large part, by too much leverage on both personal and corporate balance sheets. Personal balance sheets do not appear overleveraged, at least by one metric (Figure 2).
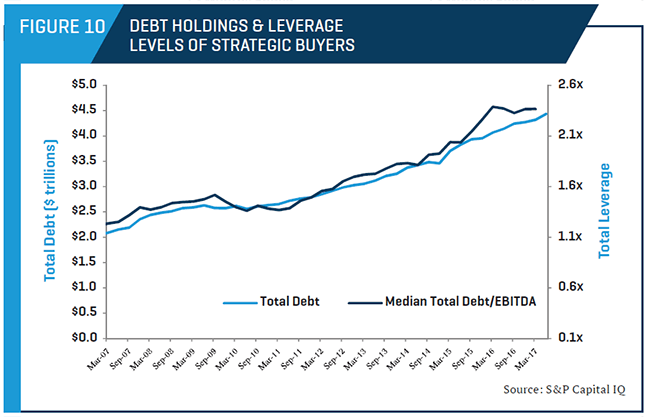
Corporate balance sheets are another matter. As we show later in Figure 10, debt and leverage (defined as debt/EBITDA) among U.S. companies appears to continue its steady rise. Furthermore, total leverage multiples for leveraged buyouts (LBOs) are at or above levels seen in the 2005 through 2007 timeframe.
Should we worry about the implication of the above for the economy broadly, the mergers and acquisitions (M&A) market, or, for that matter, business in general? It is difficult to say.
However, one thing is clear: Trees don’t grow to the sky, what goes up must come down, and while history does not repeat itself, it often rhymes.
Current State of the M&A Market
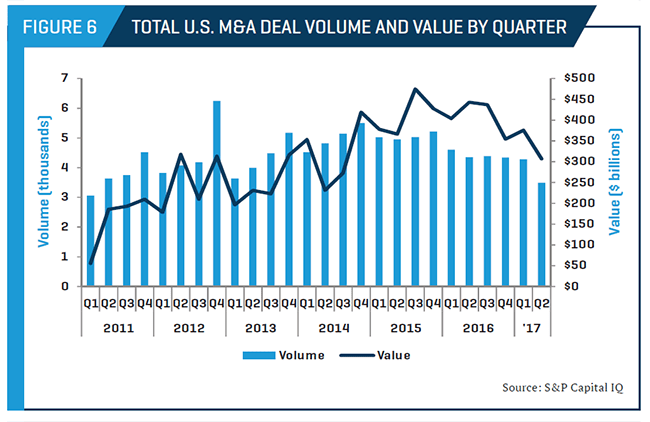
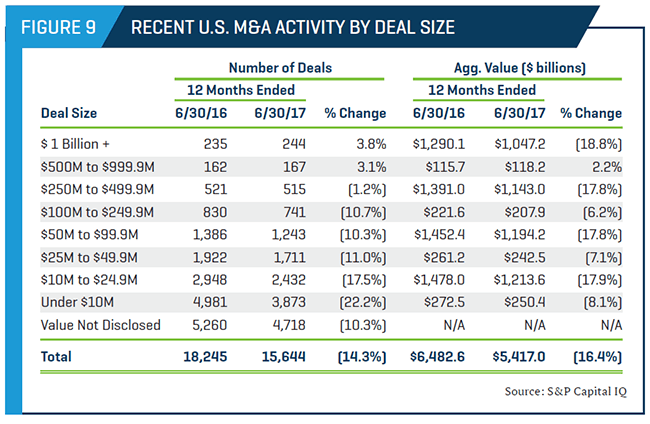
The M&A market has been on overdrive for over six years, though in the past few quarters, we experienced somewhat of a mixed bag. As we illustrate later in Figures 6 and 9, overall reported transaction volume and value have decreased markedly year over year. The one exception is among the largest deals, those over $500 million.
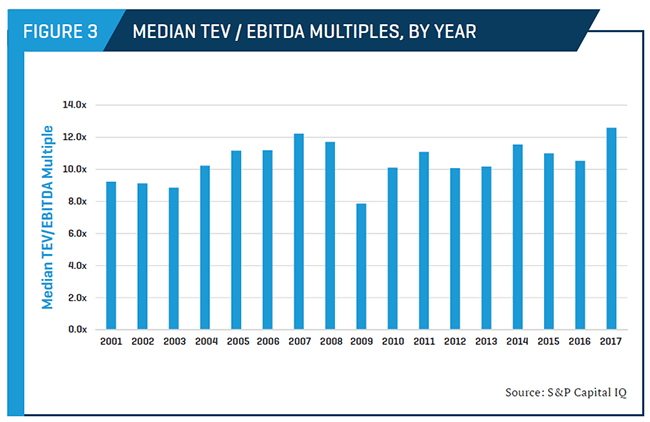
In spite of the slowdown in overall M&A activity, valuation multiples in terms of earnings before interest, taxes, depreciation, and amortization (EBITDA) remain at or near peak levels (Figure 3). Astute readers of our market updates know that we attribute such lofty valuations to a continued imbalance between the supply of high-quality acquisition opportunities and the number of potential buyers (both strategic and private equity) willing and able to deploy capital.
Such valuation premiums – relative to more typical market environments – are difficult to quantify, though they appear to average (based on our proprietary analysis of nonpublic information of multiples paid) in the 2.0x to 3.0x range. Furthermore, just as remarkable (and even more difficult to quantify) is the widespread sentiment among dealmakers that even the most “storied” or difficult and cyclical companies are generating interest in the current environment.
Unemployment continues its steady downward trajectory, consumer confidence continues its upward trajectory, and U.S. gross domestic product (GDP) continues to exhibit signs of longer-term stability.
Our View of the Future
The view looking forward is, as always, murky at best.
The general consensus among economists is that the current political climate may constrain the Trump administration’s ability to enact any meaningful election promises (e.g., infrastructure investment, tax reform). This is unfortunate, as both of these promises were priced into the equity markets immediately after the November results.
Lately, corporate profits have been buoyed by deflationary raw-material inputs, and many commodities, from copper to corn, are at or near recent lows. But we do not know how much longer these benefits will last.
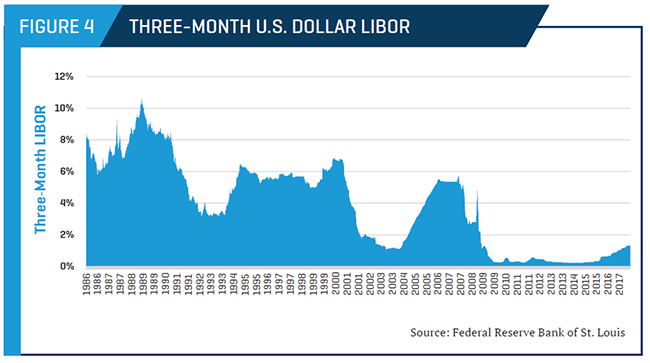
The debt markets remain open, and we cannot fathom a scenario in the next few years in which lending guidelines, capital requirements, and regulatory oversight increase under President Trump. Interest rates are a different story. If the recent runup in the London Interbank Offered Rate (LIBOR) is any indication, interest rates are headed in only one direction – up – though by historical standards, rates are still near the record lows (Figure 4).
Fortunately, as we have discussed in previous M&A updates, LBO returns are far more sensitive to decreases in debt availability than to increases in borrowing costs.
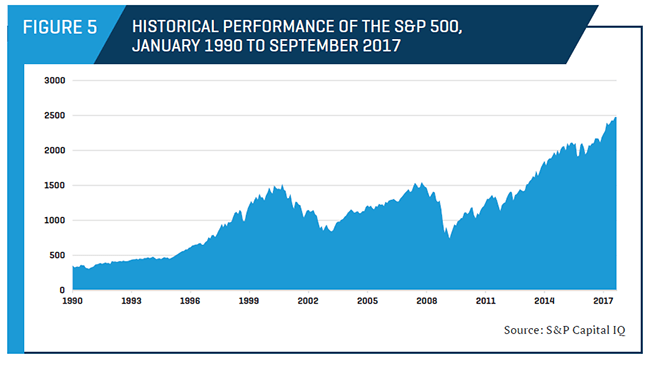
As of this writing, the public equity markets continue to hit new highs seemingly every day (Figure 5). Yet we do not know when another correction will occur or if such a correction will negatively influence M&A multiples.
We also do not know if a major external shock to the system (e.g., a widespread coordinated terrorist attack or escalation of tensions on the Korean peninsula) is on the horizon, nor how the Trump administration and the U.S. economy would react to such an event.
Finally, we do not know how buyers will react in the face of continued pressure to top-line growth prospects. Will buyers take a long-term view, or will they (as has typically been the case) begin to lower bid prices to better align with long-term average multiples?
In summary, as we pause to reflect upon where we are in the cycle, we see that the fundamental forces driving M&A activity and valuation multiples are no longer as perfectly aligned as they once were. This is not to say that a major pullback in prices is imminent; although we no longer expect continued multiple expansion, we do view multiple normalization as an ever-increasing possibility.
M&A Market Activity
Improved availability of capital, better and sustained company performance, and narrower valuation gaps have powered U.S. M&A transaction activity since 2010. The past 12 months showed a marked softness in both overall transaction volume and value (Figure 6).
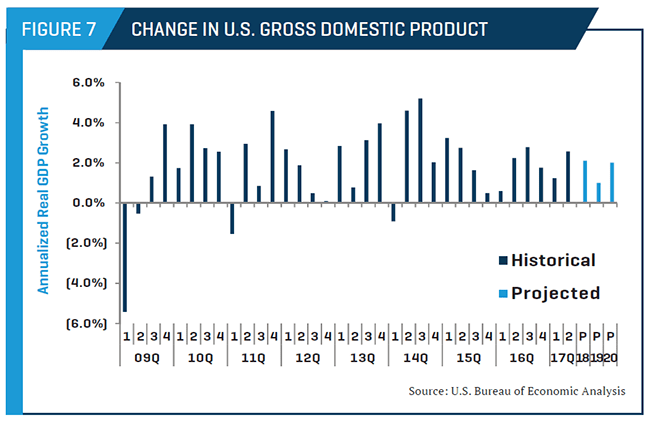
U.S. GDP, often viewed as a proxy for the overall health of the economy, has recovered from the contraction experienced during the recession in late 2008 and early 2009. While few economists are predicting another recession in the near future, neither are forecasters predicting rampant growth (Figure 7).
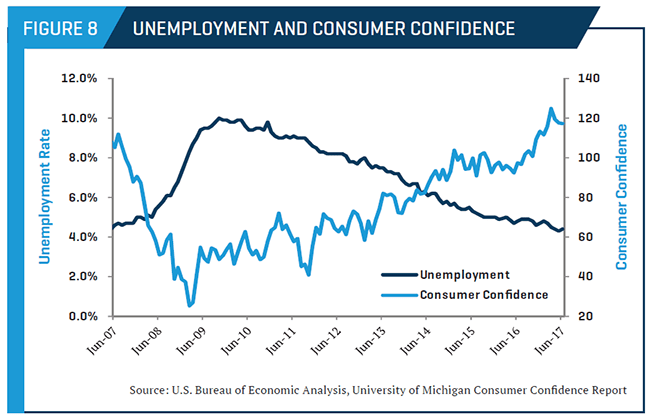
Consumer confidence generally improves as the unemployment situation improves. Fortunately, unemployment has maintained its steady march downward and sits at levels not seen for more than 10 years (Figure 8). Such favorable tailwinds are expected to continue through the remainder of 2017.
As mentioned our previous M&A updates, data on lower middle market transactions is notoriously difficult to come by, but year-over-year comparisons can prove illustrative. Deals falling within the lower middle market (in this context defined as transactions less than $250 million in total value) were subdued relative to the prior 12-month period, as both volume and value were down. Only the very largest of deals showed improvement year over year (Figure 9).
Strategic buyers were active in the first half of 2017, though less so than in the recent past. The continued (albeit, softer) stimulus for strategic-led deals is a combination of lower organic growth prospects absent acquisitions, accommodative senior debt markets, and a record amount of cash and other liquid assets held by nonfinancial companies. Evidence of the accommodative debt markets is clearly visible in the continued rise in total debt levels. Companies’ balance sheets are becoming more leveraged as median total debt/EBITDA ratios increased through the second quarter of 2017 (Figure 10).
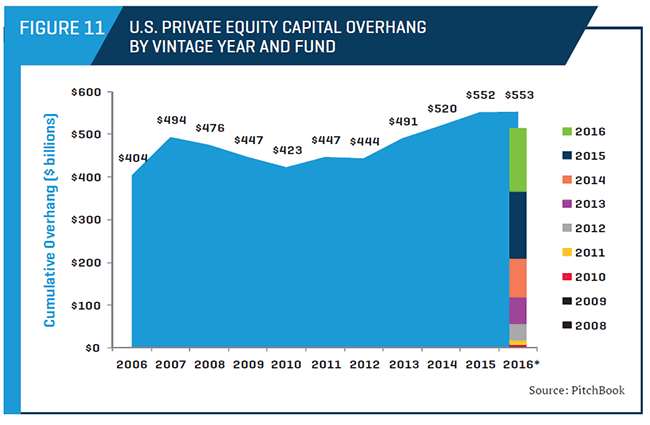
Complementing (from a seller’s perspective) strategic buyer interest is private equity, which remains a potent force in deal flow. Favorable credit markets and an estimated $553 billion capital overhang (one quarter of which is nearing the end of its investment horizon) will continue to provide an impetus for investors to remain competitive in transactions (Figure 11). Furthermore, it should be kept in mind that the capital overhang actually translates into $1 trillion or more in purchasing power, given the leverage available in today’s marketplace.
Nowhere is the increase in current valuation multiples due to the aforementioned factors more evident than in the prices paid by private equity during the past five years. Such prices are a function of debt providers’ willingness to lend and sponsors’ willingness, for the first time in history, to lower their required return thresholds. Historically, financial sponsors promised their limited partners an expected compounded annual return of 20% to 30%. Recent feedback from many in the private equity community (all of whom wish to remain nameless) is that returns are now modeled in the high teens. Such reduction in required returns has the same effect as a reduction in yields on bonds – when rates fall, the prices that buyers pay for new investments rise because prices and rates move in opposite directions.
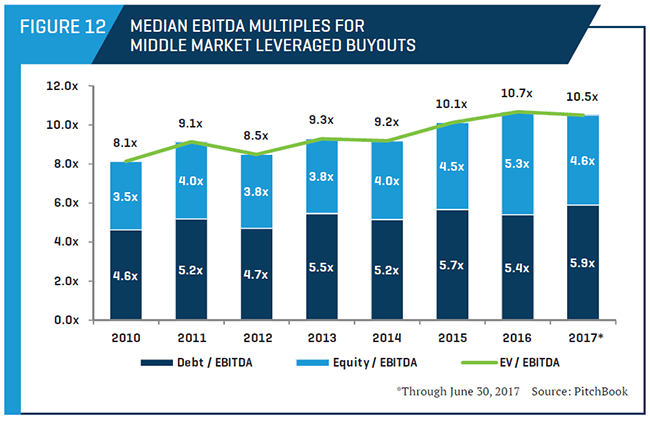
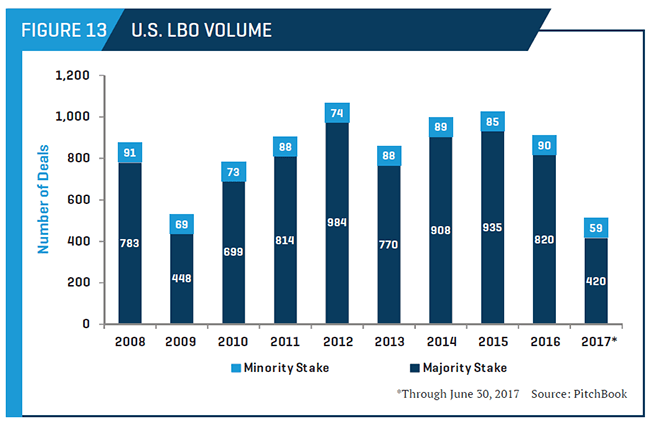
The continued increase in the reported multiples for 2017 (which have posted the highest reported multiples in recent memory) is likely a result of a decrease in quality targets available to be acquired, as LBO volume is flat to down relative to the prior 12 months (Figures 12 and 13).
Outlook for the Remainder of 2017 and Beyond
Our view for the foreseeable future remains cautiously optimistic. Buyer appetites and resulting valuation multiples are still at or near historical levels. How long this will last is anyone’s guess. That said, for those business owners on the fence about selling their companies, it may be prudent to accelerate such decisions rather than wait to see what the road ahead has in store.
- The bull market during the 1990s was 39 quarters long.