M&A Market Update Impact of Tax Code Overhaul
M&A Market Update Impact of Tax Code Overhaul
What effect will the recent changes to the U.S. tax code have on activity in 2018?
“In this world nothing can be said to be certain, except death and taxes.” – Benjamin Franklin, Founding Father
“We contend that for a nation to try to tax itself into prosperity is like a man standing in a bucket and trying to lift himself up by the handle.” – Winston S. Churchill, former British Prime Minister
On December 22, 2017, President Trump signed into law the most sweeping set of changes to the U.S. tax code in recent history. How will these changes affect the merger and acquisition (M&A) landscape? Will valuations continue to rise? Are leveraged buyouts (LBOs) still attractive? We attempt to answer some of these questions and forecast the implications for 2018 and beyond.
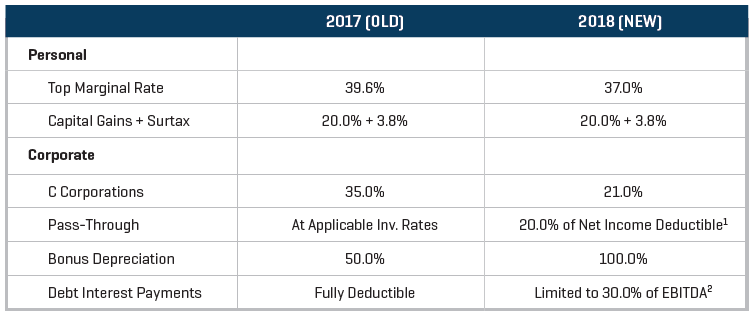
Figure 1 illustrates some of the more meaningful changes brought with the recently enacted legislation.
Figure 1. U.S. Tax Code: Old vs. New
Most economists agree that these changes will provide, at a minimum, a short-term stimulus to the overall economy; longer-term benefits remain to be seen. That said, what is abundantly clear is that we are in the midst of one of the longest periods of economic expansion in recent history (Figure 2).
Figure 2. Count of Consecutive Quarters of Economic Expansion vs. Contraction, as Inferred by GDP
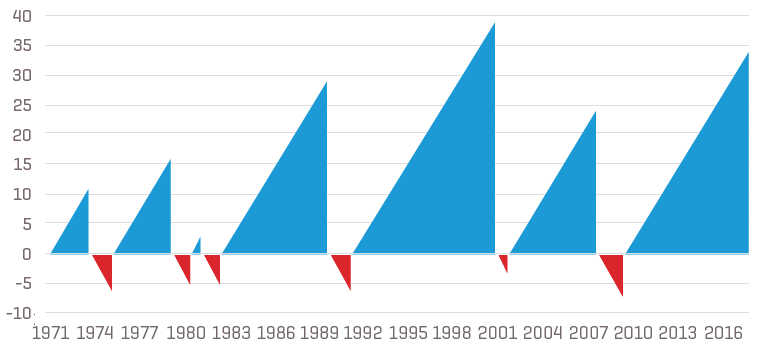
Source: Federal Reserve Bank of St. Louis
The current economic cycle, which began in the third quarter of 2009 and which, at last count, stands at 34 quarters long, has been eclipsed in length only once in the past 50 years.[3]
How much longer can this market last?
The last recession was created, in large part, by too much leverage on both personal and corporate balance sheets. Personal balance sheets do not appear overleveraged, at least by one metric (Figure 3).
Figure 3. Household Debt Service Payments as a Percentage of Disposable Personal Income
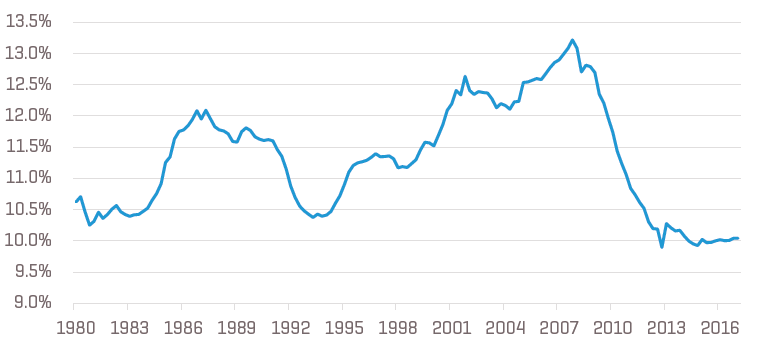
Source: Federal Reserve Bank of St. Louis
Corporate balance sheets are another matter. As we later show in Figure 11, debt and leverage (defined as debt/EBITDA) among U.S. companies continue their steady rise. Furthermore, total leverage multiples for LBOs are at or above levels seen during the 2005 through 2007 time frame.
Should we worry about the implication of the above for the economy, the M&A market, or business in general? It is difficult to say. As long as earnings remain strong and commodity prices remain in check, the markets should remain both open and strong.
However, one thing is clear – this is the best market to sell a company; valuations have never been higher.
Current State of the M&A Market
As can be clearly seen in Figures 7 and 10 later, overall reported transaction volume and value have decreased markedly year over year. However, the slowdown in overall M&A activity has not dampened valuations buyers are willing to pay. Multiples in terms of earnings before interest, taxes, depreciation, and amortization (EBITDA) remain near peak levels (Figure 4). Astute readers of our market updates know that we attribute such lofty valuations to a continued imbalance between the supply of high-quality acquisition opportunities and the number of potential buyers (both strategic and private equity) willing and able to deploy capital.
Figure 4. Median TEV/EBITDA Multiples, by Year
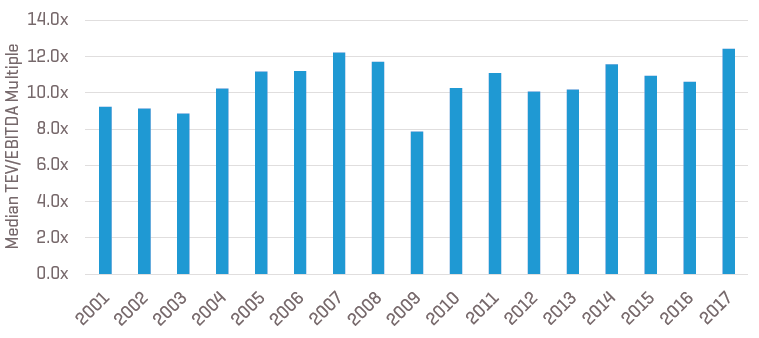
Source: S&P Capital IQ
Such valuation premiums – relative to more typical market environments – are difficult to quantify, though they appear to average (based on our proprietary analysis of nonpublic information of multiples paid) in the 2.0x to 3.0x range. Furthermore, just as remarkable (and even more difficult to quantify) is the widespread sentiment among dealmakers that even the most “storied” or difficult and cyclical companies are generating interest in the current environment.
Unemployment continues its steady downward trajectory, consumer confidence continues its upward trajectory, and U.S. gross domestic product (GDP) continues to exhibit signs of longer-term stability.
Our View of the Future
The view looking forward is, as always, murky at best.
The decrease in corporate taxes will result in a dramatic increase in free cash flow for most companies. This increased cash flow, combined with the 100% bonus depreciation, should benefit a wide range of industries, including any type of capital equipment manufacturer and/or distributor.
Many commodities, from copper to corn, are at or near recent lows, but we do not know how much longer this benefit will last.
The debt markets remain open, and we cannot fathom a scenario in the next few years in which lending guidelines, capital requirements, and regulatory oversight increase under President Trump, though interest rates are a different story. If the recent runup in the London Interbank Offered Rate (LIBOR) is any indication, interest rates (and inflation) are headed in only one direction – up – as rates begin rising from their near record lows (Figure 5).
Figure 5. Three-Month U.S. Dollar LIBOR
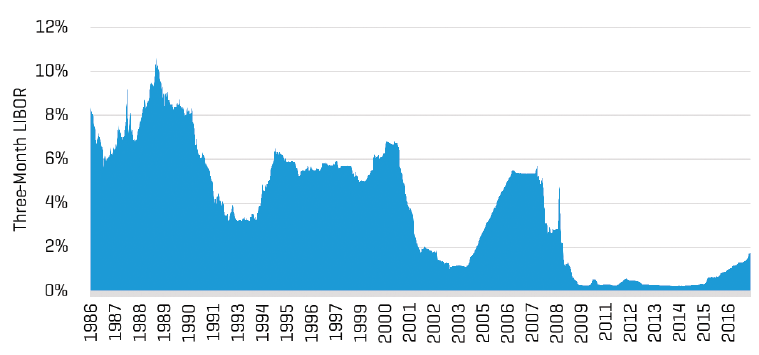
Source: Federal Reserve Bank of St. Louis
Fortunately, as discussed in prior articles, LBO returns are far more sensitive to decreases in debt availability than to increases in borrowing costs.
As we write this, the public equity markets remain near an all-time high in spite of volatility seen in early February (Figure 6). Yet we do not know when another correction will occur, and if such a correction will negatively influence M&A multiples.
Figure 6. Historical Performance of the S&P 500 (January 1990 to Present)
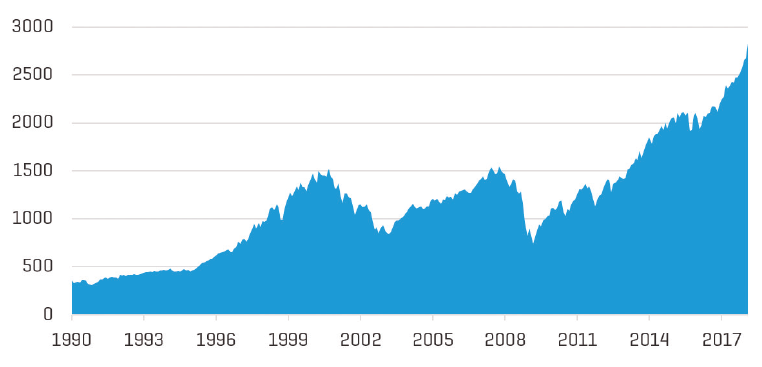
Source: S&P Capital IQ (Through January 31, 2018)
We do not know if a major external shock to the system (e.g., a widespread, coordinated terrorist attack, or escalation of tensions on the Korean Peninsula) is on the horizon or how the Trump administration and the U.S. economy would react to such an event.
Finally, we do not know how buyers will react in the face of continued pressure on top-line growth prospects. Will such buyers take a long-term view, or will they (as has typically been the case) begin to lower bid prices to better align with long-term average multiples?
In summary, as we pause to reflect upon where we are in the cycle, we see that the fundamental forces driving M&A activity and valuation multiples are no longer as perfectly aligned as they once were. This is not to say that a major pullback in prices is imminent; though we no longer expect continued multiple expansion, we do view multiple normalization as an ever-increasing possibility.
M&A Market Activity
Improved availability of capital, better and sustained company performance, and narrower valuation gaps have powered U.S. M&A transaction activity since 2010. The past 12 months showed a marked softness in both overall transaction volume and value (Figure 7).
Figure 7. Total U.S. M&A Deal Volume and Value by Quarter
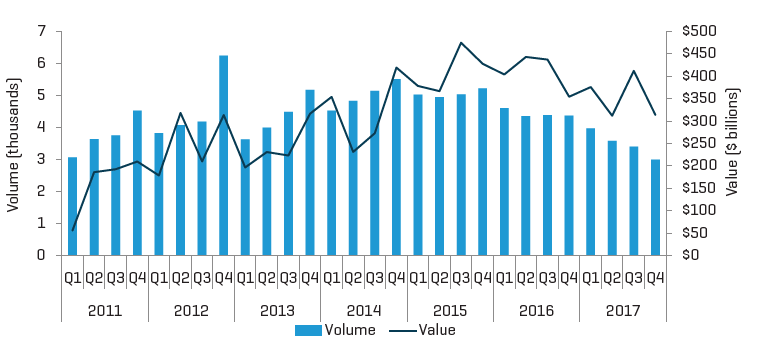
Source: S&P Capital IQ
U.S. GDP, often viewed as a proxy for the overall health of the economy, has recovered from the contraction experienced during the recession in late 2008 and early 2009. Few economists are predicting another recession in the near future; tax reform ensured at least 12 months of continued expansion (Figure 8).
Figure 8. Change in U.S. GDP
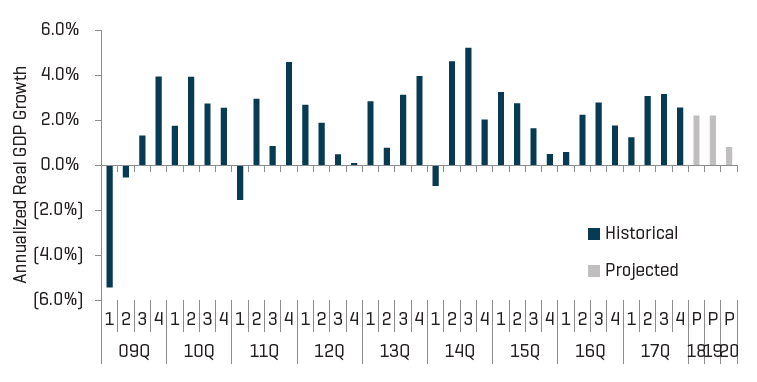
Source: U.S. Bureau of Economic Analysis
Consumer confidence generally improves as the unemployment situation improves. Fortunately, unemployment has maintained its steady march downward and sits at levels not seen since mid-2000 (Figure 9). Such favorable tailwinds are expected to continue throughout 2018, though there are signs that the tightening of the labor force is finally beginning to exert upward pressure on inflation.
Figure 9. Unemployment and Consumer Confidence
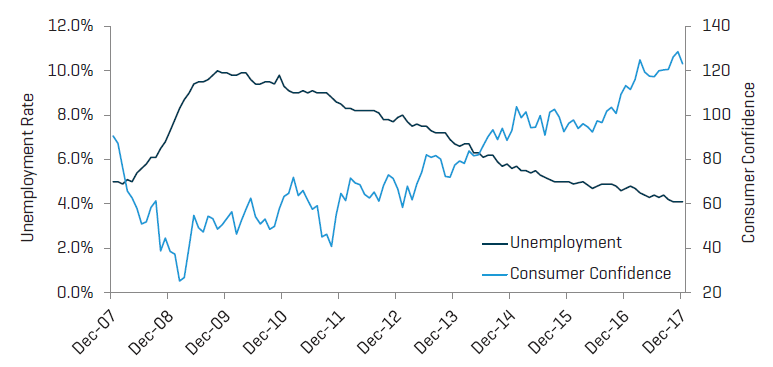
Source: U.S. Bureau of Economic Analysis, University of Michigan Consumer Confidence Report
As mentioned in previous articles, data on lower middle market transactions is notoriously difficult to come by, but year-over-year comparisons can prove illustrative. Deals falling within the lower middle market (in this context defined as transactions less than $250 million in total value) were subdued relative to the prior 12-month period as both volume and value were down. Only the very largest of deals (exceeding $1 billion) showed improvement in volume year over year, though aggregate value was down (Figure 10).
Figure 10. Recent U.S. M&A Activity by Deal Size
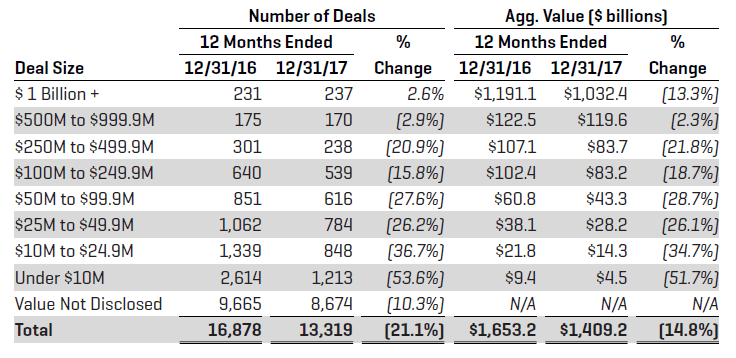
Source: S&P Capital IQ
Strategic buyers were active in the second half of 2017, though less so than in the recent past.
The continued (albeit softer) stimulus for strategically led deals is a combination of lower organic growth prospects absent acquisitions, accommodative senior debt markets (for most of the past 12 months), and a record amount of cash and other liquid assets held by nonfinancial companies. Evidence of the accommodative debt markets is clearly visible in the continued rise in total debt levels. Companies’ balance sheets are becoming more leveraged as median total debt/EBITDA ratios increased through the second half of 2017 (Figure 11).
Figure 11. Debt Holdings and Leverage Levels of Strategic Buyers
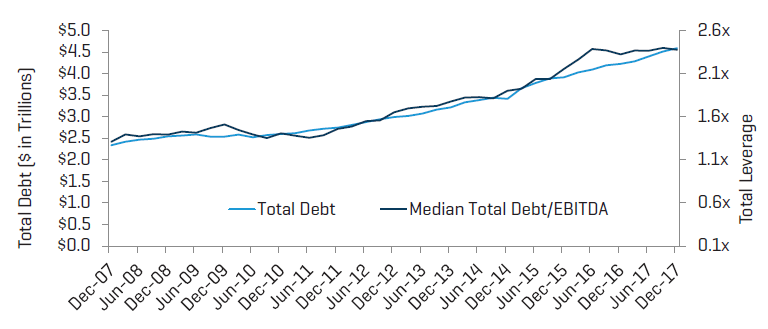
Source: S&P Capital IQ
Complementing (from a seller’s perspective) strategic buyer interest is private equity, which remains a potent force in deal flow. Favorable credit markets and an estimated $553 billion capital overhang (one-fourth of which is nearing the end of its investment horizon) will continue to provide an impetus for investors to remain competitive in transactions (Figure 12). Furthermore, it should be kept in mind that the capital overhang actually translates into $1 trillion or more in purchasing power, given the leverage available in today’s marketplace.
Figure 12. U.S. Private Equity Capital Overhang by Vintage Year and Fund
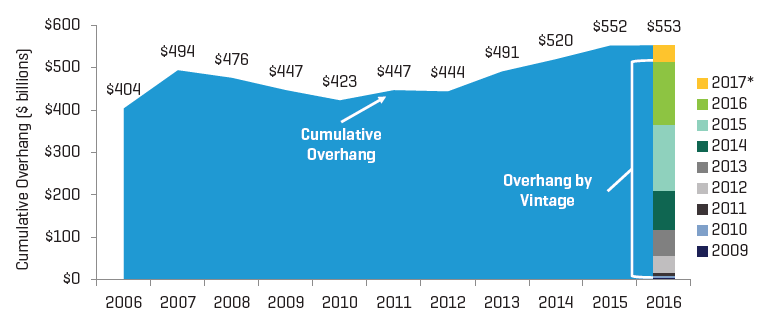
* As of July 10, 2017
Source: PitchBook
Nowhere is the increase in current valuation multiples due to the aforementioned factors more evident than in the prices paid by private equity during the past five years. Such prices are a function of debt providers’ willingness to lend and sponsors’ willingness, for the first time in history, to lower their required return thresholds. Historically, financial sponsors promised their limited partners an expected compounded annual return of 20% to 30%; however, recent feedback from many in the private equity community (all of whom wish to remain nameless) is that returns are now being modeled in the high teens. Such a reduction in required returns has the same effect as a reduction in yields on bonds – when rates fall, the prices that buyers pay for new investments rise. The continued increase in multiples for 2017 (among the highest in recent memory) is a direct result of a decrease in quality targets available to be acquired, as LBO volume is down relative to the prior 12 months (Figures 13 and 14).
We do not expect a material negative impact from the new limitation on the deductibility of interest payment to 30% of EBITDA; for all but the most highly leveraged companies, this limitation will not apply. Even in those cases where it does, the net impact on after-tax free cash flow will not be very meaningful.
Figure 13. Median EBITDA Multiples for Middle Market Leveraged Buyouts

* As of December 31, 2017
Source: PitchBook
Figure 14. U.S. LBO Volume (2008-2017)
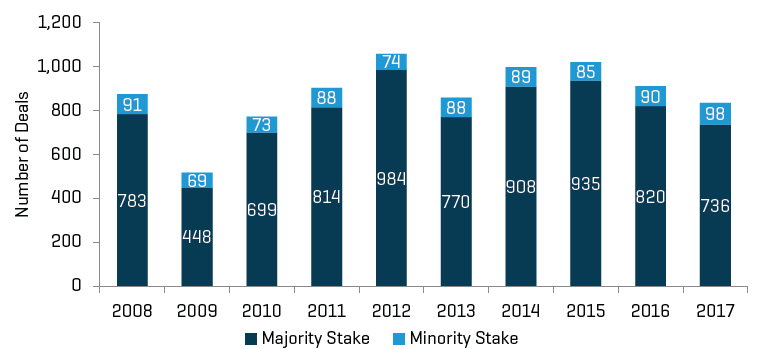
* As of December 31, 2017
Source: PitchBook
Outlook for the Remainder of 2018 and Beyond
Our view for the foreseeable future remains cautiously optimistic. Buyer appetites and resulting valuation multiples are still at or near historical levels. How long this will last is anyone’s guess; that said, for those business owners on the fence about selling their companies, it may be prudent to accelerate such decisions rather than wait to see what the road ahead has in store.
Also contributing to this article:
Jack Kedroski
Analyst, Investment Banking
+1.312.237.4872
jkedroski@stout.com
Related Professionals


Related Insights
-

Article
M&A Market Update: Is History Repeating Itself?
-

Industry Update
Healthcare & Life Sciences Industry Update – Q4 2017
-

Industry Update
Metals Industry Update - Q4 2017
-

Industry Update
Energy Industry Update - Q4 2017
-

Industry Update
Tire Distribution & Manufacturing Industry Update - 2017 Year in Review
-

Industry Update
Plastics Industry: 2017 Year in Review and 2018 Outlook